Tank Model to See The Effect of Land Use Changes on Runoff,
Infiltration and Groundwater in Sub
Watershed of Konaweha
South East Sulawesi Indonesia
Ridwan Adi Surya1*, M. Yanuar J. Purwanto1,2, Asep Sapei2, Widiatmaka1,3
1.Study Program of Natural Resources Management and Environmental, Graduate School Bogor Agricultural University, Baranang Siang Campus, Pajajaran Street, Bogor 40173, Indonesia 2. Department of Civil and Environmental Engineering, Bogor Agricultural University
IPB Campus Dramaga Bogor 16680, Indonesia
3. Department of Soil Science and Land Resources, Bogor Agricultural University, Bogor, Indonesia
*
E-mail of the corresponding author: [email protected]
Abstract
Water supply is closely related to geographical and climatic factors on the watershed area. Tank model is one of the hydrological models used to analyze the characteristics of river flow using the data of rainfall and climate. This study was aimed to analyze the flow rate by using a tank model, which can describe the magnitude of hydrological processes, namely runoff rate, infiltration capacity, and ground water content in the sub-watershed of Konaweha. The study site was on the catchment area of the Wawotobi dam of Konawe Regency, South East Sulawesi Province, Indonesia. The study results showed that the conservation activity on the catchment area of the Wawotobi dam have a role in increasing the river flow rate and water infiltration into the soil. The pattern of land management that involves the conservation aspects resulted in a lower runoff or discharge rate, a greater value of infiltration and ground water content that can fill into a greater depth. In this case, the land use that takes into account the conservation aspects is very important in keeping the interval between maximum and minimum discharges or river flows, that is, not too big flow. This model of tank can also be used to predict the river flow at various watershed land uses on the sub-watershed area of Konaweha.
Keywords: tank model, infiltration, watershed, conservation, rainfall
1.
IntroductionRain is one of the climate elements that affect watershed area. The direct influence that can be seen is the potential of water resource. The volume of the water resource in a watershed is highly dependent on the amount of rainfall existing in the watershed. The change in land use with the biggest effect on the sustainability of water resource is a change from forest to other uses such as agriculture, plantation, housing or industries. If these activities are not managed properly, it will cause excess water (flood) during the rainy season and drought during the dry season. Unwise change in land use not accompanied by conservation measures will cause most rain to fall as surface discharge (runoff). It is expected that the balance between water supply and water demand can used to analyze and plan for the water supply or needs for agricultural, domestic, industrial and other purposes as efficiently as possible. Therefore, the existing pattern of land management needs to be reviewed by looking at the conservation aspects of water resources. Watershed management models are aimed at maintaining water quality comprehensively on the watershed areas. Water conservation can be defined as an effort to increase the amount of ground water that goes into the soil and to create an efficient water use. Each treatment given to a piece of land will affect the water system on its location and downstream areas. Therefore, soil conservation and water conservation are two things that are closely related, so it can be said that the various soil conservation measures are also water conservation measures (Arsyad, 2000). There are many reports of hydrological models used to analyze the characteristics of river flow using the data of rainfall and climate (Sugawara, 1961; Bosch J. M. et al., 1982); Haan C. T. et al., 1982; Linsley et al., 1986; Goto A. et al., 1997; Cheamsar, 2000; Sutoyo et al., 2000; Harmailis, 2001; Suroso, 2006). A tank model is a method which is based on the hypothesis that the
flow of runoff and infiltration is the function of the water amount in the soil (Sugawara, 1961). The model can be constructed in such a way to represent a number of sub-watersheds of the area, or represent the differences in the structure/type of soil in each layer. The tank model, besides being able to explain the initial loss of rainfall, and dependence on earlier rain, can also indicate some components that form the flow of runoff, having its own period and time lag. Also according to Sugawara (1961), the constructed tank model is the one that comes closest in its composition to each watershed. A tank with the drainage on the sides represents the runoff, the bottom drainage indicates infiltration, and the storage component can represent the runoff processes in a watershed or its part. A number of parallel similar tanks can represent a vast watershed (Linsley, et al., 1986). Therefore, this study was intended to (1) analyze the flow rate by using a tank model with the parameters of runoff rate, infiltration capacity, and ground water content, and (2) formulate an accurate scenario of tank model development to increase the potential of water supply in the sub-watersheds of Konaweha.
2.
Methodology2.1 Research Site and Time
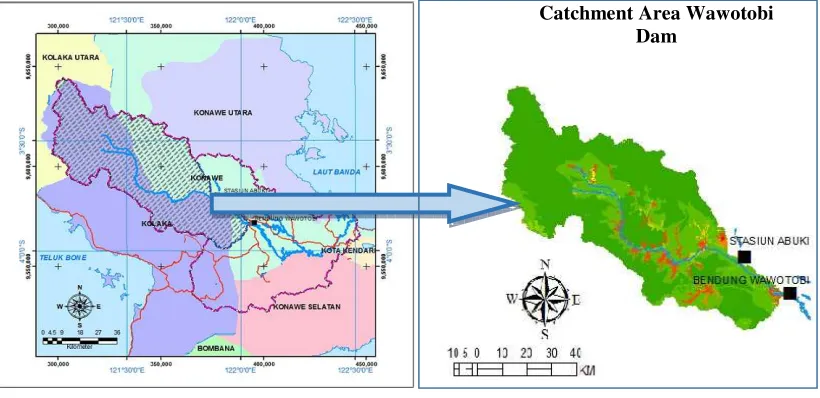
This study was conducted for one year from March 2012 to February, 2013 on the catchment area of the Wawotobi dam, the sub-watershed of Konaweha, Konawe Regency, South East Sulawesi, Indonesia and in Laboratory of Soil and Water Engineering, Department of Civil and Environmental Engineering, Faculty of Agricultural Technology, Bogor Agricultural University, Dramaga Bogor, West Java, Indonesia.
Figure 1. Study Area
2.2 Data Types and Source
The data used in this study are of secondary type consisting of (1) rainfall data of 2009 and 2011 from the rainfall observation station of Abuki, (2) daily discharge data of 2009 and 2011 at Wawotobi Dam, (3) climatological data of 2009 and 2011 from Wawotobi station, (4) land use maps of Konaweha sub-watershed in 2009 and 2011, (5) topographic map of Konaweha watershed, and (6) type of soil data. The tools used in this study include computers software.
2.3 Data Analysis
The tank models describe the processes of watershed runoff, which are then formulated into a mathematical equation. The runoff processes start from the rain, infiltration, and percolation, and to the intermediate flow, and finally to the formation of base flow. The accumulation of all kinds of runoff is the river discharge or runoff of a watershed. Stages of data analysis are as follows.
a. Land Cover
This study was done to observe the biophysical condition of land and land cover on the catchment area of Wawotobi dam and its effect on the water balance. The biophysical characteristics were analyzed descriptively. For the analysis of land cover changes that occurred in the catchment area of Wawotobi dam, a computer software and GIS software (geographic information systems) were used. The geographic information system ArcGIS was used to compare the maps of land use in two different years, namely in 2009 and in 2011 on the catchment area of Wawotobi dam.
b. Analysis of Rainfall
Rainfall data were collected from the rain observation station Abuki for the year of 2009 and 2011 on Konaweha watershed. This rainfall is considered the only input in the system, thus no other inputs. In this study, daily rainfall data available is only from one observation station only, so the rainfall data is considered as the region’s rainfall that describes the rain condition of the watershed.
c. Analysis Evapotranspiration
The evapotranspiration rate of a region is affected by the local climate such as temperature, wind speed, solar radiation, and humidity. The evapotranspiration values were calculated using the Penman method. From the Penman equation, the evaporation value of open water surface Eo was obtained, by taking into account the H and
Ea which include energy (light) and aerodynamics (wind and humidity). ETo values for the climate and a
particular place were calculated from the following equation (Wilson et al, 1993):
ETo = W x Rn + (1-W) x f (u) x (es – e)
Whereby:
ETo : evapotranspiration of referred plants (mm/day)
W : weighting factor related to temperature Rn : net radiation in evaporation (W/m2/day)
f(u) : function related to wind
(es-e) : difference between the saturated vapor pressure at the mean temperature and the actual vapor pressure
(mmHg)
After the value of ETo, the plant’s water requirement is determined, ETc is obtained from the following equation;
Etc = Kc x ETo
whereby Kc is the plant coefficient.
d. Analysis of River Discharge
River discharge is the output of the sub-watershed in a water balance system. The discharge volume of the river itself is the sum of the runoff rate and the rainfall that falls directly or received by the river surface extracted by the evaporation on the river surface. The discharge data analyzed were the daily discharge from the sub-watershed of Konaweha at Wawotobi Dam.
e. Construction of Tank Model
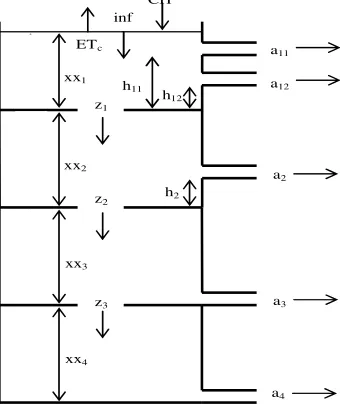
The constructed tank model is of four vertically-connected tanks. In this tank model, the output of the first tank illustrates the surface runoff, the output of the second tank represents the intermediate flow, and the outputs from the third and fourth tanks are the base flow. The tank scheme for each land use on each sub-watershed is presented in Figure 2.
Figure 2. Tank models used in this study
f. Program
A program was made by using a computer to determine the total runoff. Mathematical equations that represent the runoff were transformed into the computer programming language. The resulted program was used to calibrate and validate the model using the existing data. This program was made on the worksheet using Microsoft Office Excel 2007. The basic equation for the first tank is as follows;
xx1(t) = xx1(t-1) + CH – Etc – z1.xx1(t-1) – [(xx1(t) – h11) a11 + (xx1(t) – h12)a12] ………...… (1)
while the river discharge (Q) is calculated by the following equation ;
Q(t) = [(xx1(t) – h11) a11 + (xx1(t) – h12) a12] + [(xx2(t) – h2) a2] + xx3 (t).a3 + xx4(t).a4 ………….… (5)
Whereby:
xt : Height of groundwater content (GW)
ha : Height of stored water (height of outlet hole)
Z : coefficient of infiltration hole a, b : coefficient of outlet hole CH : Rainfall depth
Etc : Actual evapotranspiration
t : time (day) i : 1, 2,.., 4
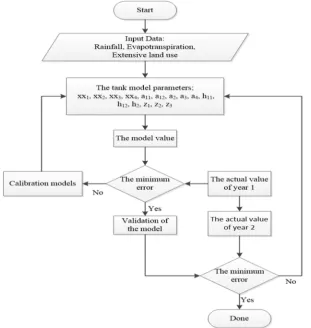
The flow chart of the mathematical concept of models to determine the performance parameter of root water uptake can be seen in Figure 3.
Figure 3. Flowchart of mathematical concept of models
g. Model Calibration/Verification
The model was calibrated by comparing the discharge of the model and the daily actual flow. Calibration is performed repeatedly with the trial and error method for the model parameters in order to obtain a model with the discharge value that is closer to the actual discharge with the coefficient of determination of more than 0.8, which means that the model output has represented the accuracy of more than 80% of the actual discharge. h. Validity Test/Model Validation
Model validation is done by performing a simulated discharge estimation using the calibrated model based on the data of rainfall, discharge and daily evapotranspiration in the model verification process. The benchmark of the validity test of the model is based on the following two aspects:
1) The resulted graphical relationship between the model discharge and the actual discharge so that the absolute maximum and minimum values can be determined from the collected data.
2) The determination coefficient (R2) is calculated with the following equation;
R2 = 1 – [ ∑ (yi – xi) 2
/ ∑ (yi – y) 2
] ..………...………….…… (6) Whereby:
yi = actual discharge n-I
y = mean of actual discharge, and i = 1,2,3,…,n.
3.
Results and Discussion3.1 Calibration of Tank Model
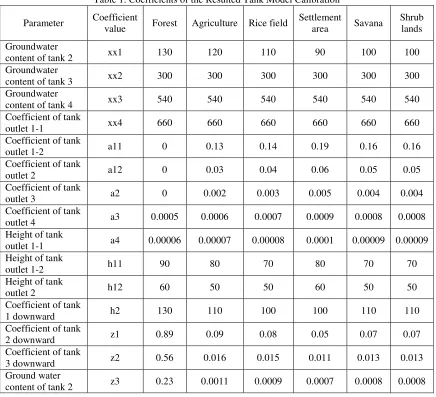
This was based on the daily rainfall data of 2009 and to obtain the discharge value of the model. The values of the parameters were determined by a trial and error method to produce a model that approaches the value of the actual discharge with the largest coefficient of determination (R2). The parameter values determined by the trial and error method are among others soil water content (xx), hole height of tank outlet (h), coefficient of the tank outlet hole (a), and coefficient of downward tank holes (z). Table 1 shows the coefficient values of parameters from the resulted calibration using the 2009 data, with the coefficient of determination (R2) of 23.81 %, as a result of the lack of actual data. Then, calibration was made with the reference to the daily data for one month in March 2009, which was the best discharge data available and corrections were made to the discharge data of the other months. After the tank model was calibrated, it could be used for the next stage.
Based on the coefficient values of the calibrated tank models, it can be seen that the coefficient of the tank outlet (a) gets smaller as it goes down because the deeper the soil layer, the smaller the ability of soil to run off the water. Similarly, the coefficient of the downward tank (z) gets smaller as it goes down because the deeper the soil layers, the smaller the soil's ability to carry water to deeper layers (percolation). From the results of the calibrated tank model, it was found that the soil water content (xx) was the highest in the fourth tank. The water content in the soil at the depth level of each tank is heavily influenced by the types of plants that live on it because each plant has a different depth of rooting, so the ability to transport water from the ground is different.
Table 1. Coefficients of the Resulted Tank Model Calibration
Parameter Coefficient
value Forest Agriculture Rice field
Figure 4. Land cover used in the model
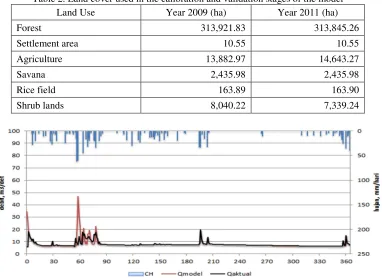
Table 2. Land cover used in the calibration and validation stages of the model
Land Use Year 2009 (ha) Year 2011 (ha)
Forest 313,921.83 313,845.26
Settlement area 10.55 10.55
Agriculture 13,882.97 14,643.27
Savana 2,435.98 2,435.98
Rice field 163.89 163.90
Shrub lands 8,040.22 7,339.24
Figure 5. Graph of the resulted calibration of tank models using data of 2009
3.2 Tank Model Validation
Figure 6. Graph of the resulted tank model Validation based on the data of 2011
3.3 Model Analysis to Measure the Total Runoff, Infiltration and Groundwater Content of Each Land Use The next stage was the analysis of the model to determine the total runoff or discharge, total infiltration and groundwater content of each land use. The analysis results are presented in Figure 8-10. The rates of total discharge, infiltration, and groundwater content were used to determine the water condition in the watershed of Konaweha.
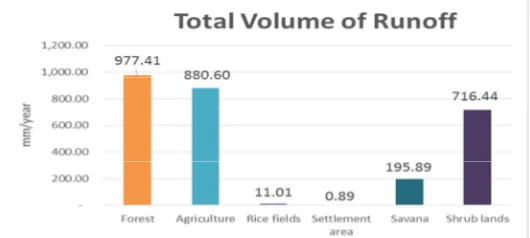
Figure 8. Total Runoff of the Sub-watershed of Konaweha in 2011
From the graph of the total runoff and infiltration, it can be seen that the forest land use and mixed agricultural land has a major role in increasing river flow. In addition, the forest land use management can improve water infiltration into the soil to absorb the quite large volume of water for use in the dry season.
Figure 9. Total Infiltration of each land use on the sub-watershed of Konaweha in 2011
Figure 10. Volume of groundwater in each land use on the sub-watershed of Konaweha in 2011
In the graph it can be seen that the forest land use management has the greatest content of groundwater in the sub-watershed of Konaweha; this is so because there is a close relationship between the components of soil, water and vegetation. Soil is the medium for the growth of vegetation. Different soil types have different characteristics in terms of physical, biological, or chemical properties. Soil properties can determine the type of nutrients in the soil, the water volume that can be stored in the soil, and the root system that reflects the water circulation in the soil. The ability of soil to absorb water is reflected in the type of vegetation at ground level. The vegetation function can effectively reflect the ability of soil to absorb rain water, maintain or increase the rate of infiltration, and demonstrate the ability to hold water or water retention capacity (Schwab et al, 1993). The forest land in the study site is dominated by Podsolic soil type and the Mediterranean type. The former is the soil with the clay accumulation horizon (argillic horizon) and the base saturation of less than 50%, and without having albik horizon. Meanwhile, the Mediterranean type is similar to the Podsolic soil in that it has argillic horizon but has a base saturation of more than 50%. Soil Conservation Service (SCS) of the United States has developed an index called the Runoff Curve Number (CN). This number states the collective effect of soil, hydrological condition, and previous water content (U.S. Soil Conservation Service, 1997). Based on the soil classification system developed by SCS, the soil type in the study is categorized into the hydrologic group of type C, i.e., clay soil, sandy clay, soils of low organic matter, and soils of high clay content. The graph above shows that the total runoff on the forest land is 977.41 mm/year and the total infiltration is 1,685.9 mm/year. Infiltration process is influenced by several factors such as soil texture and structure, early water supply (soil humidity), biological activity and organic matter, the type and depth of litter, and undergrowth or other ground covers (Asdak, 1995). The forest land in the study site is in general categorized as having rapid infiltration because the contributing factors such as the blocky structure somewhat rounded, smooth, weak and crumbly. The soil texture is dominantly of clay to silty clay, with the soil pore indicative of adequate macrospores and meso pores. The soil drainage or water seeping rate into the soil in terms of the duration and frequency of saturated water is good/moderate. The vegetation covering the ground surface of forest land is in the form of hard trees whose roots make cavities in the soil, causing the water to infiltrate more easily into the ground. The plant roots can penetrate the soil and form cavities in between so that the water easily enters the cavities between the roots. It is also related to the large ground water content in forest land, amounting to 1,659.95 mm/year.
3.4 Application of the Tank Model Scenario to Increase the Potential Water Supply in the Sub-watershed of Konaweha
The next stage was to analyze the scenarios of tank model (business as usual, pessimistic, moderate, and optimistic) in order to determine which scenario is the most accurate to use in the management of land use (forest, farming, rice field, housing, savanna, and shrubs) in the sub-watershed of Konaweha to reduce runoff and increase the potential water supply in the sub-watershed of Konaweha through the conservation of water resources. From the resulted analysis of the models, some scenarios were formulated to apply the tanks models for increasing the potential water supply in the sub-watershed of Konaweha, namely (1) a pessimistic scenario (holding on the existing condition while improving the conservation of water resources marginally); (2) a moderate scenario (improving the water resource conservation but not optimally; and (3) an optimistic scenario (improving the water resource conservation comprehensively and integratedly involving related stakeholders). a. Total Volume of Runoff Model
Figure 11. Total Volume of Runoff on the water-shed of Konaweha with the Scenarios
From the Figure above it can be seen that the change in the land use pattern in a region can influence the water volume coming out from a watershed system. From the whole result of simulations, a conclusion can be made that the water conservation effort in the forest land, mixed-farming land, rice field, housing, savanna, and shrubs can minimize the maximum water volume and increase the minimum volume. This means that not all of the rainfall on a watershed system directly flows to the river, but it is stored first in the soil in the form of soil water (soil water reserve). The methods of water conservation includes the use of plants or plant remains, which is called a vegetative method, and the manipulation of soil surface and the construction an erosion-preventing structure, called a mechanic method (Arsyad, 2000).
The water resource conservation applicable on the forest land can include reforestation particularly on the deforested region as a result illegal logging. The water resource conservation that can be applied on the agriculture land is by making mounds or terraces. On the rice field, water conservation can be in the form of bench terraces and improved irrigation. On settlement area the conservation effort can be made by improving drainage and applying the water absorption technology such as absorption wells or water absorption holes around the settlement area. On savanna, it can be done by building terraces and growing permanent grass. On the shrub area, what can be done for water conservation is the making of bench terraces and planting shrubs with good cover plants. The most important effect of conservation technique is the reduced rapid surface flow and the increased slow flow (base flow), i.e. the flow from the underground. The surface flow decreased from 2,729 mm/year on the existing condition in 2011 to 2,093 mm/year on the optimistic scenario.
b. Total Infiltration of Model
The rainwater entrance into the soil and going to the surface of soil water is called infiltration. This involves three processes independent of one another, namely rain water going through the pores of soil surface, water stored in the soil and the process of water flow to other places (Sutoyo, 1999).
Figure 12. Total Infiltration on the watershed of Konaweha with a Scenarios
The comparison of total infiltration on each land use management was based on the comparison of infiltration values obtained from the various scenarios (business as usual, pessimistic, moderate, and optimistic). From the resulted calculation, it was found that the best scenario to increase the infiltration rate that could occur to each unit of analyses on land use management was the optimistic scenario, with the biggest total infiltration of 56,419 mm/year. The most significant effect of conservation was the increased infiltration value from 55,782 mm/year in the existing condition of 2011 to 56,419 mm/year with the optimistic scenario. The infiltration value of each unit of land use management with the effort of water conservation (optimistic scenario) had a higher infiltration value compared to the land use management without water conservation efforts. The infiltration rate was determined by the infiltration capacity and the water supply rate. If rain intensity (water supply rate) is smaller
2,729
2,444
2,188
2,093
1,000 2,000 3,000
Business as Usual
Pesimistic Moderate Optimistic
m
m
/y
e
a
r
than that of the infiltration capacity, then the infiltration rate is equal to the rain intensity. If rain intensity exceed the infiltration capacity, then standing water occurs in the soil surface or runoff.
c. Total Amount of Groundwater Model
The biggest infiltration rate occurred to the low groundwater content. The higher the groundwater content, the smaller the infiltration rate; and this will reach a constant minimum rate on the water-saturated soil. The properties of various soil layer profiles determine the speed of water entrance. On the cultivated soils, water downward movement is often hindered at the upper layer because soil aggregates have been dispersed and soil pores clogged by clay and dust (internal erosion), or by the formation of a plow sole layer that occurs as a result of repeated soil cultivation on a wet condition at the same depth. A coarse-textured soil layer under a finely textured layer inhibits downward movement of water before the finely textured layer is saturated with water.
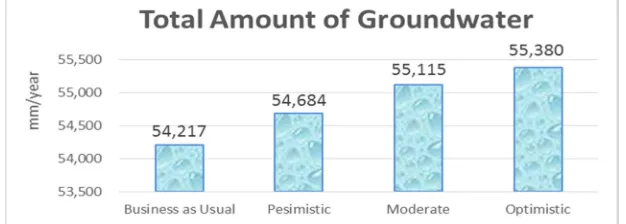
Figure 13. Total Amount of Groundwater in the sub-watershed of Konaweha with a Scenario
As shown in the figure above, the groundwater content increased from 54,217 mm/ year in the existing condition of 2011 to 55,380 mm/year (optimistic scenario). This occurs because the soil conservation with the vegetative methods (cover crops) can increase the rate of water infiltration that occurs in the soil layers, thus increasing the soil water content in the deeper soil layers. There are several ways to influence the infiltration and percolation by one factor already mentioned above. The amount of water that enters the soil can be increased by increasing the water deposit as a result of cultivation, making of bedding or cultivation adjusted to soil contour. Reducing the amount of evaporation by mulching can, for example, also increase the amount of water that goes into the ground.
Fertilizing with organic fertilizers and covering the soil with plants or plant remains can also increase the infiltration capacity. Holes or cracks in the soil created by ground animals, such as worms and insects, increase the amount of water that seep into the ground. The loss of water from the soil profile by the drainage system, transpiration and evaporation makes the soil pores empty, allowing the soil to absorb more water during the next rain. New approaches and policies are required so that soil conservation can be widely accepted and implemented at reasonable costs. The new approach is based on the improvement in land use system that leads to the growing of better vegetation ground cover. Such a system can protect the soil from erosion, improve soil fertility, increase soil organic matter content, and maximize the absorption of water by soil. Seasonal crops, grass, or trees grow better, the yield increases and the farmers can get benefit (Arsyad, 2006).
Policies and programs are required that can ensure people's participation on a large scale in the conservation of water resources for the many benefits derived from this action. To make this happen, the local government still needs to take full responsibility and control in conservation, but its main role is to encourage the participation of rural communities in finding and implementing a solution. To ensure the application of the water conservation on a wide scale with an acceptable cost, the national policy should be aimed at three related objects, namely (1) improving land use and management, (2) encouraging a full participation of all elements of society, and (3) developing institutions that provide a range of support needed by land users.
4.
Conclusions and Recomendation4.1 Conclusions
1) The volume of runoff in the forest land use management is the biggest (977.41 mm/year), which is comparable to the size of the largest forest if compared to the size of other land use management. The infiltration value on forest land is the biggest (1,685.9 mm/year) compared to that of other land use. This is so because the cover crops on forest land can increase the rate of water infiltration into the soil layers, thus increasing the soil water content in the deeper soil layers. The largest amount of ground water content is on the forest land, with the volume of 1,659.95 mm/year. This is caused by the absorption of water carried by the roots of cover crops on the forest land.
improvement of irrigation and drainage, water absorption and application of technology such as catchment wells and leach pit technology or biopori around residential areas, will result in smaller discharge of runoff compared with the business as usual scenario without water resource conservation; this means that the water conservation can hinder the surface flow rate, thus lowering the runoff on the upper layers of the soil. 3) The volume of surface runoff dropped from 2,729 mm/year in the existing condition of 2011 to 2,093
mm/year (optimistic scenario) after the application of conservation land, which means a smaller possibility of water shortage in the dry season. The infiltration value on each unit of land use management with soil conservation (optimistic scenario) has a greater infiltration value compared with the unit without soil conservation efforts (business as usual scenario). The total value of infiltration increased from 55,782 mm/year in the existing conditions of 2011 to 56,419 mm/year with the implementation of the optimistic scenario. This happens because the vegetative method of conservation (cover crops) can increase the rate of water infiltration into the soil layers, hence increasing soil water content in the deeper soil layers. The ground water content increased from 54,217 mm/year in the existing conditions of 2011 to 55,380 mm/year (optimistic scenario). Groundwater content in each unit of land use management with conservation efforts can fill up in a greater depth due to the absorption of water by the roots of cover crops.
4) From the above results it can be concluded that the conservation of water resources could improve the potential groundwater content. The role of land use that takes into account the aspects of water resource conservation is very important in keeping the interval between the maximum and minimum river flow at a moderate level, or not too high. This tank model can also be used to predict the river discharge or flow in various land use at the sub-watershed of Konaweha.
4.2 Recommendation
Tank model that used in the simulation study can be used as a basis for the development of a more perfect simulation model, and this model still needs to be tested in other watersheds with different characteristics with the location of this study, as well as have a data source with a more complete time series.
References
Arsyad S. (2006). “Konservasi Tanah dan Air”. Bogor. IPB Press.
Asdak, C. (1995). “Hidrologi dan Pengelolaan Daerah Aliran Sungai”. Gadjah Mada University Press. Yogyakarta.
Bosch, J.M., and Hewlett, J.D. (1982). “A Review of Catchment Experiments to Determine the Effect of Vegetation Changes on Water Yield and Evapotranspiration”. Journal of Hydrology, 55: 3-23. Calder, I.R. 1998. Water resources and land use issues. SWIM Paper 3. Colombo. IIMI.
Cheamsar (2000). “Rainfall-Runoff Modelling for Ciliwung Watershed in West Java, Indonesia”. Thesis Master of Science in Agricultural Engineering in Bogor Agricultural University.
Goto, A., T. Sato and M. Tatano (1997). “Runoff Analysis of Midstream Basin of the Mekong River Using 4x4 Tank Model”. Proceeding of Annual Meeting of Japanese Society of Irrigation, Drainage and Reclamation Engineering. July 1997. Japan.
Haan C.T., H.P. Johnson; D.L. Brakensiek (1982). “Hydrology Modelling of Small Watersheds”. An ASAE Monograph Number 5 in a series published by American Society of Agricultural Engineers. 2950 Niles Road, P,O, Box 410 St. Joseph, Michigan 49085 p: 411- 417.
Harmailis (2001). “Modifikasi Model Tangki untuk Mempelajari Pengaruh Pengelolaan Lahan Berdasarkan Ketersediaan Air (Kajian Pengelolaan Air yang Berkelanjutan)” Tesis. Program, Pascasarjana IPB. Bogor.
Linsley R. K, Kohler M. A, Paulus J. J. H. (1986). “Hydrology for Engineers”. Mc. Graw Hill Inc. New York. Schwab, G.O., R. K. Frevert and T. Barnes (1966). “Soil and Water Conservation Engineering”. Third Edition.
John Wiley & Sons Inc. New York.
Schwab, G.O., D.D. Fangmeier, W.J. Elliot, R. K. Frevert (1993). “Soil and Water Conservation Engineering”. Fourth Edition. John Wiley & Sons Inc. New York. 507 p.
Sugawara M. (1961). “On the Analysis of Runoff Structure about Several Japanese Rivers”. Japanese Journal of Geophysics, Vol. 4 No. 2. March 1961. The Science Council of Japan. Japan.
Suroso dan Susanto, H.A. (2006). “Pengaruh Perubahan Tata Guna Lahan Terhadap Debit Banjir Daerah Aliran Sungai Banjaran”, Jurnal Teknik Sipil Vol. 3 No. 2 Juli 2006. Universitas Jenderal Sudirman.
Sutoyo, Purwanto, M. Y. J., Yoshida, K., and Goto, A. (2000). “Prediction Based on Rainfall Data Using Tank Model for Cidanau Watershed”. Proceeding of International Seminar on Environmental Management for Sustainable Rural Life Vol. 2 February 19th 2000. Bogor.