Land Use and Land Cover Classification from ETM Sensor Data : A Case Study from
Tamakoshi River Basin of Nepal
Uttam Sagar Shrestha, PK Campus, Tribhuvan University,
Email: [email protected]
KEY WORDS : Land use, land cover, Land sat , supervised
ABSTRACT
:The mountain watershed of Nepal is highly rugged, inaccessible and difficult for
acquiring field data. The application of ETM sensor Data Sat satellite image of 30 meter pixel
resolutions has been used for land use and land cover classification of Tamakoshi River Basin (TRB)
of Nepal. The paper tries to examine the strength of image classification methods in derivation of land
use and land classification. Supervised digital image classification techniques was used for
examination the thematic classification. Field verification, Google earth image, aerial photographs,
topographical sheet and GPS locations were used for land use and land cover type classification,
selecting training samples and assessing accuracy of classification results. Six major land use and land
cover types: forest land, water bodies, bush/grass land, barren land, snow land and agricultural land
was extracted using the method. Moreover, there is spatial variation of statistics of classified land uses
and land cover types depending upon the classification methods.
1. Introduction
Land use refers to the land, which is used for
specific purposes with some sort of
management practice and land cover is the
biophysical state of the of the earth surface
captured in distribution of vegetation, water,
desert, ice and other physical features of land
including those created by human activities
such as mine exposure and settlements
(Baulies and Szewach, 1998). Land use
involves both manner in which the biophysical
attributes of land are manipulated and the
intent underlying the manipulation- the
purpose of which the land is used (Turner et. al
1995).
The remotely sensing is only means for
studying a spatial variation of attributes of
land use and land cover.
Optimum land use planning is perceived as indispensible factor for ensuring food security, environmental sustainability and economic development (Houet et al, 2006). The analysis of land use and land cover is crucial for planning any development actives in river basin. The spatial information science could only provide actual data for the analysis. In the recent years the data analysis from the remotely sense is increasing. There are various types of data a aila le for a al sis. Despite the great potential of remote sensing data and it advancement , the degree of information to be assessed depends upon the specific purposes, selection of sensor, availability of data and particularly computer –assisted image classify action schemes(Jensen, 1996). The classification of date acquiring through pixels based classification is more prominent in the country like Nepal, though other types of data arealso a aila le. Pi el ased lassifier are pri e
mechanism under classification procedure of satellite imagery based on multi-spectral classification techniques. Under this procedure, a pixel is assign to class based on statistical similarities of reference with respect to set of classes (Gupta, 2003). The river basin is composed different types of land use – forest, agriculture, settlement, snow land, bush and other types. With
consideration all these classification supervised and unsupervised were used for examining the land use and land cover thematic classification. The present paper attempts to discuss coverage of land by different land in Tamakoshi river basin.
2. Methods and materials 2.1 Study Area
The study area is located in Dolakha and Ramechhap districts, Janakpur Zone in the Central Development Region (CDR) of Nepal.
Geographically it lies between the latitudes 280 N a d 0 N a d lo gitudes 0
E a d 0 E. The area is accessible
from Kathmandu via 190 km long asphalt road.
Tamakoshi River is snow -fed and has river
basin area of 2,700 sq km and originates from
China. It is one of the tributary of Koshi
drainage basin. Snowmelt and monsoon rain
are the main sources of run-off with a mean
annual basin precipitation of about 1,153mm
(Department of Meteorology and Hydrology
ICIMOD, 1996). The River basin is
surrounded by the Gauri Shankar Himal in the
north; Khimti, Likhu and Dudh Koshi basin in
the east; and Sunkoshi basin in the west and
south. The river consisting of two land forms:
narrow gorge in the northern parts which are
mostly rugged mountain and U-shape with
river valley in the south.
The climatic variation is also varied in the
corridor ranging tropical in Biteni, confluence
between Tamakoshi and Sunkoshi to
temperate in the upper side. The maximum
average temperature of the area is 34
0celsius
and minimum 8
0cesius (Department of
Meteorology and Hydrology, 1996 ).
Brown 2005; Brown, Pinzon, Didan , et al,
2006)
The methodology is based on remote sensing image classification of the study area. The Land Sat- spectral ETM+ senor covering whole TRB area of date February 2014 was obtained from the global land facility. The spatial resolution of the image was 30 meter and sensor was selected for the study as it is freely available and the image is free of cloud. The scanned top sheet were imported in ERDAS Imagine 2011 and geo-reference with the parameter of Modified U i ersal Tra erse Mer ator s (MUTM) used by Survey Department. The resultant root mean square error (RMSE) was reduced to less than a pixel. Absolute pixel error of more than one pixel can be caused of concern in multi-temporal studies (Symenoskie et. al, 2006). Geo-coding is essential for comparing spatially corrected maps and vector overlay analysis. Map to image registration was performed to rectify the 2001 ETM + image to the top sheets with the MUTM projection parameters using first degree polynomial equation of image transformation.The
3. The Satellite Data and Image Processing
3.1Ground Reference Data
Sufficient ground reference is required for image classification. For this, sufficient accuracy assessment were obtained from integrated use of GPS, Google earth, ETM + image, aerial photographs , top sheets ere used ruing the field survey from July 11 to 18 , 2014. These ground reference data were used for preparing signature of classification training samples and for evaluating the accuracy of classified maps.
4. Classification system
A land use and land cover classification system providing a framework for categorization. . Knowledge- based visual interpretation and Normalized Difference Vegetation Index (NDVI) were carried out. Ground reference data collected were employed in preparation of classification system. Six categorization of land use and land cover were to be extracted as thematic information from ETM+ sensor image.
4.1 Digital Image Processing
In process of preparation of land use and land cover thematic map, a large number of approaches have been adopted by many researcher assign satellite image for classification studies. In the present investigation supervised classification was used for classification. ERDAS professional software for image processing has been used for data analysis. After pre-processing phase of image analysis, following algorithms were used for classification train the algorithm to find similar pixels based on statistical parameters derived. It has the assumption that the sample pixels as a. training of discrimination among the classes. Maximum likelihood classifier, as the most commonly and
Classification accuracy assessment is considered an essential step in evaluation of different techniques in image classification (Foody, 2002). It establishes the performance of derived classified thematic map with ground truth or other geographical reference data set. A total of 200 test samples were randomly selected for accuracy assessment.
6. Results and Discussions
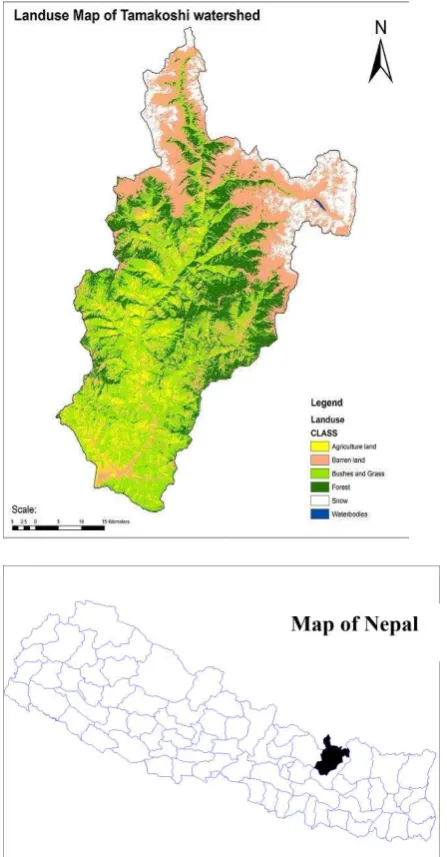
The standard false color composite map of medium spatial resolution sensor (ETM +) TRB of an input data is shown in Figure 1. In a visual color display, the false color composite image clearly shows unclassified bush (vegetation) and grass in light green, forest in dark green, agricultural land in yellow, snow land in white, water bodies in dark blue and barren land in pink. The study area was classified into six main classes like forest, water bodies, bush grasses, barren land snow and agricultural land in supervised classification techniques. Separation of road and built-up area in standard false color composite was difficult in medium spatial resolution satellite image, even though it is visible in other false color composite (521 as RGB) but it was mixed with dry/exposed farm land and bare soil. Such separation can be done in hybrid image classification integrating both of these methods and ground truth reference data.
The thematic map of the study area and quantitative spatial extent of different land use/cover types is depicted in Table 1. The quantitative spatial statistics derived from supervised classification methods has been shown in Table 1 in figure 1. The bush land with grass dry exposed land stands as largest land use among all other types representing 34.62% and followed by barren land 27.93 % respectively.
Table 1, Land use and land cover classification
Fig 1, Land use and land cover classification
Landuse class Area(Sq.km) Area(in %)
Forest 527.553 19.53%
waterbodies 1.2951 0.04%
unclassified 1.9836 0.07%
Bushes and
grass 935.2017 34.62%
Barren land 755.9694 27.99%
Snow 231.8184 8.58%
Agriculture
land 246.9942 9.14%
The forest land is clearly depicted but the settlement of nearby sides is also mixed with the forest type. The water bodies like river, glacier and glacial lakes are mixed in middle part of the basin. But water bodies with glacier lakes are depicted in north and north eastern part. The bush and grass land are widely distributed in northern and southern part. Snow land is widely found in the northern part. The distribution of agricultural land is concentrated in river valley, middle and southern part. The bush, grass and barren land occupied almost two third portions of total land. The portion of settlement is mixed with unclassified land. The reflection of sand, gravel, land slide are more in the upper part near Lamabagar, upper Lamabagar, Rolwaling valley, Manthali, Ranajor and Sukajor. The whole southern part of Manthali depicts either barren or bush and grasses. The nearest settlement is also mixed with this pixel.
Due to the limitation of pixel based classification in case of mixed pixels, both (supervised and unsupervised) classifications poorly scored the
users a d produ ers accuracies (Lu and Weng 2005)). In such complexity of mixed pixels, fuzzy classification has capability to deal with those pixels and greatly improves the user s a d
produ er s a uracies leading to overall and kappa statistics (Jansen, 2000).
In the super ised ethod, despite a produ er s accuracy of 90 percent for bush land use class,
there as a tuall . per e t user s a ura
in that particular class which actually means at least 1.97 percent of other class pixels was wrongly classified as bush area.
7. Conclusion
Image classification in TRB using medium spatial resolution sensor data and conventional parametric classifiers is a challenging task. The complexity in TRB arises with the representation of similar spectral reflectance from different land use/ cover types exhibiting spatial homogeneity that ultimately greatly enhance the problem of mixed pixels based on pixel classification. Beside
parametric, non-parametric classifiers were introduced to deal with the problem of pixel based classification. In order to achieve the accurate TRB high spatial resolution sensor image, intensive field study, selection of hybrid classifiers such as artificial neural network, fuzzy image fusion, texture measurement, decision tree, spectral mixture analysis and object based classification software should be advocated . In the present study only supervised classification method including their accuracies was examined to extract TRB land use / cover types using medium, spatial resolution sensor and ETM+ of Land sat satellite. The method was shown to be more effective in detecting thematic classes of complex TRB system.
References:
Adams, J.B, Sabol, D. E. Kapos, V. Almeida-Filho, R. Roberts, D.A. Smith , M O and Gillepsie, A.R .1995. Classification of multispectral images based on functions of end members ; application to land – cover change in the Brazalian Amazon, Journal of Remote Sensing Environs, 52: Bradil PP 137-154
Baulies , X and Szewach, G(eds). 1998. LUCC Data Requirement Workshop: Survey on Needs, Gaps and prioriies on Data for Land – Use/ Land Cover change research. LUCC Report series 3. Barcelona: Institut Cartografic de Catalunya.
Department of Hydrology and
Metrology(DHM)/ICIMOD. 1996. Climatic and Hydrological Atlas of Nepal, Kathmandu, ICIMOD/DHM, Nepal
Civco, D. Hurd, J. Wilson, E. Sang, M. and Zhang Y. 2002. A Comparison of land use and land cover Change detection methods. Journal of Remote Sensing Environ, 52: 127-144
Gupta, R. P. 2003., Remote Sensing Geology ( Second Edition) Berlin: Springer Verlag.
Huet T. and Laurence , H.M . 2006. modeling and projecting land –use land cover- changes with cellular automation in considering landscape Trajectories: An Improvement for Simulation of Plausible Future States, Proceedings, 5 pp 63-73
Jensen, J. R . 2005. Introductory Digital Image processing; A Remote Sensing Perspectives. London: Prentice Hall .
Lu, D. and Weng, Q . 2005. Urban Classification using full spectral information of landsat ETM
iagery Marion Country, Indiana, Photogrammetric engineering and remote sensing 2895 PP 823-870.
Symeonakis, J. P. R coppin and M.E Baur . 2006. Multi temporal land use /cover change detection in the Spanish Mediterranean coast. Med- term symposium: Proceedings of the ISPRS Commission VII Remote Sensing : From Pixels to processes : Enschede, The Netherland.
Turner II, B.L, Skole, D. Sanderson, S. Fisher, G. Fresco,L. and Leemans, R. 1995. Land–use and Land – Cover Change Science / Research Plan. IGBP Global Change Report No : 35 and HDP report No 7. Stockholm and Geneva; International Geo-sphere - Biosphere Program and Human Dimension of Global Environmental Change Program.
Tucker, Pizon, and Brown 2005. Brown, Pinzon, Didan , et al 2006. An extended AVHRR 8-km NDVI data set compatible with MODIS and SPOT