00074918.2014.939937
Teks penuh
Gambar
Garis besar
Dokumen terkait
Hence, earnings inequality, the transmission of earnings inequality across generations, the number and spacing of children, assortative mating, heterogeneous rates of return,
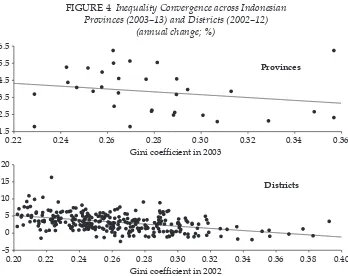
gence dynamics across districts in East Java and studies the impact of Indonesia’s 2001 iscal decentralisation on regional income disparities across these districts. East Java
Merchandise margin improved 100 bps driven by strength in our direct purchase offerings Cost controls and efficiencies contributed to EBITDA margin rising by 20 bps. Net
Sales growth and SSSG performance across geographic regions.. Geographic
This inequality is used both for Schoen-Simon-Yau type estimates and Ecker- Huisken type estimates for minimal submanifolds in higher codimension.. 5 Two Auxiliary Functions via Gauss
Furthermore, vertical coordination has a positive effect on improving the quality of fresh milk in both regions, though the study found that East Java has higher milk quality than West
Meanwhile, in West Java, the number of poor people in regency of Garut was identified to be in third place after Cirebon regency with 365,390 poor people in 2016 BPS, 2017..
This indicates that rising wage inequality is able to account for a large portion of the change in real wage cyclicality... Chapter 2 Inequality and Income When Information is Costly
