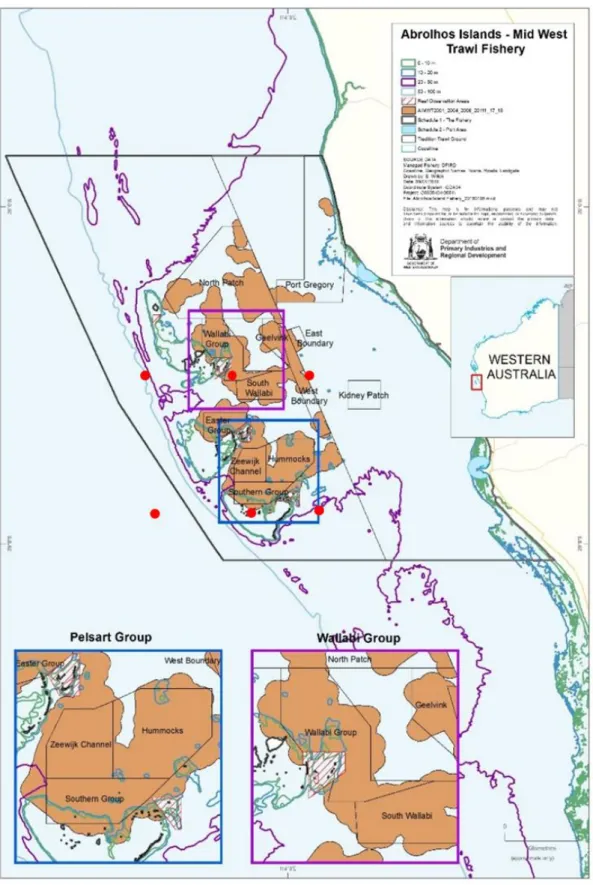
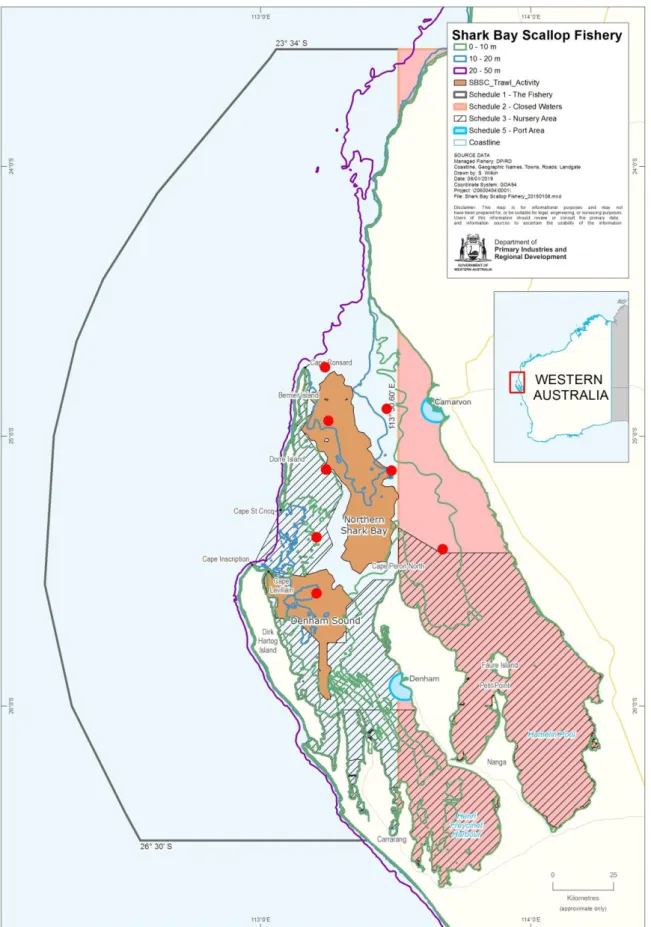
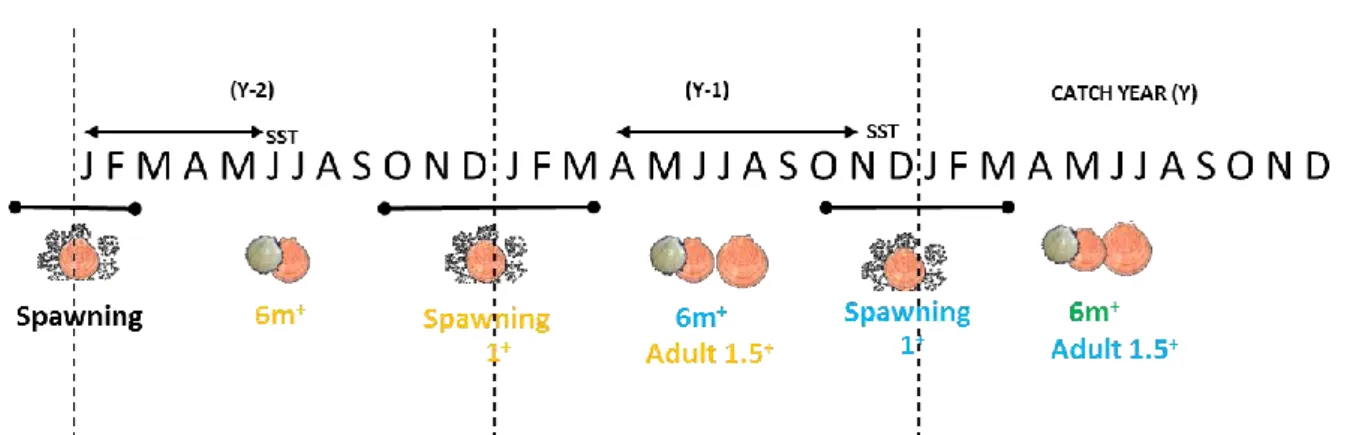
Standardized survey sites for scallops in the Abrolhos Islands in March 2017 and the release sites of the translocated scallops in the Easter Group (site 14) and the control site (corner of site 5). Water temperature seems to play a crucial role in the timing of spawning and the length of the spawning period.
Introduction
- Scallop stocks in Western Australia
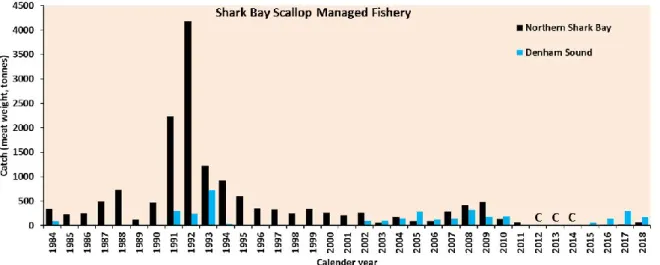
- Shark Bay
- Abrolhos Islands
- Rottnest Island
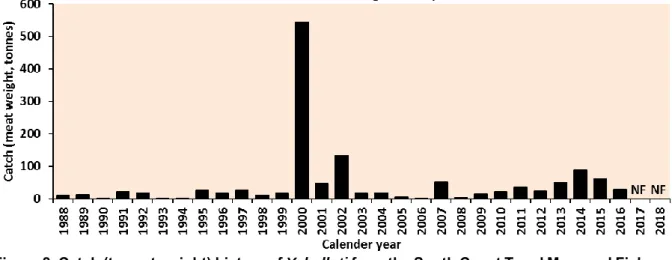
- South Coast
- Physical Oceanographic Processes
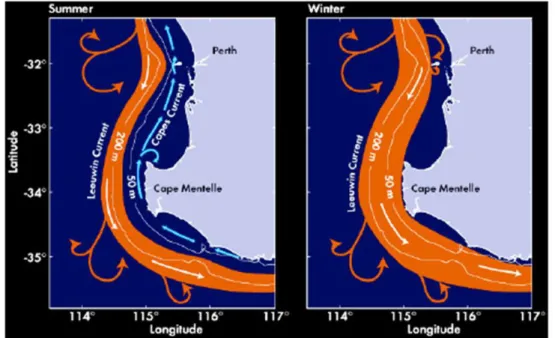
- Leeuwin Current System
- Coastal Currents
- Marine Heatwaves (MHWs)
- Scallop recruitment variability
- Assisted stock recovery
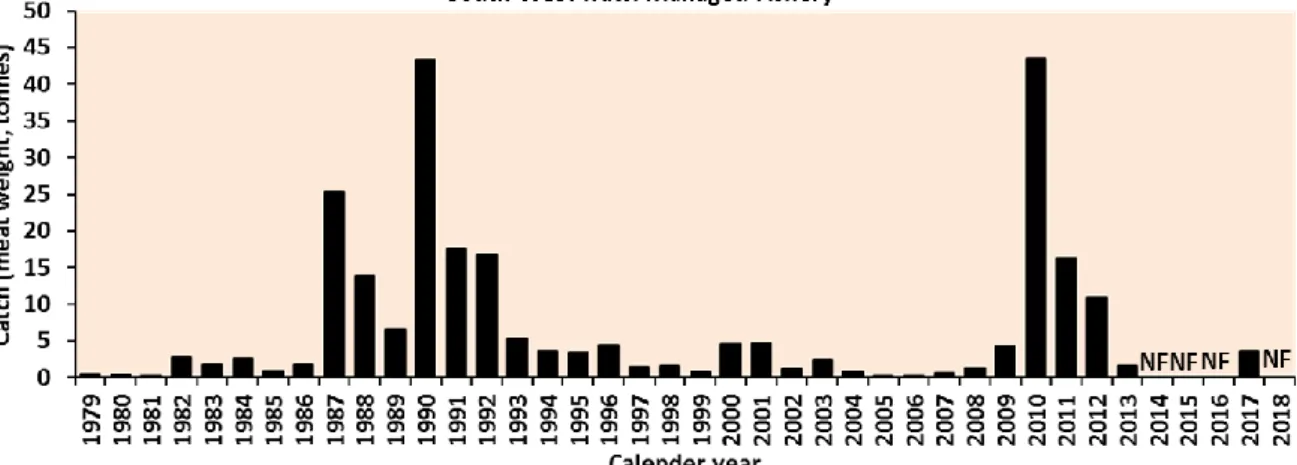
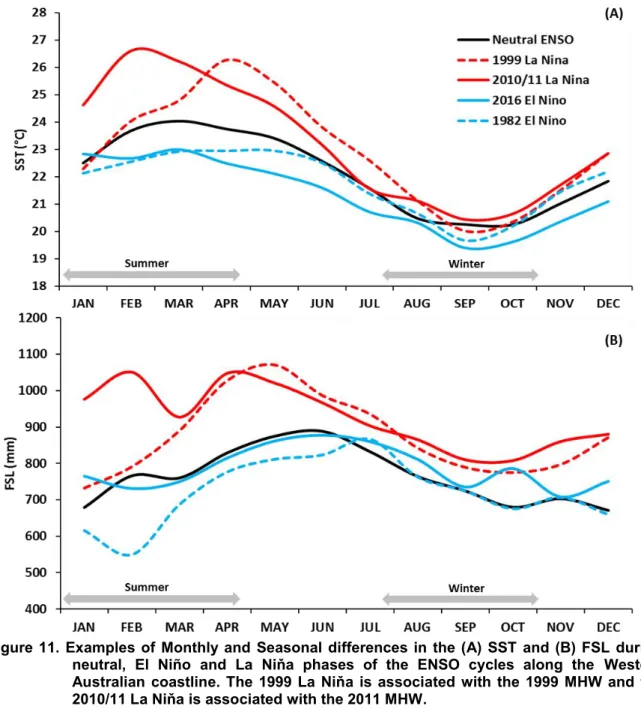
Ballot scallops are landed in the multi-species managed trawl fishery (SWTMF), which is mainly caught north-east of Rottnest Island (Zone A) (Figure 5). However, interannual variability of LC strength is associated with El Niño-Southern Oscillation (ENSO) events in the Pacific Ocean (Feng & Meyers 2011).
Objectives
The recent events and ongoing concerns require a re-examination of supply, recruitment and environment relationships for the WA scallop stocks. Ballot's dish of scallops has undergone improvement trials in Queensland (Dredge et al. 2002, O'Brien et al. 2005, Lucas et al. 2008) and WA (Cropp 1993, Scoones and McGowan 2006) with limited long-term success due to logistical and biological challenges and the inability to distinguish improved stocks from natural populations, these projects have been halted. However, the purpose of this project was to assess the feasibility of stock recovery following a major breeding stock decline and subsequent recruitment, not for the improvement of an existing fishery.
Subsequently, a natural recovery of stocks was observed in the southern part of the AI, while there was a poor recovery in the center and north of the AI. It was believed that environmental conditions had become conducive to the survival of recruiting scallops, but low breeding levels may have been the main factor preventing significant stock recovery in the other parts of the islands. Therefore, there was scope to continue at least part of phase 1b), through a small-scale experiment to test translocation and assess capture, processing, transport and deployment techniques in the AI.
Methods
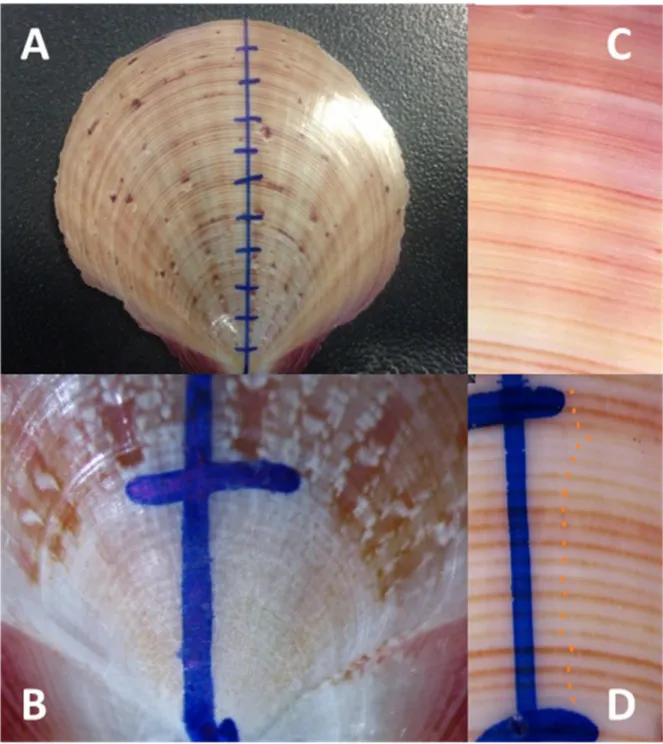
- Scallop ring counts
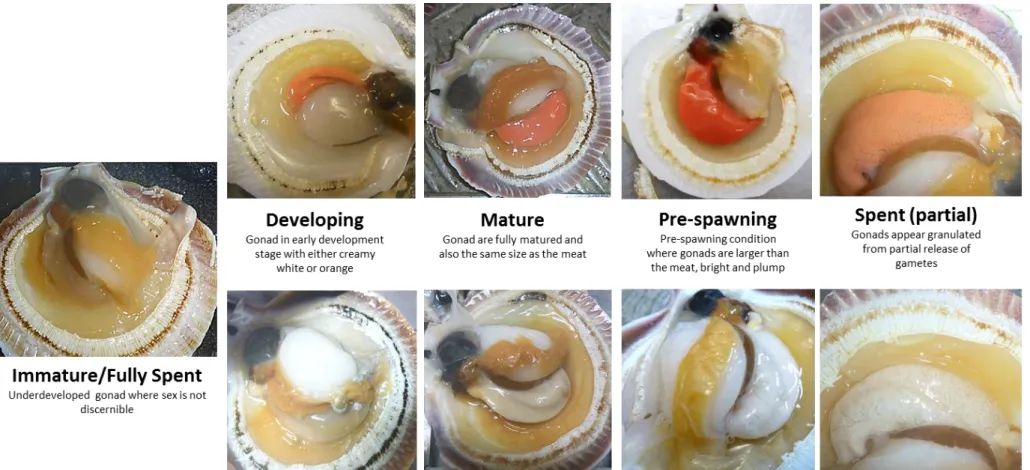
- Gonad condition
- Satellite and meteorological data
- Fishery-independent surveys (FIS)
- Translocation of scallops in the Abrolhos Islands
- Pre-translocation stock survey
- Post-translocation survey
Sufficient scallops were collected in the AI in December 2016 and February 2017, as insufficient scallops were available until November 2016 after the heat wave. The survey of the Abrolhos Islands in December 2016 resulted in the highest scallop abundance and catch rate (988 scallops/nm) since the stock's decline in 2012 (0.3 scallops/nm). The majority of the abundance was highly localized to the Hummocks region (25,626 individuals out of 29,469 total sampled), while all other regions had much lower abundance.
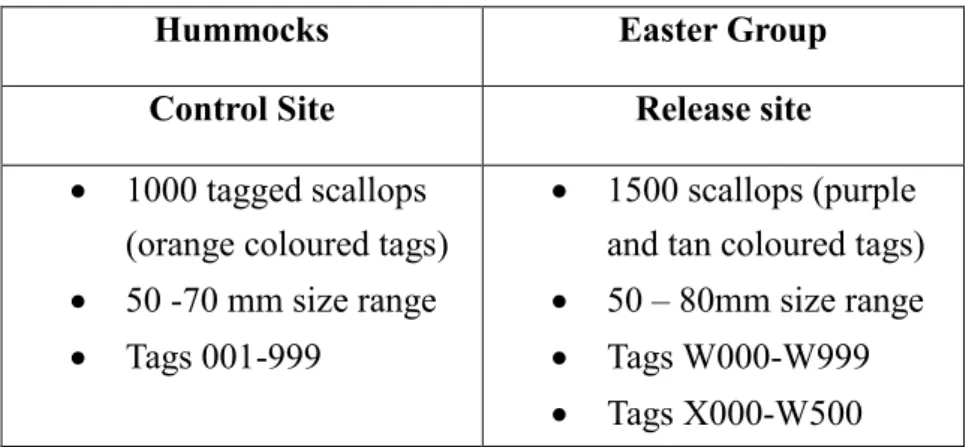
In addition, since only one study site in the Easter Group could be properly sampled (due to excessive algae clogging nets in other areas), the experiment was unable to test releases at different densities. Scallops for the "Control" experiment were collected at site 5 in the Hummocks region (Figure 16) and these scallops were held in a recirculating water tank, measured and labeled (with individually identifiable clamshell labels (Hallprint, FPN- tags) attached with cyanoacrylate glue) and released by jettisoning baskets of labeled scallops directly at the release site without extensive storage and transportation time. Commercial fishing resumed in May 2017 due to the moderate stock recovery, confirmed by an increase in scallop abundance in the December 2016 and March 2017 surveys.
Results
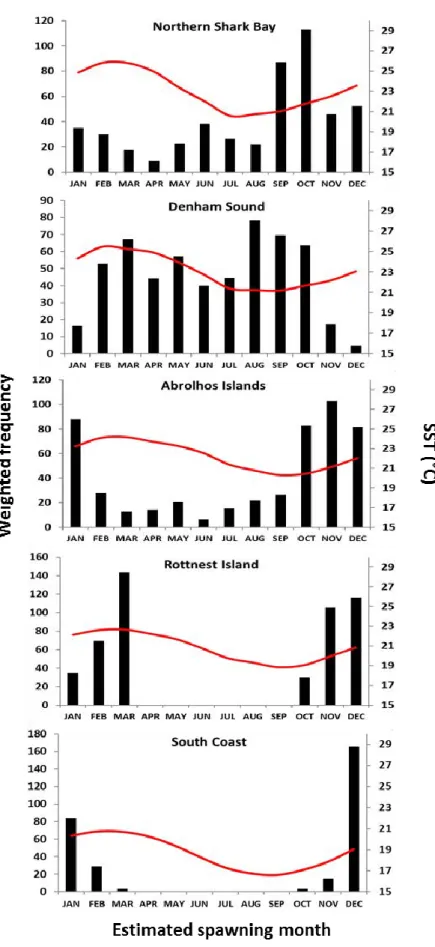
Spawning periods (ring counts)
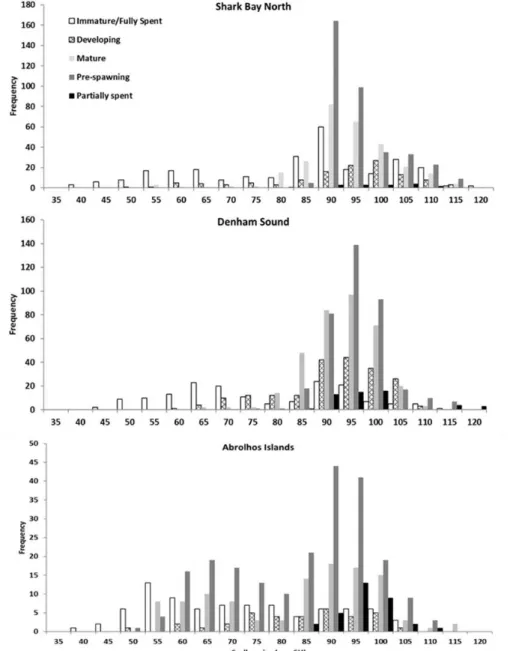
Gonad development
Variation in gonad development observed from available survey data sampled in 2016 and 2017 in (A) North Shark Bay (B) Denham Sound and (C) Abrolhos Islands.
Size Of Maturity (SOM) estimates
However, in AI, the majority of mature scallops were recorded from a size range of 55–60 mm SH. The smallest pre-spawn condition scallop in AI was 51 mm SH, while the smallest in NSB and DS were 74 and 81 mm SH, respectively. Both data sets indicated that scallops in AI matured at a smaller size to scallops from Shark Bay.
Frequency of shell height of scallops according to their different gonadal stages pooled for all months and years sampled in NSB, DS and AI. Logistic regression showing SOM estimates for Shark Bay and Abrolhos Island scallops with (C) and (D) assuming all SH above 70 mm mature.
Environmental drivers of recruitment
- South Coast
- Rottnest Island
- Abrolhos Islands
- Shark Bay
Relationship between log-transformed catch as a proxy for recruitment in year (y) with log-transformed catch in the previous year (y-1) as a proxy for spawning stock. This analysis excluded the 2012 to 2015 time series to remove the effects of very low spawning stocks that persisted after the 2011 MHW. Relationship between log-transformed recruitment CPUE (total CPUE) in November (y) with log-transformed CPUE of the spawning stock in November (y-1) in the previous year in AI.
These low stock years occurred when spawning stock levels were < 150 scallops/nm (log 5) and recruitment < 55 scallops/nm (log 4) and were associated with winter SSTs >. Therefore, with the exception of 2014 and 1990, spawning stock levels > 150 scallops/nm (log 5) generally produced higher recruitment and were associated with cooler winter SSTs. Relationship between log-transformed annual recruitment (0+) catch rate during November (year y) and mean (A) SST (Apr-Aug) (y) and (B) Southern components (Sep-Nov) (y-1) in Denham Sound.
NSB recruitment appears to be negatively related to previous summer temperatures, which would affect the condition of the spawning stock. Ratio of CPUE of log-transformed recruitment (0+) in November (y) to log-transformed CPUE of spawning stock in November (y-1) of the previous year in Northern Shark Bay.
Translocation pilot study
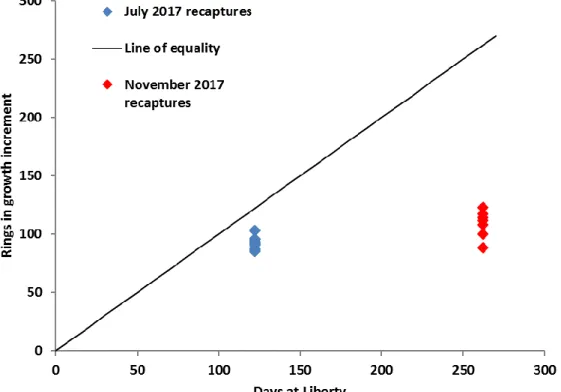
Number of rings in the growth increment of recaptured tagged scallops during July and November 2017.
Discussion
Recruitment dynamics of Y. balloti
- South Coast and Rottnest Island
- Abrolhos Islands
- Denham Sound and northern Shark Bay
- Feasibility of assisted recovery measures
- Climate change impacts on scallop productivity in WA
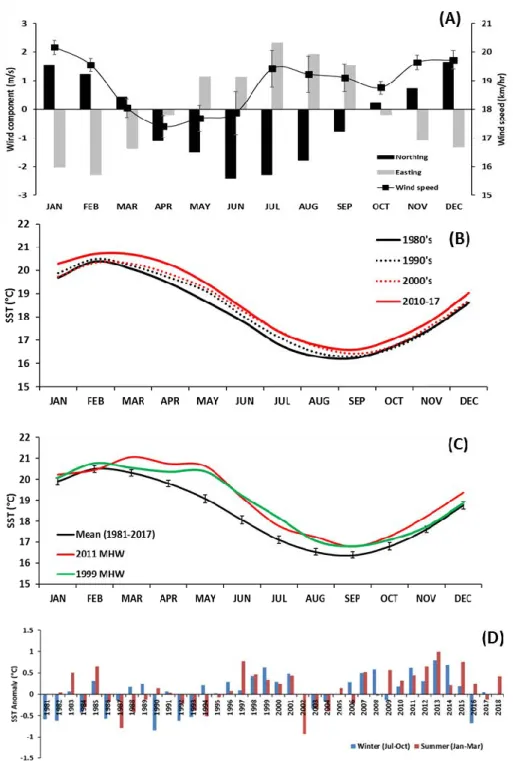
The spring/summer water temperatures at the AI currently vary from 20 – 24 °C and the area is protected from the peak strength of the LC which usually strengthens from March after the scallop drop has taken place. The circulation patterns in the AI are complex and are considered to be responsible for the triangular evolution of the Pelsaert and Paasgroep islands (Wells 1997). The strengthening of the LC during the winter spawning period has a twofold impact on the larval dynamics within SB.
In addition to raising water temperatures through the intrusion of the warmer LC, it also affects larval flushing dynamics depending on the larvae's position in the water column. The importance of summer water temperatures for recruitment was only identified for the NSB scallop population, where average summer water temperatures between December and January explained 25%. At SC, water temperatures show a warming trend in all months of the year.
Conclusions
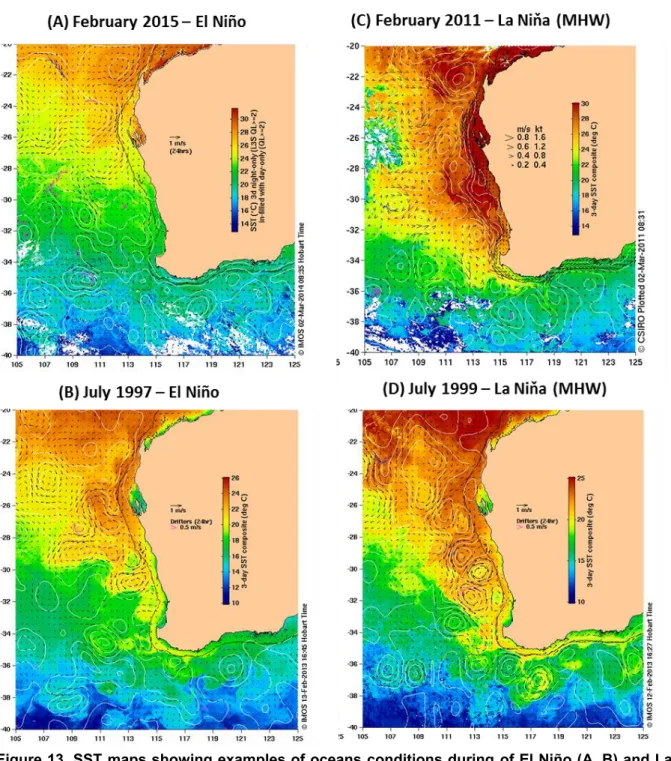
For the northern scallop stocks that were affected and recovered from failed harvests, the lessons learned after the 2011 MHW were valuable in the future management of these stocks. Warmer winter SSTs are associated with mild to moderate La Niña events, while strong La Niña events can lead to MHW conditions. The Bureau of Meteorology (BOM 2019b) provides an ENSO forecast which is now regularly reviewed before and during the WA scallop fishery.
Increased stock monitoring coupled with environmental monitoring is key to ensuring early management interventions are implemented to protect remaining spawning stocks. Monitoring of both stocks, commercial catch and effort (catch rates) and size (and quality) composition monitoring will continue to be important along with environmental monitoring to enable adaptive management of these stocks. Summary of key findings, relationships and stock status of the five scallop stocks in WA.
Implications
The WA coastline is a climate change hotspot (Hobday and Pecl. 2013) and therefore the trends documented in this report highlight the need to consider climate change in management, fishery harvest strategies and for reviewing the collection of long-term datasets ( both dependent on fisheries) and independent) in order to fully evaluate stock status and likely production trends in these fisheries. The project was able to identify several environmental factors that explain more than 50% of the variability in scallop recruitment, recognizing that the underlying mechanisms are not clearly known. The project outcomes highlight the need for protection of a component of the spawning stock in each fishing region with a clear correlation of the spawning stock size and environmental factors that contribute to the variability in scallop recruitment.
This information enables the development of limit reference points in the harvest strategies for these fisheries. This knowledge has management implications regarding considerations of what constitutes fishing grounds/region and 'individual fisheries' in the medium to longer term. Continued poor recovery of the Northern Shark Bay scallop stock highlights the need to assess changes to habitat, trophic dynamics, scallop nutrition and health status and the potential impact of cumulative trawling effort across scallop recruitment areas.
Recommendations
The project has clearly established that the environmental changes observed to date are not stable and continue to move or move up or down and behave differently between regions.
Further Development
Translocation experiments can be extended to provide further information on the transport and release of mortality, growth and survival. Improving survey techniques would require a comprehensive program dedicated to overcoming the many challenges noted in this project as well as those undertaken in the past. Investigating the non-environmental impacts associated with shark fishing and scallop discarding and contrasting fishery management strategies between DS and NSB to help understand variation in the recovery of scallop stocks in Shark Bay.
Extension and Adoption
Project materials developed
Appendix 1 Staff and Co-investigators
Appendix 2 Intellectual Property
Appendix 3 Scallop collections for ring counts
Appendix 4 References
Reproductive biology of the poll plate scallop Amusium japonicum balloti (Bernardi) in central Queensland waters. Dynamics and impact of the Leeuwin Current on the marine environment off Western Australia, Perth, Western Australia. Some aspects of growth, recruitment and reproduction in the southern pollack, Amusium balloti (Bernardi, 1861) in Shark Bay, Western Australia.
Environmental influences on recruitment in the Ballot scallop (Amusium balloti) fishery in Shark Bay, Western Australia. The continuing impact of the Leeuwin Current on economically important fish and invertebrates in the temperate zone of Western Australia – changed. Variability in the spatial and temporal distribution of the Ballot plate scallop, Amusium balloti, under management impacts of Shark Bay.