by
Mia Katina Tam
Submitted to the University of Adelaide in partial fulfilment of
the requirements for the degree of
Doctor of Philosophy in
Economics
April 2023
List of Tables iii
List of Figures iv
Abstract v
Declaration vii
Acknowledgements viii
1 Introduction 1
2 Infinitely repeated games 7
2.1 Introduction . . . 7
2.2 Theoretical background . . . 15
2.2.1 Stage game . . . 15
2.2.2 Pricing frequency and collusion . . . 18
2.3 Experimental design . . . 22
2.3.1 Hypothesis . . . 25
2.4 Results . . . 29
2.4.1 Average payoffs . . . 31
2.4.2 Dynamics . . . 35
2.5 Conclusion . . . 39
3 Continuous time 41 3.1 Introduction . . . 41
3.2 Model and implementation . . . 46
3.2.2 Parameters and Static Equilibrium. . . 48
3.3 Hypothesis and experimental design . . . 50
3.3.1 Experimental implementation and procedure . . . 52
3.4 Results . . . 55
3.5 Conclusion . . . 62
4 Behavioural mechanism 65 4.1 Introduction . . . 65
4.2 Experimental Design and Hypothesis . . . 67
4.3 Results . . . 70
4.4 Conclusion . . . 75
5 Conclusion 77 Appendices 80 A.1 Chapter 2 - Instructions . . . 81
A.2 Chapter 2 - Individual markets . . . 105
A.3 Chapter 3 - Instructions . . . 115
A.4 Chapters 3 and 4 - Control questions . . . 124
A.5 Chapter 4 - Instructions . . . 125
References 130
2.1 Treatments and summary of parameters. . . 23
2.2 Demographics across treatments . . . 29
2.3 Average price of independent observations. . . 30
2.4 Price proportions in each treatment. . . 31
2.5 Average supergame payoffs for independent observations. . . 31
2.6 Pairwise rank-sum tests of equality. . . 33
2.7 OLS regression on market supergame payoffs (clustering on matching group). . . 33
2.8 Pairwise test on equality of coefficients. . . 34
2.9 Hypothesis and rank-sum test on supergame payoffs between treat- ments. . . 34
2.10 Mann-Whitney rank-sum test, p-value for difference between treat- ments for each supergame . . . 38
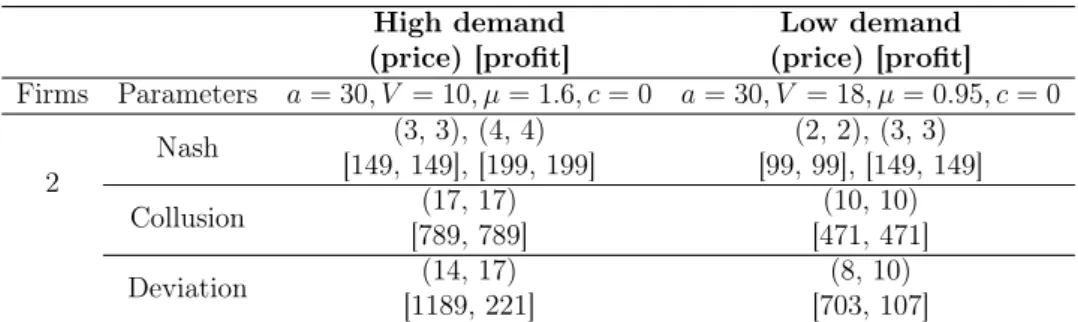
3.1 Parameters and Nash, joint-profit maximising, and best shot devia- tion prices and profits. . . 50
3.2 Demographics across treatments . . . 58
3.3 Average price of independent observations. . . 58
3.4 Summary statistics for moving average p¯−p. . . 60
4.1 Difference in deviation profit, and loss from signalling the JPM price instead of Nash, for each treatment. . . 68
4.2 Demographics across treatments . . . 70
4.3 Average price of independent observations. . . 71
4.4 Summary statistics for moving average p¯−p . . . 72
2.1 Possible equilibria with two firms. . . 21
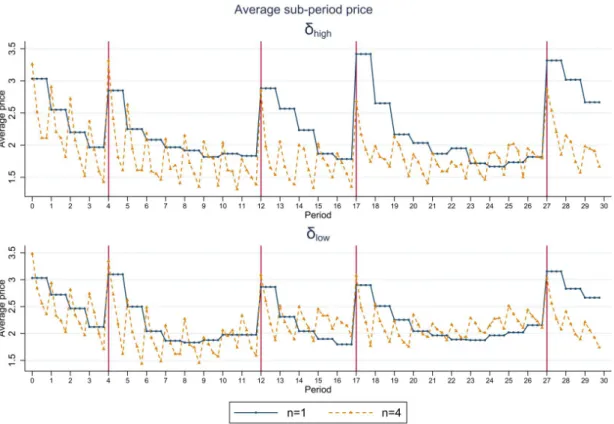
2.2 Average sub-period price in all 5 supergames inδh(top) andδl(bottom). 30 2.3 Distribution of the average payoff in each treatment for each supergame. 32 2.4 Real value of average payoffs. . . 36
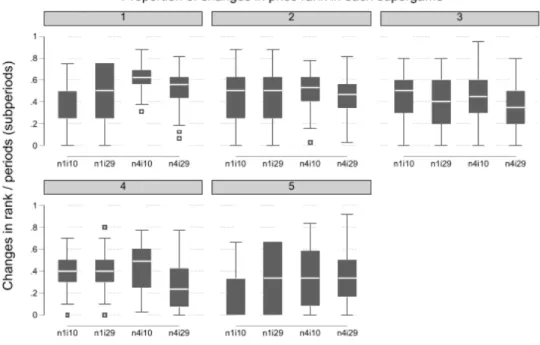
2.5 Frequency of change in price rank in each supergame, divided by the number of price change opportunities. . . 37
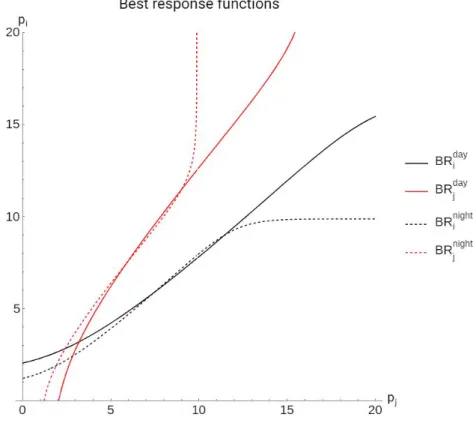
3.1 Best response functions for Day and Night demand levels, duopoly. . 49
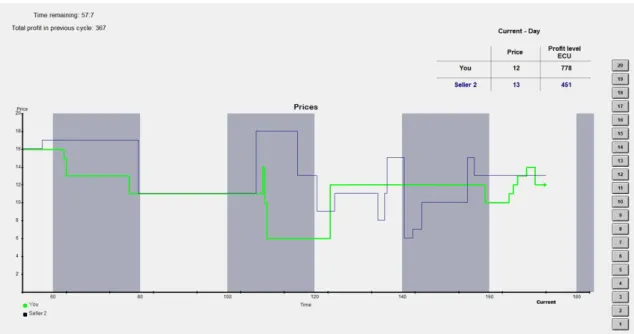
3.2 Example screenshot for the continuous treatment. . . 54
3.3 Average price over the experiment. Average price per second (top). Average period price, Day and Night (bottom). . . 56
3.4 Prices in each market. . . 57
3.5 Fraction of time (seconds) played by each group in each pricing category. 59 3.6 Fraction of markets within each category in each period. . . 61
3.7 Average period price for Unstable/Low markets. . . 62
4.1 Screenshot of Short-Discrete treatment screen shown to participants. 69 4.2 The top figure shows the average period price for each treatment (dashed lines), and separately for day and night in short-discrete (solid green lines). The bottom figure shows the difference in average period price between treatments. . . 71
4.3 Average market period price in each category. . . 72
4.4 Prices in each market. . . 73
4.5 Fraction of markets in each category over time. . . 74
4.6 Distribution of average period prices in markets that are Unstable/Low. 75 4.7 Average period price for markets that are Unstable/Low, over time. . 75
This thesis examines how pricing frequency impacts the ability of firms to tacitly collude. Online platforms have reduced search costs for consumers by making it easier to compare across firms. However, they also make it easier for firms to use prices as a communication tool and keep track of competitors. Various jurisdictions have implemented transparency schemes in the retail petrol market, with the aim of promoting competition between firms and enhancing consumer welfare. However, it is unclear whether the increased competition from lower consumer search costs outweighs a potentially enhanced environment for tacit collusion. A sub-set of juris- dictions have implemented additional restrictions on how and when petrol stations can change their price. It is unclear whether these pricing-frequency restrictions lead to enhanced competition and consumer welfare. This thesis uses laboratory experiments to investigate how pricing frequency impacts the level of tacit collusion in markets.
Chapter 2 examines whether pricing frequency impacts tacit collusion in the context of infinitely repeated games. We use four treatments to distinguish whether behaviour is driven by collusion incentives, adaptive pricing, and/or satisficing. On one dimension we vary whether there one or four pricing periods per stage game. On the other, we vary the induced discount factor (firm patience). Results show that increased pricing frequency leads to lower collusion levels. This is due to adaptive pricing, whereby firms continuously undercut one another, leading to a decay of cooperation over time.
minute, real-time duopoly experiment. Unlike the experiment in Chapter 2, where each period is distinct, we implement pricing-frequency restrictions in an otherwise real-time environment. We compare an unregulated market, with no restrictions on how and when firms can change their price, to one where prices are only updated simultaneously at set 20 second intervals. Results show collusion levels are signifi- cantly higher without pricing-frequency restrictions. This seemingly contradicts the finding from Chapter 2 where higher pricing frequency reduces collusion levels.
To test the mechanism behind our results, in Chapter 4 we implement a third treatment where prices are updated every 2.5 seconds. If collusion incentives such as the cost of signalling and gain from deviating drive results, then average prices in the 2.5 second treatment should be closer to our unrestricted treatment. If a behavioural mechanism is responsible, prices should be closer to the 20 second treat- ment. Results show collusion levels are virtually identical between the 2.5 and 20 second treatments. Thus, firms price adaptively, with pricing periods acting as a behavioural prompt to start a price war. This explains the seemingly contradic- tory results from Chapters 2 and 3, and the distinction between decisions made in discrete and continuous time becomes salient.
This thesis contributes to the experimental literature on cooperation in repeated games and continuous time. Results show that imposing discrete decision periods in an otherwise continuous-time environment reduces cooperation levels. Future experiments implementing repeated games should therefore consider the impact of timing as part of their design.
I certify that this work contains no material which has been accepted for the award of any other degree or diploma in my name, in any university or other tertiary institution and, to the best of my knowledge and belief, contains no material previously published or written by another person, except where due reference has been made in the text. In addition, I certify that no part of this work will, in the future, be used in a submission in my name, for any other degree or diploma in any university or other tertiary institution without the prior approval of the University of Adelaide and where applicable, any partner institution responsible for the joint-award of this degree.
I give permission for the digital version of my thesis to be made available on the web, via the University’s digital research repository, the Library Search and also through web search engines, unless permission has been granted by the University to restrict access for a period of time.
I acknowledge the support I have received for my research through the provision of an Australian Government Research Training Program Scholarship, and funding from the Australian Research Council (DP210103919).
I am deeply grateful for the exceptional mentorship, guidance, and encouragement provided by my supervisor, Ralph-C Bayer. Ralph is a wonderful role model, incred- ibly patient, generous, and always willing to share his vast knowledge and passion for economics – in his own research area and in economics more generally. I have learnt so much from him, and he never fails to light up the conversation with new insights during our discussions. I would also like to thank my co-supervisor Paul Pezanis-Christou for his support, encouragement, and assistance throughout the years. I feel very fortunate to have had Ralph and Paul’s guidance and company throughout the many challenges and discoveries I’ve encountered.
I am also appreciative of guidance and support from HDR coordinators Stephanie McWhinnie, Giulio Zanella, and Raul Barreto, who have fostered a lively research environment for research candidates at the School of Economics. I am particularly grateful to Stef for her support over the years. She played an instrumental role in helping me get the job that led to the realisation I wanted to do research, and this is something I will always be grateful for. As a role model she demonstrates integrity, intelligence, and perspective, and her guidance has been invaluable. I would also like to extend thanks and appreciation to the wider faculty and support staff at the School, who I have enjoyed interacting with and learning from.
I am grateful to David Byrne and Tom Wilkening for their suggestions and feedback on Chapters 3 and 4. Their guidance was invaluable and helped in pushing my thinking forward on how to refine and strengthen the applications of my research.
I extend thanks and gratitude to Kim and Rui, who have helped me immensely with moral support and as lab mates. I also thank the friends I’ve made in the PhD room who have provided much needed laughter, good company, and interesting insights from their research.
This thesis would not have been possible without the love and support from Michael, Beela, Oskar, and my parents. Although, I may have finished writing sooner had I not had paws all over my face every night. I am grateful to Aneta for her unwavering support and encouragement.
I dedicate this thesis to my Nana.
Introduction
Many markets have become increasingly transparent through the emergence of ac- curate and up-to-date online platforms. Examples of such markets include retail petrol, business hotels, and online retailers more generally. Transparency reduces search costs for consumers by making it easier to compare prices across sellers, but has a secondary effect of facilitating the monitoring of competitors’ prices. Compe- tition laws prevent explicit agreements to collude being made between firms, but do not prevent tacit communication through prices. The question arises as to whether increases in competition from reduced consumer search costs outweigh the potential increase in tacit collusion from the reduction in communication costs. Answering this question empirically is not straight forward. Concerns about tacit collusion in retail petrol (gasoline) markets have resulted in the implementation and enforce- ment of competition regulations in various jurisdictions around the world. These generally take the form of transparency programs and price setting restrictions, such as price ceilings, limitations on the frequency of price changes, or only allowing for price reductions (Haucap and Müller, 2012). How can these pricing restrictions help or hinder the ability of firms to tacitly collude in otherwise high-information environments?
The motivating policy behind this thesis is the retail petrol regulations in West-
ern Australia (WA). These regulations impose 24-hour price commitment on petrol stations, and stations are required to submit their price for the next day by 2pm.
The following day’s prices are then made publicly available from 2:30pm through the FuelWatch program.1 This price is then implemented at 6am the next day, and remains fixed for the next 24-hour period. It is unclear if pricing frequency regu- lations have actually led to welfare increases for motorists, due to the difficulty of controlling for multiple unobservables in these markets.
Our initial question can be restated to ask if simultaneous pricing-frequency re- strictions can reduce tacit collusion in markets. This thesis comprises three related essays that seek to experimentally examine if changes to allowable pricing frequency, whether through regulations or technology, impacts the ability of firms to tacitly collude. Can theory help us answer this question? The modelling of strategic com- petition in quantities and prices by Cournot (1838) and Bertrand (1883) paved the way for rigorous theoretical investigation of market characteristics and welfare out- comes (see Stigler (1964)). In particular, theoretical work on infinitely repeated games and associated folk theorems for identifying equilibria (i.e., Friedman (1971);
Fudenberg and Maskin (1986)) shed light on whether collusive equilibria in markets may be implementable. In complementary work, Maskin and Tirole (1988) provide the theoretical underpinning for the impact of price commitment in infinite discrete time duopolies, proving that Edgeworth cycles can be a Markov perfect equilibria.
Thus, under certain assumptions such as sufficient firm patience and timing of ac- tions, theory tells us that collusive outcomes are indeed implementable. However, it does not tell us how they are achieved, nor provide a sharp outcome on how collusive a market may be. The theory of infinitely repeated games is unable to answer our question.
The retail petrol market has received attention from empiricists, given the dif- ferent policies implemented by regulators and the availability of data on petrol
1The retail petrol market in WA is regulated under the Petroleum Products Pricing Act 1983 WA.
prices (Eckert, 2013). Byrne and de Roos (2019); Wang (2009) provide evidence of tacit collusion in the WA petrol market after the introduction of the 24-hour price commitment regulations. Despite evidence of tacit collusion, it remains unclear whether there is less collusion in WA with the 24-hour price commitment regula- tions. One might think of comparing prices in WA with those in New South Wales (NSW), which also has a pricing transparency program, FuelCheck, but no restric- tions on the frequency of allowable price changes.2 Any price differential for retail petrol in WA and NSW cannot be entirely attributed to the difference in regulatory environment. The complexities of markets are vast, including differing consumer preferences, services provided, capacity constraints and brand-group pricing issues.
Comparing prices, even with the inclusion of controls, does not adequately solve the identification problem.
Dewenter et al. (2017) and Becker et al. (2021) have made progress towards identifying the causal impact of pricing regulations in the Austrian retail petrol market using difference-in-difference and synthetic control methods, respectively.
Both studies find a pro-competitive effect of the Austrian rule, which allows for one price increase per day and unlimited decreases. Dewenter et al. (2017) do not find any significant effect of the WA regulations on fuel price levels. More evidence is needed, as both studies formulate their controls using prices from other countries, where the underlying data generating process may be different.
Laboratory experiments are well placed to cleanly test the impact of pricing frequency regulations on tacit collusion. This thesis experimentally investigates the impact of price setting rules that restrict interaction frequency on cooperation in Bertrand oligopolies. All experiments were conducted with approval from the Human Research Ethics Committee at the University of Adelaide (H-2019-179).
In Chapter 2 we investigate how price commitment impacts cooperation in the context of an infinitely repeated game. We bridge the gap between traditional
2The NSW industry is regulated under the Fair Trading Act 1987 No 68 NSW.
experiments on infinitely repeated games and the more recent development of ex- periments investigating how behavioural factors impact cooperation levels. In our theory-driven null hypothesis, we test whether increasing the attractiveness of col- lusion, as measured through collusion incentives,3 impacts the level of collusion in markets. Our first alternative hypothesis is derived from the observed decay in co- operation levels in experiments using a repeated prisoner’s dilemma (Chaudhuri, 2011). Alternative hypothesis 1 states that average levels of collusion will decrease as the number of price changes increases. The second alternative hypothesis states that as discount factors decrease, the level of collusion increases. This is contrary to standard repeated-game logic on the impact of discount factors, as tested in our null hypothesis. Instead, alternative hypothesis 2 tests whether collusion is driven by satisficing behaviour (Simon, 1956). Participants target a real payoff level and thus compensate for the lower discount factor by increasing nominal prices and prof- its. The third alternative hypothesis is that both the number of price changes, and the discount factor, impact observed collusion levels.
Four treatments are used, varying the number of price changes per period to be one or 4, and the induced discount factor.4 Using theory and observations of behaviour in experiments, we derive a null and three alternative hypotheses. We run five supergames in each session for our aggregative triopolies. Results support alternative hypothesis 1, and collusion levels are significantly higher in treatments with one price change compared to treatments with 4 price changes per stage game.
We do not find evidence to support our null hypothesis or alternative hypothesis 2. Thus we conclude that restricting the number of price changes results in higher levels of collusion. Adaptive pricing, where firms undercut one another, takes longer to achieve with fewer available price changes.
3We derive collusion incentives from the theory of infinitely repeated games. Based on our parameters we calculate the value of colluding at the joint profit maximising price, minus the value of one-shot deviation with Nash profits forever (grim trigger). As this difference decreases, we expect lower levels of collusion, as it becomes less attractive.
4We use a combination of a continuation probability and inflation rate. For our purposes, using a continuation probability only would not allow us to achieve the reduce the induced discount factor low enough for our purposes without severely restricting the length of supergames.
In Chapter 3, we test the impact of restricting pricing frequency in a 60 minute (90 period), continuous-time duopoly. Following the findings in Chapter 2, we are interested in how collusion dynamics evolve over time, without being restricted by the stopping probability or inflation rate required to implement an infinitely repeated game in the lab. Profits are gained in a flow over time, which more closely follows the flow of consumers stopping for petrol over each day. Another key difference with our experiment in Chapter 2 is that we remove the break between periods to ensure that any restart effects, or chosen focal points for coordination, are due to differences between treatments, and not due to the experimental design. Each cycle (or period) runs for 40 seconds, with a repeating pattern of 20 second days and 20 second nights. These shocks implement high and low demand levels at known intervals at the same time for all participants. Firms need to actively change prices to adapt to each demand level, ensuring participants are active in pricing for the entire 60 minute experiment.
We compare a treatment where firms are unrestricted in the number of price changes, to a second treatment that implements 20 second pricing periods for an otherwise real-time market. Our null hypothesis states that price levels are equal in both treatments. The alternative hypothesis depends on the inequality between treatments. If prices are lower in the unrestricted treatment, the introduction of discrete pricing periods every 20 seconds makes it easier for firms to collude (i.e., introduces a clear focal point and makes it easier to keep track of prices). If prices are lower in the 20 second treatment, higher cost of initiation and gain from deviating result in lower levels of collusion. Results show a clear treatment difference, with higher prices in the unrestricted treatment. This is seemingly contrary to the results in Chapter 2, where more available price changes led to lower levels of collusion.
In Chapter 4, we test for the mechanism driving the results in Chapter 3 by using an additional treatment with 2.5 second pricing periods. If prices in this treatment are closer to the unrestricted treatment in Chapter 3, then we confirm that collusion incentives lead to higher prices. This is because the cost of signalling
(initiation) and gain from deviating (incentive to cheat) are lower in the unrestricted treatment. Thus, by reducing the simultaneous price commitment period from 20 seconds down to 2.5 seconds, these collusion incentives are closer to those in the unrestricted treatment. However, a behavioural explanation could be responsible for the difference, thus the 2.5 second length is chosen to ensure the decision period is still discretised.
Prices in the 2.5 second treatment are similar to those in the 20 second treatment.
Results show a higher proportion of fully collusive markets, and higher prices more generally, in the unrestricted treatment. Thus, we conclude that collusion incentives are not behind the higher prices in our unrestricted treatment, and instead it is the introduction of discrete pricing periods in an otherwise continuous time market. We hypothesis this is driven by a status quo effect (Samuelson and Zeckhauser, 1988) in the unrestricted treatment, whereas the introduction of structure into the market through a 20 or 2.5 second pricing period acts as a prompt for firms to re-strategise.
This has a pro-competitive effect on markets.
The final chapter concludes by summarising the findings from this thesis in con- text of the literature and future research directions.
Infinitely repeated games
2.1 Introduction
“The best known results in the theory of repeated games, the folk theorems, focus attention on the multiplicity of equilibria in such games, a source of consternation for some. We consider multiple equilibria a virtue - how else can one hope to explain the richness of behavior that we observe around us?” - Mailath and Samuelson (2006)
The development of repeated game theory opened the door to the analysis of how time impacts the nature and outcome of strategic interaction. The classical prisoner’s dilemma is one such example, where repeated interaction can lead to the possibility of a cooperative outcome being reached when it would otherwise be unattainable as a sub-game perfect equilibrium. Various Folk Theorems for infinitely repeated games show how punishment strategies can be used to support cooperative outcomes, providing a theoretical explanation for why cooperative outcomes are of- ten observed in society (Friedman, 1971; Fudenberg and Maskin, 1986). For many real-world situations, achieving a cooperative outcome improves the overall welfare of society, e.g., action on climate change, students working on a group assignment, and attempts by nations to promote regional stability. However, there are circum- stances in which the welfare implications of cooperation are negative from the policy maker’s point of view. Cooperation between firms in oligopoly markets can lead to
diminished consumer welfare. This chapter is concerned with how the latter is im- pacted by the frequency of interaction within a stage game. We focus on games of complete information to reflect real world markets where prices are readily avail- able online. This allows us to focus on identifying the causal impact of interaction frequency, without confounds that may result from imperfect monitoring.
Friedman (1971) and Fudenberg and Maskin (1986) show that for a supergame, or an infinitely repeated stage game, all individually rational stage-game payoffs that are feasible can be implemented as an average period payoff - as long as players are sufficiently patient. Patience is measured against the threshold critical discount factor, which in turn is determined using the payoffs of the game and strategies used by players. Thus, there are infinitely many potential sub-game perfect equilibria that are Pareto dominant compared to playing Nash at every stage.1 With a large set of potential equilibria in a supergame, including Nash, it is unclear on which equilibrium players will eventually land. If cooperation is indeed sustainable in equilibrium, identifying which is more likely to occur is not straight forward.
This theoretical gap creates challenges for applications where more refined predic- tions are required. Although, as Mailath and Samuelson (2006) state, multiplicity of equilibria provides an explanation for varied behaviour, it can also hinder analysis of policy. Theory does not predict which equilibrium will actually be played under dif- ferent policy regimes. For instance, in situations where cooperation leads to concern over anti-competitive conduct in markets, policymakers are without theoretical guid- ance on how potential market regulations may affect equilibrium selection. Potential solutions to this coordination problem have been proposed, such as the identifica- tion of focal points (Schelling, 1960), measures of strategic uncertainty (Heinemann et al., 2009), and payoff and risk dominance (Harsanyi, 1995; Harsanyi and Selton, 1988). Unfortunately these approaches do not make predictions on how interaction frequency impacts the overall level of cooperation in markets. A secondary concern
1This requires that there are feasible stage game payoffs that pareto-dominate stage-game Nash.
arises as to whether there are behavioural factors that impact cooperation levels, which theory is currently unable to capture.
The lack of predictive power of theory, and the potential impact of behavioural factors, has led to experimental work on cooperation in infinitely repeated games.
Infinitely repeated games can be implemented in laboratory experiments by incor- porating a probability that the game ends each period (stopping probability) and an inflation rate. Dal Bó and Fréchette (2018) provide an extensive meta analysis of how characteristics of repeated games impact the overall level of cooperation.
The main vehicle to study infinitely repeated games and cooperation has been the prisoner’s dilemma. Dal Bó and Fréchette (2018) use a meta analysis of experiments using an infinitely repeated prisoner’s dilemma to show how cooperation levels are impacted by variables including the critical discount factor, game length and ex- perience, matching protocol, and public monitoring. However, it is not clear that repeated-game logic is the only explanation for observed results on differences in cooperation levels. The strategy space in a prisoner’s dilemma is not rich enough to conclusively prove the existence of repeated game play according to theory, and separate this from potential behavioural factors such as social preferences, reasoning ability, and the building of reputations. Any defection from observed cooperation is indistinguishable from the implementation of a punishment strategy. Thus it is un- clear whether punishment, or another behavioural influence, is behind the observed change in cooperation.
A relatively new strand of literature has made progress in this area by showing differences in decisions made in discrete compared to continuous time. In the context of a 60 second continuous prisoner’s dilemma, Friedman and Oprea (2012) find that continuous time helps stabilise cooperation, as do Bigoni et al. (2015). Leng et al.
(2018) find that games in continuous time are behaviourally different to those in discrete time, in the context of a minimum effort coordination game.
Our contribution seeks to bridge the gap between the experimental literature on
infinitely repeated games and the literature on the timing of decisions and coop- eration. We identify potential behavioural explanations for observed differences in cooperation levels, while embedding the decision environment within the context of an infinitely repeated game. This allows us to disentangle the impact of collusion incentives, driven by repeated-game logic, from potential behavioural factors. The context of Bertrand competition allows us to explore these impacts over a wider strategy space than if we used a 2 by 2 game. We focus on simultaneous pric- ing decisions in markets with complete information, capturing the essence of the retail petrol market regulations in WA. The classical Bertrand model of oligopoly (Bertrand, 1883) is appropriate to proxy the general retail petrol market, where firms sell otherwise homogeneous products that are differentiated by location and services provided. Although a Hotelling location model (Hotelling, 1929) could also capture these characteristics, we are more interested in the choice of price, and impact on price dynamics over time.
To understand how pricing frequency regulations impact collusion levels, we need to identify how they impact the stage game in an infinitely repeated sequence. Pric- ing frequency impacts the potential payoffs to players by dividing each period payoff by the number of sub-periods (or pricing periods). This necessarily impacts the pay- offs used to calculate the critical discount factor. For example, with more pricing periods in a stage game, the payoff from deviating is lower as other firms can punish sooner, resulting in a lower critical discount factor. In other words, the threshold level of patience for cooperation to be sustained in equilibrium is reduced. We again run into the same problem, that in environments where collusion is sustainable, it is unclear how pricing frequency might impact overall collusion levels. Although theory tells us how pricing frequency impacts the critical discount factor, above this threshold it is unclear whether there is any effect. This further demonstrates why empirical investigation of potential behavioural factors is necessary. Regarding equilibrium selection, our contribution is on the question of how regulations impact
average collusion levels, rather than understanding how collusion is initiated.2 The level of control in laboratory experiments makes them an appropriate tool to help us understand how cooperation is impacted by different characteristics of repeated games (Abbink and Brandts, 2008). Within the experimental literature, multiple determinants of cooperation have been explored in the context of repeated games, and industrial organisation more generally (Bigoni et al., 2015; Friedman and Oprea, 2012; Dal Bó and Fréchette, 2011; Leng et al., 2018). Factors impacting cooperation levels include:
1. The number of firms in the market. As the number of firms in experimen- tal markets increases above two, collusion levels decrease (Huck et al., 2004;
Dufwenberg and Gneezy, 2000; Abbink and Brandts, 2008);
2. Use of a stochastic vs deterministic ending rule. Bigoni et al. (2015) find more cooperation with deterministic ending rules, rather than stochastic ones;
3. The sustainability of collusion as an equilibrium outcome for infinitely repeated games. Being supported in equilibrium is not a sufficient condition for coop- erative outcomes to arise (Dal Bó and Fréchette, 2011; Dal Bó and Fréchette, 2018);
4. Strategic complements vs strategic substitutes. More cooperation is observed when strategies are complementary (i.e., price competition) compared to when they are substitutes (i.e., quantity competition) (Potters and Suetens, 2009;
Anderson et al., 2010);
5. Information and experience. The availability, or lack thereof, of payoff in- formation and ability of participants to learn can support cooperation in the long run (Huck et al., 2017; Friedman et al., 2015). Cooperation increases with experience (Dal Bó and Fréchette, 2011), as with explicit communication (Fonseca and Normann, 2012);
2Using the terminology of Green et al. (2014), we are able to provide insight on the implemen- tation stage related to equilibrium selection, but not the initiation stage.
6. Alternate vs simultaneous move games (Leufkens and Peeters, 2011).
Thus, the literature has explored multiple determinants of cooperation in re- peated games. However, the impact of pricing frequency has not been addressed.
Our experiments do not seek to replicate these findings, rather complement them by providing evidence on how a potentially crucial element impacts cooperation.
The experiments of (Leufkens and Peeters, 2011) are the closest to achieving this by examining short-run price commitment, however the focus is whether strategic uncertainty resulting from a simultaneous move game leads to more collusion than an alternate move structure. In addition, more work is required in the industrial organisation context of repeated games to understand the impact of decision timing, or frequency.
We experimentally test the impact of pricing frequency on collusion levels in the context of an infinitely repeated game. Referencing the characteristics from the literature, we implement a market with three firms simultaneously setting prices (strategic complements),and a stochastic ending rule. Our design is novel as we incorporate flow profits into the stage game. We use four treatments to differentiate between the impact of general collusion incentives (derived through the repeated game itself), and the potential behavioural impact of higher pricing frequency. Our experimental market comprises a symmetric aggregative triopoly, where firms com- pete in prices selling differentiated products. The choice of prices by firms are strategic complements, and thus prices up to the monopoly price lead to higher profits compared to Nash.
Our experiments are not designed to strictly test theory. Theoretically where collusion is not sustainable in equilibrium, the Nash outcome is expected. If collusion is sustainable, an average price above Nash, and the Nash outcome, is feasible.
Thus, finding no difference between treatments is a valid theoretically. Instead we formulate a null hypothesis which states that collusion increases with classic collusion incentives. This refers to the difference in colluding forever, and defecting and being
punished indefinitely under a grim trigger strategy. Even if collusion is a feasible equilibrium action in two treatments, where the incentives are higher we may expect higher levels of collusion.
Our first alternative hypothesis is that more price changes per periods leads to lower levels of collusion. The intuition behind this hypothesis is from the observed decay in contributions over time in repeated public goods games, with repetition leading to lower levels of cooperation (Chaudhuri, 2011). This observation is in the spirit of Maskin and Tirole (1988) Edgeworth price cycles, which are commonly observed in retail petrol markets. If participants are pricing adaptively, cooperation levels will decrease with each new decision. This would appear as a price cycle in an industrial organisation context, with a restart effect at the start of the game.
If participants are pricing adaptively, then the rigidity imposed in the marketplace slows the pace of price wars, leading to higher average prices under lower pricing frequency. Fewer available price changes may stifle competition and lead to higher prices on average. Thus, a longer period of time will be required to achieve the same number of price reductions.
An alternative behavioural hypothesis is that pricing frequency does not impact collusion levels, but that discount factors do in a non-standard way. Standard theory would suggest that lower discount factors would reduce cooperation rates.3 If instead participants aim for a target level of real profit, then over time to compensate for a lower discount factor, prices and therefore nominal profits will rise. Such behaviour could otherwise be described as satisficing (Simon, 1956), and has been identified as a factor driving collusive outcomes in markets (Dixon, 2000). Differences in collusion would then be observed between discount factors, but not across pricing frequencies.
Finally, it could be that both of these behaviours impact collusion. This would lead to a distinct ranking of collusion levels for our four treatments.
3Compared to a critical discount factor, if the agent’s patience level is below this, then collusion is not sustainable. Standard collusion incentives would suggest that the more patient the agent is, the higher the incentive to maintain cooperation.
On one dimension we vary the number of allowable price changes per period, to be either one or four. On the other, we vary the induced discount factor (patience level) using a continuation probability and inflation rate. The use of an inflation rate on top of the continuation probability is necessary to achieve discount factors low enough for our purpose, without making supergames too short. To test the impact of pricing frequency on cooperation we need to hold the incentives derived from repeated games constant, in case these incentives do play a role in determining cooperation levels. To achieve this we select one of the inflation rates such that the difference in continuation payoff from colluding and deviating is equalised between a treatment with 1 price change per period, and another with 4. The average supergame payoff is used as a measure of collusiveness as it allows us to easily compare across treatments with different discount factors.4
We find no evidence to support our null hypothesis that higher collusion in- centives lead to higher levels of collusion. Results support our first alternative hypothesis - with more price changes per period collusion levels are lower due to within-period competition. Lower discount factors leading to higher collusion levels due to satisficing behaviour is not supported by the data. We are able to show, in the context of an infinitely repeated game, that higher action frequency impacts cooperation levels by promoting adaptive pricing.
The remainder of the chapter is structured as follows. First, we outline our market in the context of the stage game. We then show how pricing frequency within a stage game impacts the critical discount factor, and the theoretical uncertainty in how pricing frequency impacts tacit collusion. Second, we outline our experimental design, implementation and hypothesis. Third, we present results. Finally, we conclude.
4This is not the standard calculation of the average. The average period payoff is calculated as the stage game payoff that would yield the same supergame payoff derived from the realised payoffs of the supergame. As we don’t have an actual infinite sequence, we only use realised payoffs to make this calculation. The calculation is explained in more detail later in this chapter.
2.2 Theoretical background
We are interested in how the number of allowable price changes in a market impacts average prices. In other words, how does the frequency of interaction impact the ability of firms to coordinate in an infinitely repeated game? repeated-game logic sheds light on what conditions are necessary for collusion to be a theoretical pos- sibility. However, this does not guarantee that players will successfully coordinate, nor on which strategy (price).
First we outline our stage game model. We then extend this to an infinitely repeated game to examine how pricing frequency per period impacts the ability of firms to coordinate. Finally, we explain how this leads to the theoretical uncertainty that underpins our empirical investigation.
2.2.1 Stage game
In this section we describe our general model and the characteristics of our market.
With experimental implementation in mind, our model seeks to simplify the game, while working within the constraints of implementation.5 We start with a simul- taneous move, symmetric Bertrand oligopoly with N firms I = {1,2, ..., N} selling differentiated goods. There is a discrete and finite strategy space, so firms are able to set prices at integerspi ∈ {1,2, ..., pmax} ∀ i∈I. Firms are given a payoff matrix which was designed around the implementation constraints. This was initially based on the standard linear differentiated Bertrand model. Payoffs are chosen to satisfy the properties usually assumed for symmetric differentiated Bertrand oligopolies, as follows.
5Constraints included the implementation of the discount factor (discussed further below), including a reasonable continuation probability, and avoiding extreme expected payment differences between treatments.
Symmetry
Profit for each firm depends on their own pricepi, and the other firms’ pricesp−i, and can be written asπi(pi, p−i). To simplify the model for experimental implementation, we assume that a firm’s profit only depends on their own price, and the average of other firms’ in the market. Profits are symmetric, such that:
πi(pi, p−i) = πj(pj, p−j) if pi =pj; p−i =p−j (2.1)
Existence of best responses
Given the discrete strategy space, this implies that a best response always exists such that:
∃ p∗i(p−i) = arg max
pi
πi(pi, p−i) ∀ p−i, i, −i (2.2)
Aggregative
In a market with more than two firms, characterising the oligopoly game in two dimensions simplifies the game significantly, which is particularly important for the purpose of experimental implementation in the lab. Thus, we characterise the game as aggregative, such that each firm’s profit function depends only on own price pi, and the aggregate price of other firms in the market. Our aggregator function takes the average of other firm prices in the market, denotedp¯, and assume a unique Nash equilibrium.6 We state this as follows:
πi(pi, p−i) = πi(pi, p′−i) if X
k̸=i
pk =X
k̸=i
p′k (2.3)
6The theoretical literature on aggregative games provides analysis well beyond our present use, including existence of equilibrium and welfare analysis in asymmetric oligopolies (Anderson et al., 2020; Jensen, 2010; Alós-Ferrer and Ania, 2005; Corchón, 1994; Caplin and Nalebuff, 1991).
In other words, firm i’s profit, for a given price, is the same for price vectors of the other firms in the market that yield the same average price. Therefore the firm’s profit function can be written as a function of own price, and the aggregate (average) of the other firms in the market:
πi(pi, p−i)⇒π(pi,p¯−i) (2.4)
Strategic complements
The products being sold by firms are imperfect substitutes, such that the cross- price elasticity of demand between them is positive. For a givenpi, if p¯−i increases, the quantity demanded for firm i increases too. With respect to the retail petrol market, this captures the differentiation between petrol stations due to location and/or customer loyalty programs, for products which are otherwise identical. The final important characteristic of our market is that firms’ strategies are strategic complements, such that the best response is weakly increasing in response to an increase in p¯−i:
p∗i(¯p−i)≥p∗i(¯p′−i) if p¯−i >p¯′−i (2.5) We can now define the stage game prices and profits. The unique and symmetric Nash equilibrium pricepN =p∗i(¯pN−i) leads to Nash profits:
πN :=π(pN, pN) (2.6)
The joint profit maximising price, pC, is the price that satisfies the following:
pC = arg max
p
N
X
i=1
πi(p, p) (2.7)
Thus, the fully collusive profits of each firm are:
πC :=π(pC, pC) (2.8)
Finally, the deviation profit from the stage game occurs with price:
pD = arg max
p
πi(p, pC) (2.9)
Deviation profits are therefore:
πD :=π(pD, pC) (2.10)
From our assumptions it follows that:
pN < pD < pC (2.11)
and
πD > πC > πN (2.12)
The above describes the general characteristics of our stage game. The follow- ing section extends this to an infinitely repeated game, showing the impact of the frequency of price changes.
2.2.2 Pricing frequency and collusion
By extending the stage game to an infinitely repeated game, or supergame, we can examine how the frequency of price changes impacts the ability for firms to co-
ordinate. The theoretical literature on infinitely repeated games is vast, but our research question is concerned with the implications of one particular folk theorem for equilibrium in infinitely repeated games, as articulated by Fudenberg and Maskin (1986) and Friedman (1971). To briefly summarise, this folk theorem tells us that as long as firms are sufficiently patient, it is possible for payoffs (averaged across the supergame) that Pareto dominate the stage game Nash equilibrium to be imple- mented as a subgame perfect Nash equilibrium (SPNE) of the supergame. What is considered sufficiently patient can be determined through the critical discount factor δ¯.
The stage game is now referred to as a period, and within-stage game price changes are referred to as sub-periods. To introduce time, we allow n price changes per stage game (number of sub-periods), discount factor (inflation)r, and continua- tion probability ρ. The choice to include both a discount factor and a continuation probability was made to facilitate experimental implementation. Firm i’s discount factor δi can be stated as:
δi =ρ(1−r) ∀ j (2.13)
Grim trigger, reverting to playing Nash forever if anyone deviates from the collu- sive agreement, is the most extreme trigger/punishment strategy. Grim trigger may support the collusive outcome if firms are patient enough. Less extreme strategies, for example where punishment only lasts as long as necessary to eliminate deviation profits, are also possible. However, grim trigger gives us the upper threshold of required firm patience in the supergame, thus we focus on this.
We can determine the threshold patience level that allows for the collusive out- come. A firm will not deviate if the present value of profit from cooperating is greater than the profit from deviating today, plus the present value of Nash profits forever. This can be written as:
πC
1−δi ≥πD + δiπN
1−δi (2.14)
In each period, if a firm deviates from the collusive agreement, the grim trigger strategy would require firms to respond by playing pN forever. Considering the impact of the frequency of price changes, it can be observed that for n > 1, if a competitor deviates from the collusive agreement, the punishment will take effect in the subsequent sub-period. Therefore, a firm that wishes to deviate will still want to maximise its period profit, and play the collusive price for n −1 sub-periods, then deviate in the last sub-period. The period profit from this deviation strategy is defined as:
πD = (n−1)πC +πD
n (2.15)
Knowing this, we can then determine the threshold firm patience,δ¯n in order for collusion under grim trigger strategy to be sustainable. It is defined as below:
δ¯n= πD − (1+r)πC πD − (1+r)πN
(2.16)
Notice that as n increases, πD decreases, therefore δ¯n decreases.7 It is theoret- ically more conducive to collusion (required firm patience lower) as the frequency of price changes increases. The sub-period payoff from deviating decreases as n in- creases. The present value of cooperating, ΠC for a given level of firm patience δi
for the entire supergame can be written as:
ΠC = πC
(1−δi) (2.17)
7Differentiating (2.16) with respect to nrecalling theπD depends onnand that∂πD/∂n <0 immediately reveals this.
πi πj
πN
πC
Figure 2.1: Possible equilibria with two firms.
Similarly, the present value of deviating today, plus the discounted value of Nash profits for each subsequent period is:
ΠD =πD + δiπN
(1−δi) (2.18)
Thus, firms will cooperate so long as ΠC ≥ΠD.
A folk theorem tells us that any individually rational equilibrium is imple- mentable as a SPNE (Fudenberg and Maskin, 1986). For the two firm example, all possible equilibria are shown in the shaded portion of Figure 2.1. In other words, any present value of payoffs, πi and πj is a potential SPNE of the supergame. It is possible for the threat of grim trigger to support the collusive outcome if firms are sufficiently patient, such that the firm’s discount factor greater than the critical discount factor δi ≥ ¯δ. This leads to our empirical question of how interaction fre- quency impacts the ability of firms to coordinate on these equilibrium. The nature of firm interaction in our model, strategies being symmetric strategic complements, means that symmetric profits, starting from Nash profits, are a Pareto improvement on the last. Thus firms have an incentive to coordinate on prices as close to the joint-profit maximising price as they can.
2.3 Experimental design
In this section we explain experimental design. First we outline the intuition behind the experimental design, and then we detail the parameters and implementation.
We implement a triopoly (three firms) to balance the overall competitiveness of an experimental market, yet still capture the nature of the real-world markets where pricing frequency regulations have been implemented (more than two firms compet- ing).
We conduct four treatments, varying induced firm patience δr (above or below the threshold δ¯n) and the number of allowable price changes per period (n). This allows us to isolate the impact of allowable pricing frequency on average price.
For a given n, varying whether collusion is sustainable or not will allow us to identify a baseline average price level and behaviour of firms. Our baseline treat- ment sets n = 1, with induced firm patience below δ¯1, such that collusion is not sustainable. We label this low firm patience treatment n1δl, which, as explained below, is implemented using a high inflation rate.
In the remaining three treatments we induce firm patience above δ¯n so that collusion is sustainable in each supergame. This allows us to distinguish between differences in the incentive to deviate, and the number of price changes, between treatments. Our second treatment, n1δh, holds n constant and induces firm pa- tience above the threshold required to sustain collusion by lowering the inflation rate. We set n=4 for our third treatment n4δh. Increasing n by necessity decreases the continuation payoff from deviating. This means that for a given level of firm patience, changingn will result in two differences between treatments - the number of allowable price changes; and the payoff from deviating. We therefore run our fourth treatment, n4δl, where induced firm patience is selected such that the con- tinuation payoff from deviating is the same as inn1δh. This will allow us to identify the impact of altering the number of price changes from one to four.
Table 2.1: Treatments and summary of parameters.
n = 1 n= 4
Inflation rate (¯δ1 = 0.63) (¯δ4 = 0.30) δh = 0.72 0.1 n1δh∗ n4δ∗h δl = 0.56 0.29 n1δl n4δ∗l
p∈[1,7] pN = 2, pC = 6
Continuation probability = 0.8;
*Collusion sustainable in equilibrium.
As above, increasing the number of price changes decreases the required firm patience, δ¯ for grim trigger to sustain collusion. We vary whether grim trigger is able to theoretically sustain collusion. This is achieved using a combination of a continuation probability and inflation rate (implementing the discount factor) that is varied to induced firm patience. The continuation probability for all treatments is 0.8. In other words, the probability that the game will end after each period is 20%. We vary the induced firm patience δi by altering the inflation rate which reduces the value of profits earned in future periods. Using an inflation rate of 10%, induced firm patience under the low inflation treatment isδh = 0.72. The high rate of inflation is selected to make the payoff from deviating when n = 4 equal to the continuation payoff from deviating in n = 1 with low inflation.8 Thus we get an inflation rate of 29% and δl = 0.56. The four treatments are summarised in Table 2.1.
The experiment was conducted at the Adelaide Laboratory for Economics Ex- periments using z-Tree (Fischbacher, 2007) in 2020 and 2021. Participants were recruited using ORSEE (Greiner, 2015) and were mainly students (undergraduate and postgraduate) of the University of Adelaide. For each treatment we ran four sessions with between 12 and 18 participants in each. Overall, 279 participants par- ticipated in our experiment. Once the instructions were handed out to participants,
8The payoff from deviating is calculated as the difference between the present value of cooper- ating, minus the present value of deviating (assuming grim trigger is implemented). Thus, given the low inflation rate chosen, we can select a high rate such that the difference is the same for both treatments, despite changingn. For our parameterisation, the present value of cooperating is 153.6 ECU for n1, while the deviating yields 144.9 ECU (difference = 8.71). Thus, we select the inflation rate that yields the same difference in payoffs forn4, resulting in the present value of cooperating forever being 98.7 ECU and deviating 90.0 ECU forn4δl.
the experimenter (the same person for every session) read the first page of the in- structions which provided general information about the task. Participants were then allowed to read the remainder at their own pace, and answer the set of control questions that tested their understanding. The control questions were designed to ensure participants understood the game’s timing, how to use the profit table, the impact of inflation, and the method of payment.9 A practice round (with comput- ers) was run prior to the commencement of the experiment. Instructions, including the profit table, can be found in Appendix A.1. Participants played five supergames in each session. We pre-drew the number of periods in each supergame to facilitate comparability between treatments. We wanted to avoid any bias caused by changing the order of supergames with differing lengths. Each supergame lasted for 4, 8, 5, 10 and 3 periods, respectively. We used matching groups of six, and participants were randomly matched into groups of three at the start of each supergame.
A simplified profit table was used, and can be seen in the example instructions in the appendix, with possible prices the integers ∈[1,7]. Integers between 1 and 7 were chosen to make it easier for participants to calculate the average price of the other two firms in the market. In addition, given the profit function, the difference in profit (ECU) for decimal places between these integers is minimal, as can be seen in the profit table found in the instructions. The Nash price is 2, the joint- profit maximising price is 6, and the deviation price is 3. With groups of three, this meant that each participant’s profit depended upon their own price, and the average price of the other two members of their group. Participants were paid for the last period of a randomly selected supergame (Chandrasekhar and Xandri, 2014). On average, subjects earned AUD $26.3 , including a AUD $10 show-up payment. The
9All participants needed to successfully answer the following questions before the practice round began. Participants in then1 treatments were asked "How many seconds does each day last?", while those in then4 treatments were asked how many periods were in a day, and how long each period lasted for. Next, participants were required to identify profit in ECU for themselves, Seller 2 and Seller 3, given a hypothetical set of prices (this was the same for all treatments). Next, they were told they had profit of 20 ECU on Day 3, and needed to determine how much this was worth in AUD, which differed acrossδ. Finally, participants were given a table which identified the profit (in AUD) made each day for a hypothetical game. Participants needed to determine the final payment if Game 3 was chosen for payment.
experiment, including the reading of instructions, control questions, and payment, took one and a half hours to complete.
2.3.1 Hypothesis
We explain how our experimental design allows us to test hypotheses on how the frequency of price changes impacts tacit collusion in the context of infinitely repeated games. The latter requires deeper examination of repeated game characteristics, such as the discount factor and continuation profit, in order to identify the causal relationship between the former.
In Section 2.2 we outlined the stage game and how the critical discount factor is determined. To test our hypotheses it is necessary to have a payoff measure that is comparable across treatments, given the different induced values for δi using a stopping probability and an inflation rate i. Thus, rather than using the average price in each treatment, we instead test for differences using the average supergame payoffs. The average supergame payoff for an infinitely sequence of profits π¯g is calculated as:
(1−δi)
∞
X
t=1
δt−1πt (2.19)
Importantly, the impact of inflation suggests that to compare across treatments, real (inflation adjusted) prices should be considered instead of nominal prices av- eraged over a supergame. Note that we are interested in calculating the average supergame payoff, rather than average prices. Average supergame payoffs are nec- essary to identify overall equilibrium selection of an infinite game. Equation 2.19, which calculates this, is valid for an infinite sequence. As we do not have realised profits for an infinite sequence in our experiment, we need to alter this slightly in order to re-scale the stream of realised supergame profits. This will provide us with the average payoff, which if received in every stage-game of an infinite sequence,
yields the same present value as the realised sequence of payoffs in the supergame.
With discounting, for each supergame g we are able to calculate the average payoff
¯
π, given the termination period T, as:
¯ πg =
PT t=1δtπt PT
t=1δt−1 (2.20)
This gives us an average stage game payoff, which if received in every period of the supergame, would yield the same average payoff as the actual stream of payoffs incurred. This is a convenient measure of collusion, given that period profits may vary, and also provides a discount rate weighted payoff. This will allow us to make comparisons between treatments.
Repeated-game logic suggests that treatment n4δh is likely to have the highest level of cooperation, as it has the highest difference between the continuation profit from cooperating forever, and the profit from deviating today and receiving Nash forever. Given our parameters, the difference between cooperating forever (153.66) and deviating and reverting to Nash forever (132.1) is 21.5 ECU in n4δh. Thus we expect this treatment to have the highest average payoff. By design we have equalised this difference for n1δh and n4δl at 8.71. Therefore, repeated-game logic would not indicate a difference in average payoff between the two. As the difference in continuation payoff is lower than n4δh, the average payoff should also be lower.
Our final treatment n1δl is the only treatment where collusion is not theoretically sustainable as an equilibrium, as the value is negative at -4.04. Therefore, it should have the lowest average supergame payoff. The greater the relative benefits from colluding compared to deviating, the higher the expected average payoff π¯. If par- ticipants behave according to standard repeated-game logic, they correctly take into account these collusion incentives through the number of available price changes per period, either one or 4, and the resulting discount factor. This can be stated as follows in our null hypothesis:
H0: The average period payoff π¯ increases with the difference in continuation payoff from colluding and deviating ⇒π¯n4δh >π¯n1δh= ¯πn4δl >π¯n1δl.
Alternatively, if it is pricing frequency within each period that leads to differences inπ¯, then it would be expected that average payoffs would be lower as n increases, irrespective of the discount factor. The rigidity imposed by only allowing one price change per day means that within-period competition is stifled because price changes are delayed. After observing prices and profits in each pricing period, firms may decide to adapt their price in response, leading to undercutting. This is similar to the undercutting observed in Maskin and Tirole (1988)’s alternate move model, with price cycles characterised by a period of undercutting before a relenting and a price jump occurring. Although the assumptions of their model are not entirely met in our simultaneous move game, it provides an interesting description of firm behaviour, and resulting cycles that are frequently observed in retail petrol markets around the world. In this case, our alternative hypothesis can be stated as:
HA1: Higher pricing frequency leads to lower average payoffs ⇒ π¯n1δh > π¯n4δh and π¯n1δl >π¯n4δl.
The second alternative hypothesis is that only discount factors are relevant, and not the frequency of price changes. For repeated-game logic, the number of price changes impacts how quickly firms can punish, and therefore the threshold level of patience - as measured through the critical discount factor. If the frequency of price changes does not matter, then punishment strategies would not be used within a period. Punishment strategies would only occur across periods. Thus, if pricing frequency does not impact collusion, then there should be no difference in π¯ across n, for a given induced discount factor δ. The critical discount factor δ¯ would be the same for a given stopping probability and inflation rate if n does not impact behaviour.10
10See equations 2.15 and 2.16, where ifn >1is not used as part of a punishment strategy such as grim trigger, then effectivelyn= 1 for both regimes.
In response to a lower discount factor, participants may compensate for earning lower real profits by raising prices in an attempt to raise real profits. This behaviour may occur in the context of experiments where the reality of implementation weakens the logic of an infinitely repeated game and participants target an aspirational real payoff. This impacts δ¯ in the following way. In high inflation environments, a higher profit level is required to achieve the same real payoff in environments with lower inflation. This would result in higher period profits, meaning that the average supergame payoff would need to be higher. We would therefore expect differences between discount factors, within n:
HA2: The lower the discount rate, the higher the average payoff ⇒π¯n1δh <π¯n1δl and π¯n4δh <π¯n4δl.
Our final alternative hypothesis is that both the discount factor and pricing frequency impact average payoffs - a combination of the above two alternative hy- potheses. For HA1,2 to be supported, we would need to have evidence in favour of bothHA1 and HA2. If a higher discount factor results in less collusive outcomes due to participants targeting an aspirational real payoff, but pricing frequency reduces collusive outcomes through adaptive behaviour, then we would expect the follow- ing ordering of average supergame payoffs. The highest average payoff would be observed in n1δl, where a low discount factor leads to higher prices as participants chase higher real profits. There are no within-period price changes to promote a decrease in prices. The lowest supergame payoff would be expected in n4δh where within-period competition is possible, and the discount factor is relatively high.
It is unclear which effect dominates, thus the ordering between n1δh and n4δl is ambiguous. This can be stated as follows:
HA1,2: Higher discount factors and fewer price changes support collusive out- comes ⇒π¯n1δl >π¯n1δh ∼π¯n4δl >π¯n4δh.
Given theory on infinitely repeated games does not provide testable hypothesis (i.e., the multiplicity of equilibria), we are not testing this with our experiments.