J u r n a l M a n a j e m e n T e k n o l o g i
226 Probability of Price Reversal and Intraday Trading Activity on
Tick Size-25 at Indonesia Stock Exchange
Perdana Wahyu Santosa
243
Penentuan Waktu Pembangunan Pabrik Semen Baru untuk Antisipasi
Shortages di Indonesia
Yudha Andrian Saputra
252
Perancangan Strategi Pengembangan Industri di Kabupaten Tangerang
Berbasis Kompetensi INTI
Rahmat Nurcahyo, Teuku Yuri Maemunsyah Z, Erlinda Muslim, Saparudin
264
Pengaruh Nilai Informasi dan Sosial pada Co-Consumption dan
Co-Production antar Anggota Kaskus: Perspektif Modal Sosial
Badri Munir Sukoco, Mohamad Lambang Aditya
281 Analisis Pengaruh Total Returns terhadap Tingkat Engagement
Dosen Institut Teknologi Bandung
Purwanti Wulandari, Aurik Gustomo
299
Analyzing the Role of ICT Sector to the National Economic
Structural Changes: the Case of Indonesia
Ubaidillah Zuhdi, Dhanan Sarwo Utomo, Dini Turipanam Alamanda
308 Agent-Based Modeling for Efficiency Policy of Households’
Electricity Consumption in Bandung City
Devilia Sari, Utomo Sarjono Putro, Dhanan Sarwo Utomo
324 Index
Perdana Wahyu Santosa Faculty of Economics
YARSI University
Indonesian Journal for the Science of Management
Volume 10 Number 3 2011
Terakreditasi “B” berdasarkan Keputusan Direktur Jenderal Pendidikan Tinggi, Departemen Pendidikan Nasional
Nomor: 81/DIKTI/Kep/2011.
Tanggal: 15 November 2011. Masa berlaku 5 (lima) tahun sejak tanggal ditetapkan.
Probability of Price Reversal and
Intraday Trading Activity on
Tick Size-25 at Indonesia
Stock Exchange
Abstract
In this paper, I examine the probability of price reversal and the relationship with intraday trading activity in market microstructure context, focusing specifically on interrelate with stock's return, trading volume, frequency of transaction, volatility and liquidity on high tick size (IDR25).This research use purposive random sampling to get some observed samples and data online capturing. Trading fraction of tick-by-tick of trading activity is 15 minutes. To determine price reversal probability, I employ multiple logisticregressions in high frequency data. The conclusion of this research finds that stock's return, trading volume (V), frequency of transaction (F) and proxy V/F affect significantly on probability of price reversal on information uncertainty condition. These are substantial findings of intraday trading activity and overreaction concept at Indonesia Stock Exchange.
Keywords: probability, reversal, intraday, trading, IDX.
Abstrak
J u r n a l M a n a j e m e n T e k n o l o g i
J u r n a l M a n a j e m e n T e k n o l o g i
227
228
menunjukkan bahwa imbal hasil saham, volume perdagangan, frekeunsi transaksi, dan proksi V/F memberikan efek signifikan terhadap price reversal.
Kata kunci: probabilitas, reversal, intra-harian, tick size, BEI.
1. Introduction
In this paper, I examine about probability of price reversal and the relationship with intraday trading activity in market microstructure context, focusing specifically on interrelate with return, trading volume, frequency of transaction, volatility and liquidity on high tick size. Price reversal issuance is subject as apart of intraday trading activity that often happened in any capital market around the world especially in emerging market like Indonesia Stock Exchange (IDX). This phenomenon caused by high price volatility and liquidity pressure of intraday trading that driven by capital market reaction to uncertainty of news or information arrivals. Higher level of probability price reversal can generate higher risk intraday trading because of price direction often change suddenly.
This circumstances may create more profit taking or cut loss activity because of the price direction is harder to predict by traders in uncertainty information condition. However, behind risky intraday trading activity there are plenty opportunityto make money from intraday capital gain consistently (Markman, 2000). The phenomenon of price reversal is often happens at any emerging market in the world especially at Indonesia Stock Exchange (IDX). This phenomenon potentially creates high risk trading which caused by overreaction and liquidity pressure. The purposes of this research are to examine the probability of price reversal and intraday trading activity based on high frequency data.
What do determines price reversal on trading activity? Experimental and survey evidence indicate that in probability revision problems, people show a tendency to over-react. The traders may have overweight recent information and underweight base rate data. Theoretically, the standard of researcher paradigm of stock price movement in capital market has reflected all informations which arrived into the market either public or private information.
The efficient market hypothesis is based on the belief where the past price patterns in security movement are consistent with a random walk. Two other efficiency-based hypotheses have been identified at the recent literature. The over-reaction hypothesis (OH) suggests that extreme movements in equity prices are followed by “corrective” movements in the opposite direction of the initial over-reaction (Rartner & Leal, 1998), meanwhile, stock price changes in one direction are followed by changes in opposite direction (reversal).
Kofman & Moser (2001) obtained a measure of the frequency with which prices may have over-reacted to new information. Over-reaction followed by price correction is a pattern which is consistent with what is termed fad trading. Fad trading is buying or selling equity based less on information about the value of assets than on the fact that buying or selling is the things to do. The idea of fad-motivated trading is described as prices being the result of traders “getting on the bandwagon” as opposed to independently arrived at judgments about the true value of these assets.
Practically, stock price at IDX is often in overvalued or undervalued condition because of some factors, such as over-reaction and uncertainty in the value of market fluctuating. The uncertainty makes traders and/or investors tend to over-reacting valuing stocks (assets). This circumstance makes the asset price is not in fair value (or intrinsic value). In other word, stock price in capital market tends to be mispriced. Stock prices which are in mispricing condition either in undervalued or overvalued will be followed by price correction process in the opposite direction. This price correction will create price reversal repeatedly.
Base on a descriptive observation, stocks of all tick sizes at IDX show probability of price reversal potency ranges from 7.7 to 24.3% in per 15 minute period. The general pattern is referred that potency of price reversal at equites market is a big enough and it will create equity trading risk in the short term period. The numbers of price reversal arearound 14 times a day, either major or minor price reversal for each liquid stock. There is every stock create average more than 9 times price reversals that offer advantage from intraday trading of financial assets.
The volatility of trading volume was also high enough to create liquidity pressure to the market and increase the invesment risk also. In this circumstances, capital market can be categorized not conducive for stock trading and short-term investment because the trend of price direction may change quickly (Lyons,2001). However, for the traders that transact stock in very short time (hourly) on the same day (intraday trading), this market fluctuation may offer the plenty opportunity to get gain (Cassidy, 2002). This paper reframes the factors which determine probability of price reversal such as stock return and intraday trading activity variables. This research uses high frequency finance data at tick size IDR5 that represented by stock of Bank of International Indonesia, Tbk (BNII.IJ) as a sample. We ask whether stock return and micro-structure variables effect on the over-reaction associated with probability of price reversal.
This research is focused on main problems that are influenced by intraday trading activity in the market micro-structure context on probability of price reversal. The problems of formulation are conducted in order to every problem that can be discussed and solved that compiled in the stock return, trading volume, frequency of transaction, proxy trading volume per frequency, price volatility and liquidity influence on probability of price reversal oftick size-5 on intraday trading at IDX.
Zhang (2006) explains that substantial of short-term stock price continuation, which the prior literature offten attributes to investor underreaction to new information. There are include positive serial correlation of returns at 3 to 12 month horizons (Jagadesh & Titman, 1993),and Daniel, Hirshleifer & Subrahmanyam (1998) review that post earnings announcement stock price drift in the direction indicated by earnings surprise, and the post-event return drift in the direction of announcement date return. Uncertainty information contributes to this probability of price reversal phenomenon in intraday trading activity. The ambiguity with respect to the implications of new information for value of the firm, that potentially stems from two sources: volatility underlying fundamentals value and poor analitical skill and poor information (Zhang, 2006).
Theoretically, movement of stock price in capital market has reflected all quality of informations that just arrived into market, either public or private information (O'Hara, 2005). Nevertheless, practically, stock price frequent experiences of overvalued or undervalued because of many factors, especially
Based on the market microstructure and the respond time of intraday traders; price will respond to news or information that arrives inti market as it changes the structure of the information set. In this circumstance, we focus on the speed of reaction of traders to news and extent of this price response that we considered in this research.
Summer (1986) explains that the presence of a fad component in the determination of stock prices implies that stock prices will reverse as fads dissipate. Stoll & Whalley (1990) enhance that behavior of price volatilityare related to frequency of price reversal, determined also by level of capital market efficiency.High non trading probabilities would be encountered were trading activity concentrated in short time frames and, therefore, more likely motivated by similar information [(Kofman & Mosser (2001)]. This suggests that the higher stock return increase the probability of nontrading activity.
Kofman & Moser (2001) conducted three approachs to explain whether stock return level affects on trading activity, that produce:
#
First: frequency of (in graphical) price reversal shows that percentage reversal have negative relation/link to level of stock return.#
Second: the mean time between price reversals also show negative relation/link to level of stock return.#
Third: the usage of model logit specification proves that probability of price reversal have negative relation/link to level of stock return. According to Chan et al., (1995), the risk of price reversal is caused by volatility and liquidity pressure which market index change direction (rebound) suddenly after sharpincrease or decrease. Bondt & Thaler (1985) explain that if stock prices systematically overshoot, then their reversal should be predictable from past return data alone, with no use of any accounting data such as earnings. Specifically, two hypotheses are suggested: (1) Extreme movements in stock prices will be followed by subsequent price movements in the opposite direction. (2) The more extreme the initial price movement, the greater will be the subsequent adjustment. Both hypotheses imply a violation of weak-form market efficiency.Capital market with weak to semi strong form efficiency, often happens panic buying that stock price increase sharply, and then it can change direction becomes panic selling instantly, until stock price go down drastically (noise trading). On the contrary, after market index rebound, then panic selling changes become panic buying in just several hours period. Phenomenon of noise trading is frequent happened as consequence of information which entry to the market that countered redundantly (overreaction) [Black (1986); Kofman & Moser (2001)]. These opinions give contribution for this research that emerging market like IDX has huge price reversal potency caused by market microstructure noise.
Although trading trend direction fickle and difficult to predict, however trading activity remain to work. To know of this truly caused of this course is not easy job. The factors of this phenomenon include financial and non-financial. Beside behavior that include of mind set, knowledge, emotion, and perception of traders and investors. One factor that most significant is the arrival of news into market, especially when the news is unexpected information or dramatic news (Bowman & Iverson, 1998). In stock prices movement, market tends to too responsive and will be overreacted until disagree with new price prediction that implied in information that arrive into market [O'Hara (2005), Bowman & Iverson (1998)]. uncertainty in the form of fundamental value and irrational market fluctuating. My main hypothesis is that
if equities price formation does not represent its fair value (intrinsic value), stock price always in mispricing condition. Stockprice that experienced of mispricing will searching its fair value by price correction process that causing price reversal repeatedly. My hypothesis is motivated by prior results from the behavioral finance on microstructure theory especially O'Hara (2005) and Hirshleifer (2001).
This general pattern forming price reversal consistently and creates difference (gap) or mismatch
1
between theory and empirical facts (Kofman & Mosser, 2001). This formulation of research problems are based on preliminary study on samples stock with high tick size atIDX. We examine the probability of price reversal and the relationship with intraday trading activity in market microstructure context, focusing specifically on interrelate with stock's return, trading volume, frequency of transaction, volatility and liquidity on tick size -25.
This research aims to explain how significant return and trading mechanism affected the price formation process and overreaction to make price reversal when the mispricing has to be corrected by market:
a. Construct the framework of influence of return and intraday trading activity that consist of volume, frequency, proxy V/F, volatility and liquidity to probability price reversal onhigh tick size.
b. Analysis the pattern intraday trading activity on high tick size and construct model in econometrics form as the intraday trading guidance and analysis technical tool for all traders, alternatively.
2. Related Literature and Research Paradigm
The price reversal process is the microstructure study of market efficiency.The overreaction process and price reversal is in market microstructure theory context, caused by the influence of order flow that carry new information content to move equity price on imbalance order effect. Kofman & Moser (2001) suggest that relation/link between conditional probability of price reversal and level of stock return and some other variables on logit model framework. They introduce a model in which prices are determined by two investing clienteles: informed investors and noise-trading investors.
Furthermore, Kofman & Moser (2001) explain that by studying the frequency with which stock price changes in one direction are followed by changes opposite direction (price reversals), they obtain a measure of the frequency with which prices may have overreacted to new information. Overreaction followed by price correction is a pattern that is consistent with what is termed fad trading.
To understand price discovery and reversal in context that how prices incorporate information properly, we have to consider about trading mechanism and price formation process seriuosly. In trading process–in particular the order flow-as a information filtration. Walsh (1997) argue that at any trading time, any 'news' that arises from a particular order or price will add to the existing information set.
1
J u r n a l M a n a j e m e n T e k n o l o g i
J u r n a l M a n a j e m e n T e k n o l o g i
231
232
Nevertheless movement of stock price direction not only depend on content of news or information that accepted but also the market perception and analysis quality of traders/investor to get the intrinsic value of stock (Madhavan, 2000). If information is assumed as a good news, then price will go up, otherwise, the stock price will go down. Interesting perceived is how high the stock price can go up or downward fairly in accordance with information content that brought by news/public information. It is depend on market efficiency level.
According to Bowman & Iverson (1998), market tends to be overvalued or undervalued as consequence of market overreaction phenomenon. Bondt & Thaler (1987) conjectured that, a consequence because of investor overreaction to earnings, stock prices may also temporarily depart from their underlying fundamental values. Furthermore, stock price diverge from its fundamental value and the overreaction is an advantage for informed traders to make capital gain (Black, 1986). Because of investor overreaction to new information that arrives to the market, the stock price will be corrected (price correction) to the efficient value after create price reversal first. Thus the more often stock price are overpricing or underpricing in market, will be the more price reversal(Zhang, 2006).
Kofman & Mosser (2001) find that time period required to find the its fair value after conduct overreaction is vary, depend on quality analysis and rationality of traders it self. That means, price correction depend on level of market efficiency in instructing price matching with its fundamental value.In general, more efficient a market will make time requirement for price correction will shorten. Where as at the market that is emerging like IDX, price correction will take time longer than the efficient market like NYSE or TSE (Chan et al., 1995). Price forming to its fair value influenced by infrequent trading or nontrading period of the market also (Lo & MacKinlay, 1990). Fama (1970) argued that price reversal was induced by imbalanced order and what kinds of market microstructure that instituted by exchange.
According to Easley & O'Hara (2003), the market information that can be public information only, not including private information who owned by informed strategic traders. Superior private information which owned by some of strategic traders was extracted by trading activity and leak to the uninformed traders. But the informed traders get the capital gain first because more strategic than uninformed traders anyway (Kyle, 1985). The informed trader will create price volatility; stimulate overreaction and price reversal in the right time because they know how the fair value is (Copeland & Galai, 1983). O'Hara (2005) explains the latter concept of trading gain, however, suggest otherwise: information cost will make this average investors actually loss money relative to the market return over time. This information loss arises because of the presence in the market of traders who have superior information. In particular, the market maker who is in the middle of all trades knows that some traders may have better information than he does.
These informed traders buy when they know the stock's current price is too low; they sell when they know it is too high. More over, these informed traders have the option not to trade, unlike the market maker. The market maker knows that when he is trading with informed traders he always loses. To remain solvent, the market maker must be able to offset these loses by making gain from uninformed traders. This gain arises from bid-ask spread. In consequence of strategic traders activity, the movement of stock price direction in general started by informed traders that make efficient price forming, then will followed by uninformed traders in fad trading activity that create overreaction and price reversal will be followed (Summers, 1986).
Despitefully, according to Kofman & Mosser (2001) there is also other market reaction which called lag learning, that is price reaction which is on generally “late” to respond the content of new information that arrives to the capital market. Its caused by many reason, for example because of the lack of information access and/or weaken its analysis. General illustration for this research that market reaction that emerge to the arriving of public information can be categorized into 3 types, : 1). overreaction, 2). fair value (efficient) and 3) lag learning (underreaction).
2.1. Research Paradigm
Research Paradigm is made arrangements for down process of analysis design that is by connect all independent variables research to probability of price reversal. Independent variables that used already accepted as microstructure and activity of stock trading variables. The compilation of framework idea is conducted base on prior of theory and journals that related to activity of stocktrading intraday and price reversal [Zhang (2006), Chordia et al, (2000), Easley & O'Hara (2003) and Chan & Faff (2003), Fama & French (1992), Kyle (1985), Kofman & Moser (2001) and Glosten & Milgrom (1985]. Independent variables as used in analysis design covers volume trading, frequency, proxy volume per frequency (V/F), volatility and liquidity on high frequency data.
Analysis of regression equation logit is conducted at biggest tick size (Rp. 50) pass by sampel emiten stock high tick size-50. From model reggression analysis this logit are expected give independent pattern of variables influence public to probability price reversal. Analysis is is important conducted as the indication of introduction analysis that give instruction of continuation analysis in determining fit expected research model.
These independent variables are selected from some prior and recent research that relates to phenomenon of price reversal based on:
#According to Kofman & Moser (2001), Summers (1996): level stock return influences on probability of price reversal in the long-run.
#Intraday trading activity as independent variables that will be related to probability of price reversal based on:
#Trading Volume [Chordia et al. (2001), Chan & Fong (2000), Odean (1998), Zarowin (1990), Admati & Pfleiderer (1988)]
#Trading transaction frequency [Juh Lin et al. (1999), O'Hara (2005)]
#Proxy volume/frequency [Juh Lin et al.(1999), Zhang (2006)].
#Volatility of stock price [Koulikov (2004), Chan & Fong (2000), Chang et al. (1995) and French & Roll (1986)]
#Stock Liquidity [Dataret al. (1998) and Chordia et al. (2002), Hameed et al. (2010)]
Above mentioned researchers use secondary daily data that give explanation and finding in analysis framework of price reversal on a long-term capital market activity. Where as this research, we use high frequency data or tick-by-tick in time framework intraday trading so it's can give finding and different findings or conclusions. Beside the diffrences of its data character, market structure difference and rule of pricing from NYSE with IDX also give significant influence on analysis results also.
The analysis research model base on the framework above paradigm is designed in the form of multiple logistic regressions shall be as follows:
2.2. Hypothesis
The summaries of research hypothesis for high tick size on intraday trading at IDX are: 1.Hypothesis 1 (H1): Stock Return has positive affect on probability price reversal. 2.Hypothesis 2 (H2): Trading Volume has positive affect on probability price reversal.
3.Hypothesis 3 (H3): Frequency of Transaction has an positive affect on probability price reversal. 4.Hypothesis 4 (H4): Proxy V/F has positive affect on probability price reversal.
5.Hypothesis 5 (H5): Volatility has positive affect on probability price reversal.
6.Hypothesis 6 (H6): Liquidity (proxy turnover rate) has positive effect on probability price reversal.
3. Research Method
This microstructure research method uses random purposive sampling with a purpose to get stock samples at IDX that represents stock population with tick size-25. Sampel stock is required fulfill some criterions so its can reflects stock movement from its population referred [as]. Conditions sampel research covers: : (a) price volatility, (b) liquidity, (c) active stock more than 2 year, (d) big market capitalization (e) good fundamental reputation, (f) leader in its sector, and (g) most active stock list. Sampel research that obtained is PT Aneka Tambang, Tbk (ANTM), PT United Tractors, Tbk (UNTR), PT London Sumatera Plantations, Tbk (LSIP) and PT Timah, Tbk (TINS) as the leading companies on tick size-25 at IDX. These samples besides assessed quite active and liquid stock also represents of dominant mining sectors atIDX.
After sampel stock is got then primary data with drawal (by data capturing) directly from its source that is running trade active transaction. For dependent variable, probability price reversal has the form of data categorical 1 or 0 that counts directly from the intraday charts and the independent variables, which are return, volume, frequency, volume/frequency, volatility and liquidity. The period ot time fraction are 15 minutes as primary data that capyure directly when trading activity is running. Here in after, primary data
st
archives (in primary archival data) transaction real time.This research are conducted February, 1 –
th
April, 30 2008 period.
3.1. Primary Data Sources and Capturing Technique
The Indonesia Stock Exchange (IDX) co-ordinates and employ trading mechanism on equities in
2
Indonesia through a national trading system knowns Jakarta Automated Trading System (JATS) . JATS is a continuos electronic open limit order book for all equities at IDX through which brokers can enter bids and ask throughout the trading day from 09.30am to 04.00pm). Primary data source research that directly capture from real time trading from JATS in regular trading (RG board) in intraday activity.
We will present just a summary of step by step of data gathering here shall be followed:
#
Organized a team that trained on how to capture primary data from running trade of IDX from JATS and other intraday trading data in real time. In this first step helped facility by PT Sarijaya Permana Sekuritas, Tbk. Terminal (PC) in the office of each broker allow instant access to this intraday trading activity (such as trading volume, frequency of transaction, bid-ask orders, price, etc) including price reversal charts of equities.#
Source data/information indigenous to running trade IDX that obtainedby real time StockWatch® services throughout day trading.#
Equipments preparation like PC, Modem, Internet network and others must in running well and electrics supply must maintain still on during primary data intake this. In the event of online trading equipments trouble (OLT) that caused technical problem then all previous datas will char.#
Data is captured from StockWatch® in 15 minute period directly as primary data intraday. In this step calls 'zero error' caused if we make mistake then we have to do the data capturing from beginning again.#
Data subdividing into main file in accordance with stock sampel each. After succeed networked primary data grouping, and then conducts archival primary data from trading process during more-less 1059 data/variable/stock.4. Analysis and Discussion
4.1. Descriptive Analysis
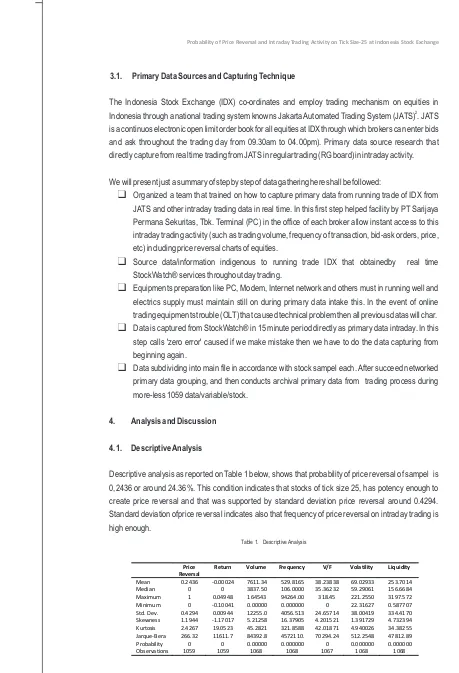
Descriptive analysis as reported on Table 1 below, shows that probability of price reversal of sampel is 0,2436 or around 24.36%. This condition indicates that stocks of tick size 25, has potency enough to create price reversal and that was supported by standard deviation price reversal around 0.4294. Standard deviation ofprice reversal indicates also that frequency of price reversal on intraday trading is high enough.
Table 1. Descriptive Analysis
2
All transactions in the Exchange are processed in a facility called as Jakarta Automated Trading System (JATS).
Only the Exchange Members, who also become the members of the Indonesian Clearing and Guarantee Corporation (KPEI), can input the orders into the JATS. The Exchange Members are responsible for every transaction they make in the Exchange and they have the responsibility to settle all the transactions they've made
Price
Reversal
Return Volume Frequency V/F Volatility Liquidity
J u r n a l M a n a j e m e n T e k n o l o g i
J u r n a l M a n a j e m e n T e k n o l o g i
235
236
This Table reports the descriptive analysis of that using tick-by-tick data during February 2008-April 2008 period on tick size-25at Indonesia Stocks Exchange (IDX). The variables, including price reversal, stock's return, trading volume, frequency of transactions, proxy trading volume per frequency of transaction, price volatility and proxy liquidity that used turnover rate. The period of tick-by-tick (fraction) are 15 minutes and data was captured directly from online intraday trading activity.
Despitefully, this elementary finding indicates that price forming of tick size 25 quite dynamic and efficient enough accompanied with high price reversal. The informed traders with block trading characteristic tends to take a abnormal return fromstock with tick size 25, because they know terminal value based on fandamental value of firm's value. Onhigh tick size stock (known as blue chips) and with high price, relatively.
This is exactly what might be expected by informed traders. On the other side, uniformed traders for small capitalization stocks should be compensated with greater expected return because they probably face the greater trading risk and higher transaction cost, anyway. Big market capitalization stocks with high tick size may have more complicated for uninformed traders because in each its transaction they will find difficulties to read and analysis about “the true information” that owned by informed traders.
Most of informed traders know how the terminal value of stocks are. Beside, the big capitalization stock like our sample tends to underreact relate to news that arrive into market because informed traders have its information and uncertainty information to stock return.
Table 1 shows decriptive analysis of high tick size stock of IDX that tradingwith low return, medium volume (lot) and low frequency of trasaction. These findings indicates that intraday trading activity for blue chips dominated by block trading system which the trading volume more priority than transaction number. The low return may have caused by essentially and primarily long-term investment oriented from informed investor with underreact to response new public information that released by regulator or corporate action.
However, the volatility is medium scale for intraday trading. This medium volatility may give plenty opportunity to intraday traders both informed and uninformed. This volatility supported by liquidity that shows good enough for intraday trading when traders dealing with these medium liquid stocks.
4.2. Preliminary Analysis of Logit Regression on Tick Size-25
To explore whether the influence of stock return and intraday activity variables such as trading volume, frequency of transaction, ratio V/F, price volatility and liquidity to probability of price reversal, this research use hypothesis testing shall folows:
H : No independent variables that influence to probability price reversal on high tick size0
H : There are independent variables that influence to probability price reversal on high tick size1
Test criteria: Reject H if probability value<5%, do not reject otherwise.0
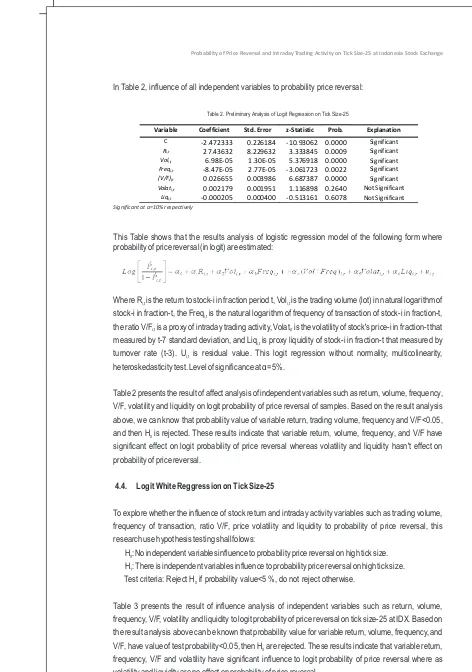
In Table 2, influence of all independent variables to probability price reversal:
Table 2. Preliminary Analysis of Logit Regression on Tick Size-25
Significant at a=10% respectively
This Table shows that the results analysis of logistic regression model of the following form where probability of price reversal (in logit) are estimated:
Where R is the return to stock-i in fraction period t, Vol is the trading volume (lot) in natural logarithm of i,t i,t
stock-i in fraction-t, the Freq is the natural logarithm of frequency of transaction of stock-i in fraction-t, i,t
the ratio V/F is a proxy of intraday trading activity, Volat is the volatility of stock's price-i in fraction-t that i,t i,t
measured by t-7 standard deviation, and Liq is proxy liquidity of stock-i in fraction-t that measured by i,t
turnover rate (t-3). U is residual value. This li,t ogit regression without normality, multicolinearity, heteroskedasticity test. Level of significance at á= 5%.
Table 2 presents the result of affect analysis of independent variables such as return, volume, frequency, V/F, volatility and liquidity on logit probability of price reversal of samples. Based on the result analysis above, we can know that probability value of variable return, trading volume, frequency and V/F<0.05, and then H is rejected. These results indicate that variable return, volume, frequency, and V/F have 0
significant effect on logit probability of price reversal whereas volatility and liquidity hasn't effect on probability of price reversal.
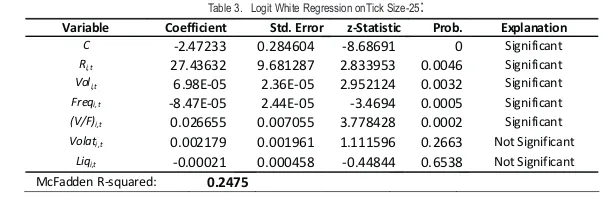
4.4. Logit White Reggression on Tick Size-25
To explore whether the influence of stock return and intraday activity variables such as trading volume, frequency of transaction, ratio V/F, price volatility and liquidity to probability of price reversal, this research use hypothesis testing shall folows:
H : No independent variables influence to probability price reversal on high tick size.0
H : There is independent variables influence to probability price reversal on high tick size.1
Test criteria: Reject H if probability value<5 %, do not reject otherwise.0
Table 3 presents the result of influence analysis of independent variables such as return, volume, frequency, V/F, volatility and liquidity to logit probability of price reversal on tick size-25 at IDX. Based on the result analysis above can be known that probability value for variable return, volume, frequency, and V/F, have value of test probability<0.05, then H are rejected. These results indicate that variable return, 0
frequency, V/F and volatility have significant influence to logit probability of price reversal where as volatility and liquidity are no effect on probability of price reversal.
Probability of Price Reversal and Intraday Trading Activity on Tick Size-25 at Indonesia Stock Exchange Probability of Price Reversal and Intraday Trading Activity on Tick Size-25 at Indonesia Stock Exchange
Variable Coefficient Std. Error z-Statistic Prob. Explanation
C -2.472333 0.226184 -10.93062 0.0000 Significant
Ri,t 27.43632 8.229632 3.333845 0.0009 Significant Voli,t 6.98E-05 1.30E-05 5.376918 0.0000 Significant Freqi,t -8.47E-05 2.77E-05 -3.061723 0.0022 Significant (V/F)i,t 0.026655 0.003986 6.687387 0.0000 Significant Volati,t 0.002179 0.001951 1.116898 0.2640 Not Significant
The results analysis of logit ”fit model” explain that coefficient of independent variables such as stock return is more stronger effect than coefficient of volume, frequency of transaction and proxy V/Fon probability of price reversal. I also document a second findings that complements logit analysis results. I find volatility and liquidity has no effect on probability of price reversal, surprisingly. Where as trading volume and liquidity are most important atributes in intraday trading activity and specifically, price volatility has dynamic relationship with stock return.
Table 3. Logit White Regression onTick Size-25:
Significant at a=10%, respectively
This Table 3 explains that the results analysis of logistic regression model of the following form where probability of price reversal (in logit) is estimated (with Normality test, Multicolinearity test, and White Heteroskedasticity treatment)
Where Ri,t is the return to stock-i in fraction period t, Voli,t is the trading volume (lot) in natural logarithm of stock-i in fraction-t, the Freqi,t is the natural logarithm of frequency of transaction of stock-i in fraction-t, the ratio V/Fi,t is a proxy of intraday trading activity, Volati,tis the volatility of stock's price-i in fraction-t that measured by t-7 standar deviation, and Liqi,t is proxy liquidity of stock-i in fraction-t that measured by turnover rate (t-3). The results are not quite different from Table 2 above that no normality test, multicolinearity test and white heteroskedasticity treatment.However, trading volume still has effect on price reversal by proxy V/F. In facts, intraday trading on tick size-25 at IDX has been controlled by informed traders, especially foreign investors with huge fund (including hot money), have excellent analytical skill both fundamental and technical and have information access.
4.5. Discussion
Analysis of multiple logit regression on high tick size stocks find some interesting research results. Regression results (with step wise)shows important equation to explain various of probability of price reversal on intraday trading activity at IDX. I document new patterns in dynamics between probability of price reversal and some independent variables such as stock return, volume, frequency of transaction, and proxy V/F. However, volatility and liquidity as most important atributte in intraday trading activity are not significant. These findings prove that some variables inconsistent with some recent research [Kofman & Moser (2001), Chordia et al. (2003), Chan & Ffaf (2003), Zhang (2006)].
This model gives new dynamics views and pattern that this research variables are strong enough to explain probability of price reversal with theory of microstructure and some recent research. The re-frames of research paradigm is good enough also. The independent variables which show best effect for this research is stock return and proxy V/F.
Volume (+)
In general, study finds the fit model that represent tick size-25 stocks shall be as follows:
Figure 1. Dynamics Pattern of Probability of Price Reversal on Tick Size-25
As noted above, this research finds a positive relationship between stock return and probability of price reversal and the likelihood of non-intraday trading fraction. The stock return driven by price changes that incorporated with volatility, more over, the component of price change that is unrelated to predictable effects like turnover rate and bid-ask bounce (liquidity effects).
To properly understand price formation, overreaction, price correction and then price reversal in one frame, we need to know how prices incorporated information flow. Walsh (1997) explains that at any trading time, any 'news' that arises from a particular order or price will add to the existing information set. Based on the market structure and the reaction times of traders, prices will respond to 'news' as it changes the structure of the information set. It is the speed and extent of this price response that we consider here. The logit regression result indicate that high return extent of non intraday trading period and that return positively related to probability of price reversal.
Inspection of Table 3 shows that positive coeficient of stock return may not surprisingly. This is probably due a combination of momentum effects about corporate action and earning report meet analyst forecast in the first two quarters during this study.These momentum may have microstructure implication relates to the friction and the microstructure noise. Related to coefficient of return, this condition can be just happened in intraday trading framework because the price up-down around the bid-ask spread only like “bouncing effect”. This bouncing effect relates to stock return behavior that generated under continous trading mechanism that the stock price bounce between bid-ask price because of fad trading that based on less information (Summers, 1986).
According to Rhee & Wang (1997), the bid-ask error can induce two types of measurement errors: 1) the bid-ask bounce and 2). the spread size error. Each of these errors is likely to cause negative autocorrelation in observed returns. For the stock return analysis, the optimal return series, which is characterized by minimum ask error, can be defined as the return calculated by averaging the bid-ask prices. The alternative suggestion, the bouncing effect was generated on high tick size stock because of the friction and noise microstructure. The friction and noise may have make distortion on the price formation process and generate autocorrelation. The most bouncing and noise microstructure implication of this logit specification model, confirm by the empirical results.
Variable Coefficient Std. Error z-Statistic Prob. Explanation
C -2.47233 0.284604 -8.68691 0 Significant
Ri,t 27.43632 9.681287 2.833953 0.0046 Significant Voli,t 6.98E-05 2.36E-05 2.952124 0.0032 Significant Freqi,t -8.47E-05 2.44E-05 -3.4694 0.0005 Significant
(V/F)i,t 0.026655 0.007055 3.778428 0.0002 Significant Volati,t 0.002179 0.001961 1.111596 0.2663 Not Significant
Liqi,t -0.00021 0.000458 -0.44844 0.6538 Not Significant
J u r n a l M a n a j e m e n T e k n o l o g i
239
This price reversal phenomenon repeats consistently because of assymetric information where the informed traders ”care of” in order to price on positive trend as long as research duration. The price reversal is more sensitive when the price go down than price go up because of the rational expectation. These circumstances, especially the friction and noise tend to have greater short run variability of stock prices. The evidences of research show consistence with order imbalance temporary and microstructure dynamic under the assumption of poisson arrival of traders also. However, the increasing of price pressure that exploited by smart informed trader which conducts trading with buy or sell order manipulation may have not optimized the fit model prediction.
Consider how trading volatility and liquidity unrelated to probability of price reversal depend on the arrival of new orders to market is processed. When a new order arrives at the market, market particiants will know the size and direction of of the order, particularly those perticipants who informed and closely follow the market, like informed traders and may be brokers. Volatility and frequency of transaction was tend controlled by informed traders consistently with big transaction value and its transaction frequency that always keep balanced proporsionally. This findings is not relevant with Easley & O'Hara (2003) paper.
This finding was proven that variable V/F most significant, because the ratio between volume trading and transaction frequency always proporsional. The value of private information who owned by strategic traders is protected with V/F ratio proporsionally that difficult to extract to become public information.This finding supports Lin et al, (1999). However strategic traders have conditional expectation of the order about its terminal value and some forecast error can be involved hence the price will be overvalued because deviate from rational expectation. In any incident, most uninformed traders participate in trading activity based less information, off course, so price volatility will be higher than expected by informed traders. The orders process like this repeats for every news arrives into market and the always create price reversal.
5. Conclusion
The logit specification results indicate that on high tick size at IDX, the extent of intraday trading, and that stock return positively related to the probability of price reversal. Another finding noted that volume, and proxy V/F, positively related to probability of price reversal except frequency of transaction. However, volatility and liquidity have no influence on probability of price reversal. These results are not consistent with the conclusion of Kofman & Mosser (2001), Summers & Summers (1989) and O'Hara (2005), so far. At the high level of tick size for big size stocks (blue chips), uninformed traders hard to enter the capital market that can't increases the overreaction of these stocks price which will diverge from its fundamental level. As we know, price reversal occur when price return to its fundamental like stock reverse hypothesis. The research findings suggest that informed traders are more sensitive to the fundamental value and less to its transaction cost.
Autocorrelation of the return for intraday trading are higher in the observation periods when the sentiment of corporate action is low. This implies an increase of the probability of price reversal and is suggestive of a positively correlation between return and price reversal caused by higher market participation of informed traders. The price will be bounced around the bid-ask spread only if no news arrives into market.
The bounces create high trading volume and transaction number but the price do not change, significantly. Hence, the trading volume unrelated to probability of price reversal and transaction frequencies are positively correlated to probability of price reversal in large range movement of price.
The proxy V/F is positively correlated to probability of price reversal more substantially than other independent variables. These results are consistent with the conclusion of descriptive analysis. This implication shows that ratio of volume-frequency suggest eliminate price manipulation of stock transaction in intraday trading. In other hand, ratio volume- frequency can reduce the gap of transaction between informed traders who conduct transaction in block trading and uninformed traders that rely on retail trading. The other variables such as price volatility and liquidity are positively related to probability of price reversal. The volatility is indicated that its pattern has link with stock price movement that implies an increase of the probability of price reversal. The authority of IDX implements stock trading system with continous auction method, without the role of market maker or specialist. The behavior of return volatilityis higher on open-to-open than close-to-close. This findings can be happened because occur abnormal return in market on close.
Acknowledgment
The author gratefully acknowledges online trading facilities for high frequency data of Sarijaya Securities and the valuable comments and critics of Armida S. Alisjahbana, Roy H. Sembel, Budiono, Rina Indiastuti and Rahardi S. Rahmanto. All errors and omissions are, of course, my own.
References
Admati, A. R. and Pfleiderer, P. (1988). A Theory of Intraday Patterns: Volume and Variability. The Review of Financial Studies I: 3-40.
Amihud, Y., and Mendelson, H. (1987). Trading Mechanisms and Stocks Returns: An Empirical Investigations. Journal of Finance 42: 533-553.
Bessembinder, H., and Seguin, P. J. (1993). Price Volatility, Trading Volume and Depth: Evidence from future markets. Journal of Financial and Quantitative Analysis 28: 21-39.
Bonser-Neal, Linnan, D., and Neal, R. (1999). Emerging Market Transaction Cost: Evidence from Indonesia. Pacific-Basin Finance Journal 7: 103-127.
Bowman, R. G., and Iverson, D. (1998). Run Overreaction in the New Zealand Stock Market. Pacific-Basin Finance Journal 6: 475-491.
Brennan, B., and Subrahmanyam, A. (1996). Market Microstructure and Assets Pricing. Journal of Financial Economics 41 (3): 441-464.
Campbell, J., Grossman,S., and Wang, J. (1993). Trading Volume and Serial Correlation in Stocks Returns. Quarterly Journal of Economics 108.
Campbell, J.Y., and Lo, L.W. (1997). The Econometrics of Financial Markets. Princeton University Press, Princeton, NJ.
Chan, H.W., and Ffaf, R.W. (2003). An Investigation into the Role of Liquidity in Asset Pricing: Autralian Evidence. Pacific-Basin Finance Journal 11: 555-572.
Chang, R.P., Ghon Rhee, S., and Soedigno, S. (1995). Indonesia Price Volatility of Stocks. Pacific-Basin Finance Journal 3: 337-355.
Probability of Price Reversal and Intraday Trading Activity on Tick Size-25 at Indonesia Stock Exchange Probability of Price Reversal and Intraday Trading Activity on Tick Size-25 at Indonesia Stock Exchange
Chopra, N., Lakonishok, J., and Ritter, J. (1992). Abnormal Measuring performance: Do stock market overreact?. Journal of Financial Economics 31: 235-268.
Copeland, T.E., and Galai, D. (1983). Information Effect di atas Bid-Ask spread. Journal of Finance 38: 1457-1469.
Chordia, T., Roll, R., and Subrahmanyam, A . (2001). Market Liquidity and Trading Activity. Journal of Finance LV: 501-503.
Chordia, T., Roll, R., and Subrahmanyam, A . (2002). Order Imbalance, Liquidity and Market Returns. Journal of Financial Economics 65: 111-130.
Connolly, R. and Stivers, C. (2003). Momentum and Reversal Equity in Index-Return During Periods of Abnormal Turnover and Return Dispersion. Journal of Finance 58: 1521-1555.
Datar, T., Vinay, Y. N., and Radcliffe, R. (1998). Liquidity and Stock Returns: An Alternative Test. Journal of Financial Markets 1: 203-219.
Daniel, Kent. Hirshleifer, D., and Subrahmanyam, A. (1998). Investor Psychology and Security Market Over- and Under-reactions. Journal of Finance 53: 1839-1886.
Daniel, Kent. Hirshleifer, D., and Subrahmanyam, A. (2001). Overconfidence, Arbritrage and Equilibrium Asset Pricing. Journal of Finance 56: 921-965.
De Bondt, W and Thaler,R. (1985). Does the Stock Market Overreact?. Journal of Finance 40:793-805. Easley, D., and O'Hara, M. (1987). Price, Trade Size and Information in Securities Markets. Journal of
Financial Economics 19: 69-90.
Easley, D., Keifer, N., O'Hara, M., and Paperman, J. (1996). Liquidity, Information, and Infrequently Traded Stocks. Journal of Finance 51: 1405-1436.
Fama, Eugene F. (1991). Efficient Capital Markets II. Journal of Finance XLVI: 1575-1617
Fama, E.F., and French, K.R. (1992). The Cross-section of Expected Stock Returns. Journal of Finance 47: 427-465.
Glosten, L., and Milgrom, P. (1985). Bid, Ask, and Transaction Prices in a Specialist Market with Heterogenously Informed Traders. Journal of Financial Economics 13: 71-100.
Gourieroux, C, Jasiak, J.,Le Fol, G. (1999). Intraday Market Activity. Journal of Financial Markets 2: 193-226.
Grossman, S.J., and Miller, M. (1988). Liquidity and Market structure. Journal of Finance 43: 617-637. Hameed, A., Kang, W., and Viswanathan, S. (2010). Stock Market Declines and Liquidity. Journal of
Finance LXV: 257-292.
Harris, L. (2003). Trading & Exchanges: Market Microstructure for Practioneers. Finanncial Management Association Survey and Synthesis Series, Oxford University Press, USA. Hirshleifer, D. (2001). Investor Psycology and Asset Pricing. Journal of Finance 56: 1533-1596. Ho, T and H. Stoll. (1981). Optimal Dealer Pricing Under Transactions and Return Uncertainty. Journal
of Financial Economics 9: 47-73.
Kofman, P and Moser., J.T. (2001). Stock Margins and the Conditional Probability of Price Reversals, Federal Reserve Bank of of Chicago. The Economic Perpectives 3Q: 2-12.
Kyle, A. (1985). Continous Auction and Insider Trading. Econometrica 53: 1315-1335.
Lin, Shin-Juh, Knight, J., and S.E. Satchell, S.E. (1999). Modelling Intra-day Equity Prices and Volatility Using Information Arrivals- A Comparative Study of Different Choices of Informational Proxies: 27-64 in Pierre Lequeuxes (ed) Financial Markets Tick-by-Tick, John Willey & Sons Ltd. Ludwig, H., Ringbeck, J., and Schulte-Bockum, J. (2000). Managing Expectation for Value. The
McKinsey Quarterly 4: 12-14.
Lo, A, and MacKinlay, A.C. (1988). Stock Market Price Do Not Follow Random Walks: Evidence from a Simple Specification Test. Review of Financial Studies 1: 41-46.
Lo, A, and MacKinlay, A.C. (1990). An Econometric Analysis of Non-Synchronous Trading. Journal of Econometrics, 45: 181-212.
O'Hara, Maureen. (2005). Market Microstructure Theory. Blackwell Publishing, USA.
Sembel,R.,Hutagaol,Y., and Santosa, P.W. (2009). Capital Market Trends 2008/2009: Long-term Perfomance Analysis 82 Publicly Listed Non Financials Companies at IDX, Research Bundle, CAPITAL PRICE, Jakarta.
Stoll, H and Whaley, R.E. (1990). Stock Market Structure and Volatility. Review of Financial Studies 3: 37-52.
Summers, L. H. (1986). Does the Stock Market rationally reflect Fundamental Values?. Journal of Finance 41: 591-601.
Walsh, D. M. (1997). Price reaction to order flow 'news' in Australian equities. Pacific-Basin Finance Journal 5: 1-23.
Zhang, X. F. (2006). Information Uncertainty and Stock Returns. Journal of Finance 61: 105-137. Zhang, X. F. (2005). Information Uncertainty and Analyst Forecast Behavior, Contemporary Accounting