See discussions, stats, and author profiles for this publication at: https://www.researchgate.net/publication/222829749
Price-setting Behaviour, Competition, and
Markup Shocks in the New Keynesian Model
Article in Economics Letters · June 2005 DOI: 10.1016/j.econlet.2004.12.012 · Source: RePEc
CITATIONS
20
READS
36
1 author:
Some of the authors of this publication are also working on these related projects:
Monetary News ShocksView project
Business CyclesView project Hashmat Khan
Carleton University
32 PUBLICATIONS 376 CITATIONS
SEE PROFILE
Price-setting behaviour, competition, and mark-up shocks in the New
Keynesian model
Hashmat Khan
Working Paper no. 240
Structural Economic Analysis Division, Bank of England, Threadneedle Street, London, EC2R 8AH. [email protected], tel: +44 (0) 20 7601 3931,
fax: +44 (0) 20 7601 5018.
I would like to thank, without implication, Bergljot Barkbu, Jean Boivin, Rebecca Driver, Edith Gagnon, Charlotta Groth, Thomas Lubik, Katharine Neiss, Lars Svensson and anonymous referees of the Bank of England working paper series for helpful comments. The views in this paper are my own and should not be interpreted as those of the Bank of England.
Copies of working papers may be obtained from Publications Group, Bank of England, Threadneedle Street, London, EC2R 8AH; telephone 020 7601 4030, fax 020 7601 3298, e-mail [email protected].
Working papers are also available at www.bankofengland.co.uk/wp/index.html.
The Bank of England’s working paper series is externally refereed.
c
Contents
Abstract 5
Summary 7
1 Introduction 9
2 The New Keynesian model 13
3 Effects of mark-up shocks 17
4 Interpreting changes in the slope of the NKPC 19
5 Conclusion 20
Appendix A: Derivation of the NKPC under theR model 22
Appendix B: Variables and data sources 24
Abstract
Recent research and policy discussions have noted that the potentially increased
competition among firms since the 1990s may affect inflation and economic activity. This paper considers the implications of this structural change on short-run inflation dynamics, and for assessing shocks to inflation and output. The importance of firms’ price-setting behaviour is highlighted in this context using a standard New Keynesian model with microfoundations. It is well known that both Rotemberg and Calvo price-setting assumptions imply the same reduced-form New Keynesian Phillips Curve (NKPC). Increased competition among firms, however, increases price flexibility in the former, and has either no effect or decreases price flexibility in the latter. The effects of mark-up shocks on inflation and output are small when firms’ price-setting behaviour incorporates concerns about potential loss of market share. These effects are further dampened in an environment of more intense competition. Under the assumption of increased competition, both models lead to unambiguous predictions about the direction of change in the slope of the Phillips curve. Rolling estimates of the NKPC indicate that the slope has declined or flattened for several countries since the 1990s. This evidence is consistent with the prediction of the Calvo model.
Key words: Competition, price-setting, inflation.
Summary
Recent research and policy discussions have noted that the potentially increased competition among firms since the 1990s may affect inflation and economic activity. Deregulation, globalisation and reduction in trade barriers are often discussed as drivers underlying this structural change. Although direct evidence on increased competition is not available, some indirect measures do corroborate the view that competition among firms may have become more intense since the 1990s.
While there is broad agreement that an increase in the degree of competition among firms should put downward pressure on the price level, its implications for inflation dynamics and the assessment of shocks are unclear. For example, a one-off or steady-state increase in the degree of competition may mean that firms adjust their prices more often. This would amplify short-run inflationary pressures. On the other hand, it may mean that firms stand to lose market share and are therefore less willing to adjust their relative prices; this would dampen inflationary pressures.
The paper uses the standard New Keynesian framework, based on optimising behaviour of monopolistically competitive firms which face constraints on nominal price adjustments. In this framework, the elasticity of substitution between goods captures the degree of competition among firms. A rise in this elasticity implies that goods in the economy are relatively closer substitutes for each other, indicating more intense competition between firms.
This paper considers two specific price-setting assumptions: quadratic costs of nominal price adjustments and probabilistic price adjustment. Both are commonly used in small structural monetary policy models and have the same reduced-form Phillips curve specification. Under the former, however, increased competition among firms
unambigously increases price flexibility. Under the latter, increased competition either has no effect or decreases price flexibility. Price flexibility unambigously decreases in the latter model when real rigidities in the goods and labour markets are considered. The paper finds that ‘cost-push’ or mark-up shocks to inflation are substantially dampened under the probabilistic price adjustment model with real rigidities, relative to the quadratic cost of adjustment model.
1 Introduction
Recent research and policy discussions have noted that potentially increased competition among firms since the 1990s in several countries may have effects on inflation and economic activity.(1) Deregulation, globalisation, reduction in trade barriers are often discussed as underlying drivers behind this structural change in several countries. Direct evidence on increased competition is, however, difficult to obtain. But there are indirect measures which corroborate the view that competition among firms may have increased since the 1990s. In the United Kingdom, for example, the ratio of nominal imports to nominal GDP (at market prices) - the import penetration ratio - averaged for each decade has increased steadily over the past decades (See Table 1).(2)
Table 1
Average import penetration ratio for the United Kingdom
1960s 1970s 1980s 1990s 2000s
20.1 26.1 26.3 27.5 29.0
For the United States, Duca and VanHoose (2000) document that the aggregate price elasticity index which indicates the degree of overall competition in the US economy -has risen since the 1980s.
Understanding the implications of potentially increased competition among firms is relevant to monetary policy and inflation dynamics. In a recent speech, for example, Rachel Lomax, the Deputy Governor of the Bank of England, mentioned
‘To the extent that a fierce competitive struggle is squeezing retail margins, it is likely to affect the short-run outlook for inflation.’
Bank of England Quarterly Bulletin, Spring 2004, pages 77-82.
(1) Rogoff (2003) has emphasised that increased competition among firms may explain declines in average
or long-term inflation witnessed across the globe. Along similar lines, Bayoumi, Laxton and Pasenti (2003) estimate large benefits and spillovers of greater competition on standard measures of economic activity.
(2) Wadhwani (2000) interprets the increasing import penetration over the late 1990s as prima facie
Higher competition among firms is generally seen to put downward pressure on the price level. But in the presence of frictions on nominal price adjustments, the implications for short-run dynamics of inflation are unclear. Furthermore, the response of inflation and output to shocks may depend on the prevailing competitive environment. This paper uses the standard New Keynesian framework based on optimising behaviour of
monopolistically competitive firms which face constraints on nominal price adjustments to examine these issues. It shows that assumptions about firms’ price-setting behaviour in the face of a structural change in competition determines the consequences for inflation
dynamics and assessment of ‘cost-push’ or mark-up shocks.
In the New Keynesian framework, the Dixit and Stiglitz (1977) elasticity of demand captures the degree of substitutability between goods. This elasticity is inversely related to the desired mark-up over cost that firms want to charge for their product. A higher
substitutability between goods implies a higher level of competition among firms and a lower desired mark-up (a reduction in firms’ pricing power). A structural increase in competition among firms corresponds to a one-off increase in the elasticity.(3)
We consider two ways of modelling price-setting behaviour that are commonly used as microfoundations for the New Keynesian Phillips Curve (NKPC) within this framework. Both models are convenient ways to describe firms’ pricing behaviour in the goods market. First, the Rotemberg (1982) ‘quadratic price adjustment cost’ model (theRmodel) in which firms compare the profit loss from letting the desired nominal price move away from actual price with the cost of price adjustment. They choose the price in a way that minimises the two costs. Second, the Calvo (1983) ‘random price adjustment signal’ model (theC model) in which a firm adjusts its price only when it receives an adjustment signal. Such occasions for a firm are assumed to occur at random time intervals.
As shown by Rotemberg (1987) and Roberts (1995), the reducedform inflation dynamics -the NKPC - implied by both -theRand theCmodels are observationally equivalent. They are the only two models which give this particular reduced form.(4) But a change in the degree of competition affects the coefficients of the Phillips curve in different ways. Consequently, implications for the slope of the Phillips curve and the impact of shocks differ across the two models.
(3) It is, however, useful to view a change in the elasticity more broadly as representing other aspects of
market structure such as increase in the number of firms and increase in foreign competition.
(4) The Taylor (1980) fixed contract duration model implies a somewhat different Phillips curve than the
Higher competition in theRmodel increases the slope of the Phillips curve. The reason is that in the presence of quadratic adjustment costs, each firm’s pricing decision involves minimising profit loss from not charging the desired price today and in the future. As the elasticity of demand increases and the economy moves closer to perfect competition, not only does the level of desired mark-up fall but also changing prices become relatively cheaper. The latter occurs because the size of optimal price adjustment falls. This effect promotes price flexibility in theRmodel and increases the slope of the Phillips curve.
In theC model, however, higher competition has either no effect or can decrease the slope of the Phillips curve. So inflationary pressures either remain benign or get dampened. The reason is that, unlike theRmodel, relative prices can differ across firms. This implies that a firm’s marginal cost may depend not only on the average level of output but also its own output (hence its own relative price). When adjusting prices a firm may not want a large difference in its price relative to the average price so as not to lose market share. This concern for potential market share loss means that relative prices can be rigid or ‘real rigidity’ can prevail in the goods market as explained by Ball and Romer (1990) and Kimball (1995). Market share loss is large when the elasticity of substitution between goods is high, that is, when the degree of competition among firms is high. A higher competition implies greater real rigidity and amplifies inertia in price adjustments. This effect decreases the slope of the Phillips curve. When real rigidity does not prevail, higher competition does not affect the slope. We follow Woodford (2003) and use the
terminology ‘strategic complementarity’ and ‘strategic substitutability’ in firms’ pricing decisions to indicate if real rigidity is present or not, respectively.
While it is useful to consider a one-off change in the degree of competition to examine the effects on the slope of the Phillips curve, competition may evolve over time. Using theR model, Ireland (2004) estimates that shocks to competition, or ‘mark-up shocks’ are important, relative to technology shocks, in explaining fluctuations in output and inflation in the US data. In view of this finding, we consider how the assumed nature of firms’ price-setting behaviour affects the assessment of mark-up shocks in the New Keynesian model. We assume that monetary policy is implemented via an interest rate rule and consider standard calibration of parameters from the literature.
We find that higher competition reduces the impact effects of mark-up shocks on inflation and output for both theR and theC models. The actual magnitude, however, differs
It is a common practice to calibrate the cost of adjustment parameter in theR model by equating the slope of the Phillips curves in theR and theC models. This procedure provides an economic interpretation to the cost of adjustment parameter in terms of the average duration of price stickiness. Moreover, it also means that the effect of shocks in a calibrated model will be identical across the two models. Since higher competition affects the slope differently in the two models, a mechanical re-calibration of the the cost of price adjustment in theRmodel has pitfalls. First, a mechanical calibration would imply that the cost of nominal price stickiness in theRmodel increase without any corresponding change frequency of price adjustment in theC model. In other words, one needs to assume that the costs associated with adjustment in nominal price must rise when the degree of
competition among firms is higher to make theR model equivalent to theCmodel. Second, the calibration of the cost of adjustment parameter in theRmodel may imply quantitatively implausible magnitudes of price stickiness. This aspect echoes the concern highlighted by Danthine and Donaldson (2002) that in the New Keynesian model, cost of price adjustment may turn out to be implausibly higher than that of adjusting the capital stock.
To highlight the effects of strategic complementarity alone, we contrast the impact effects under theC model with and without strategic complementarity. Under the former, the impact effects are approximately twelve times smaller. This suggests that the assumptions made in the New Keynesian model regarding the structure of labour and capital markets affect the assessment of shocks in an important manner.
In the face of higher competition among firms, both theRand theCmodels have different predictions about the direction of change in the slope of the Phillips curve. TheR model predicts unambiguously that the slope should increase. TheC model predicts
unambiguously that the slope should not increase. Given these predictions, we examine rolling estimates of the slope of the NKPC curve for the United Kingdom, United States, Canada, and the euro area. These estimates indicate that the slope has, in general, declined or flattened since the 1990s. This evidence is consistent with the prediction of theC
model. It is also consistent with the findings of Duca and VanHoose (2000), who use a traditional Phillips curve analysis and find that increased competition has flattened the slope of the Phillips curve in the United States during the 1990s.
The rest of the paper is organised as follows. Section 2 presents a brief description of the New Keynesian model and the price-setting assumptions. Section 3 discusses the
mark-up shocks. Section 5 presents rolling estimates of the slope of the NKPC. Finally, Section 6 concludes.
2 The New Keynesian model
Consider an economy with a representative household at timetthat maximises a discounted sum of expected utilities:
Et
subject to the standard budget constraint (see, for example, Woodford (2003)). The parameterβ is the subjective discount factor,Ct = [R01Ct(i)(θ−1)/θdi]θ/(θ−1) is the
Dixit-Stiglitz constant-elasticity-of-substitution consumption index,Ct(i)represents
consumption of theith good,Ht(i)is the supply of type-ilabour to the production of good
of varietyi,σ >0is the intertemporal elasticity of substitution of aggregate expenditure,φ is the disutility of labour. For our purpose, the relevant utility-maximising condition is the intratemporal condition of the choice of labour supply of typei:
Wt(i)
On the supply side, firms operate in a monopolistically competitive market and are uniformly distributed on the interval[0,1]. Each firmifaces a demand curve,Yt(i),
good, andθt is the time-varying elasticity of demand for firmithat fluctuates around its
steady-state levelθ. Firmiproduces output using a technology
Yt(i) = Ht(i)a, 0< a≤1 (4)
whereHt(i)is the labour input andais the elasticity of output with respect to labour. We
2.1 The Rotemberg (R) model: quadratic cost of nominal price adjustment
Following Rotemberg (1982), each firm faces a quadratic cost of nominal price adjustment, measured in terms of the final good and given by
c
wherec≥0determines the magnitude of the price adjustment cost andπ ≥1is the gross steady-state inflation rate. Given (3), (4), (5), and wages in the labour market, a firm chooses a sequence forPt(i)to maximise the expected sum of future discounted profits.
Et
t is the stochastic discount factor. In a symmetric equilibrium the
optimal priceP∗
represents the net cost associated with price adjustment. When there is no price stickiness (c= 0), the mark-up is the same as the desired mark-up,θt/(θt−1).
2.2 The Calvo (C) model: random price adjustment signal
in (4). Strategic complementarity implies that a firm has more incentive to increase its price when other firms increase theirs. In contrast, under common factor markets ‘strategic substitutability’ in pricing decisions prevails which implies that a firm has less incentive to lower its price when other firms lower theirs.
A firm chooses its pricePt(i)to maximise current and discounted future (real) profits:
Et
t is the optimal price charged by firms who receive the price adjustment signal
(see Yun (1996)). The aggregate price level under the Calvo model evolves according to
Pt =
2.3 The Phillips curve specifications
To get the NKPC for theR model, we substitute outWt/Pt using (2) and (4) in (8).
Log-linearising the resulting equation and the (A-3) around the zero-inflation (πt =π= 1),
flexible price equilibrium with a constant degree of competition among firms,θt=θ.
Defineyt= log(Yt/Ye),ytn = log(Ytn/Ye)(whereYe is the flexible price, efficient steady
state of the economy),πt = log(πt/π), andθˆt= log(θt/θ).(5) The details for the derivation
of the NKPC in theC model are now common and presented elsewhere (see, for example, Woodford (2003)).
The reduced-form NKPC specifications for both theRand theC (bothCss andCsccases) models can be written the same way but they are not identical:
πt =βEtπt+1+λi(yt−ytn)−γiθˆt, i=R, C (12)
According to (12), inflation in both models is determined by current expectations of next period’s inflation, the output gap, and aθˆtterm. This latter term can be interpreted as a
‘cost-push’ shock to inflation, as in Clarida, Gal´ı and Gertler (1999), or a mark-up shock, as in Steinsson (2003) (we follow the ‘mark-up shock’ terminology here). The coefficients on the output gap and mark-up shock, however, depend on the specific price-setting
behaviour assumptions of theR and theC models, and in the latter case, strategic complementarity or substitutability in firms’ pricing decisions.
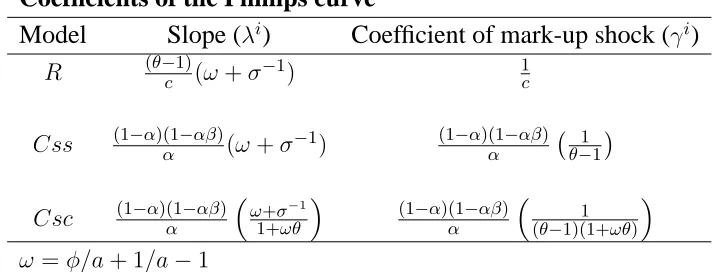
Table 2 shows the coefficients for the different cases.
Table 2
Coefficients of the Phillips curve
Model Slope (λi) Coefficient of mark-up shock (γi)
R (θ−c1)(ω+σ−1
) 1c
Css (1−α)(1α−αβ)(ω+σ−1
) (1−α)(1α−αβ) ¡ 1 θ−1
¢
Csc (1−α)(1α−αβ)³ω+σ−1
1+ωθ
´ (1−α)(1−αβ)
α
³
1 (θ−1)(1+ωθ)
´
ω =φ/a+ 1/a−1
2.4 Competition and the slope of the NKPC
The steady-state elasticity of demand for a firm,θ, captures the degree of substitutability between its good and those of its competitors. This elasticity is inversely related to the desired mark-up over cost that firms want to charge for their good. A higher substitutability between goods implies a higher degree of competition among firms, and a lower desired mark-up (a reduction in firms’ pricing power). A structural increase in competition among firms is interpreted in terms of a one-off increase in the (steady-state) elasticity.(6)
In theR model, higher competition among firms increases the slope of the Phillips curve and tends to magnify inflationary pressures (see Table 1). The intuition for this result is as follows. From (8), higher competition not only reduces the level of desired mark-up but also makes changing prices relatively cheaper (the second term in the denominator). For a given magnitude of the price adjustment cost,c, a higherθ lowers the net cost associated with adjusting prices. This occurs because as the elasticity of demand increases and the economy moves closer to perfect competition, the size of optimal price adjustment falls
(6) Note that the inflationary pressures, captured by the output gap (in log-linearised terms), do not change
which makes price adjustments relatively cheaper for a firm when facing quadratic adjustment cost. This effect promotes price flexibility in theR model and increases the slope of the Phillips curve.
In theC model, by contrast, higher competition can either decrease or have no effect on the slope of the Phillips curve (see Table 1). So inflationary pressures captured by the output gap either get dampened or remain benign. Unlike theRmodel, relative prices can differ across firms due to price staggering. If factor markets are segmented (that is, there is strategic complementarity), a firm’s marginal cost depends both on average output and its own output (hence its own relative price). When adjusting the price, a firm therefore does not want a large difference in its price relative to the average, to avoid loss of market share. Higher competition among firms implies greater strategic complementarity and therefore lower price flexibility. Consequently, the slope of the NKPC decreases. Under strategic substitutability, the degree of competition among firms does not affect the slope.
3 Effects of mark-up shocks
In this section we examine the effects on inflation and output of mark-up shocks. Recently, Ireland (2004) has emphasised the quantitative importance of such shocks within a New Keynesian framework using theRmodel.
3.1 General equilibrium
This section computes the general equilibrium solution to the New Keynesian model. We assume that the aggregate demand side is characterised by a forward-looking IS curve
yt=Etyt+1−σ−1(rt−Etπt+1) (13)
wherertis the short-term nominal interest rate. We close the model with a simple
monetary policy rule, in our case, a Taylor rule (Taylor (1993))(7)
rt =φππt+φyyt+ ˆǫrt (14)
whereˆǫrt is a monetary policy shock. We solve the system of equations (12), (13), and (14) using the procedure described in Sims (2002) and further generalised by Lubik and
Schorfheide (2002). To highlight the main point we consider only white noise mark-up
(7) As advocated by Svensson (1999) an alternative to assuming a Taylor rule is to specify the central
bank’s loss function and characterise optimal monetary policy. Rotemberg and Woodford (1997) provide a utility-based microfoundation for a loss function that is defined over the squared deviation of inflation and output from their respective target levels and when firms’ price-setting behaviour under theCmodel. It is,
however, not possible to provide a microfoundation for this loss function in the case of theRmodel as
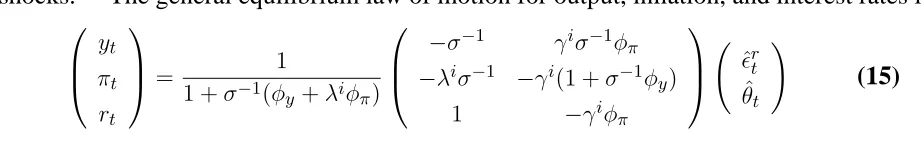
shock. The analysis can be easily extended to include exogenous persistence and other shocks.(8) The general equilibrium law of motion for output, inflation, and interest rates is
3.2 More intense competition and effects
In (15), whenφπ = 1.5,φy = 0.5(as in Taylor (1993)), andσ= 1 (log-utility), we can write
the effects on inflation and output in terms of the coefficients in the NKPC in Table 2 as πt = −γ
i
1+λi,yt =
γi
1+λi. Table 3 shows how the degree of competition among firms influences
these effects.
Table 3
Impact effects of a 1% mark-up shock on inflation and output
Variable R Css Csc
3.3 Effect of strategic complementarity
Higher competition reduces the effect of a mark-up shock for both theR and theCmodels. When price staggering exists, as in theCmodel, the effect on inflation and output is
[1 +ωθ/(1 +κ(ω+ 1))]−1 times smaller under strategic complementarity relative to strategic substitutability. For standard calibration of parameters in the literatureβ = 0.99, α= 0.75(price changes on average every four quarters),θ = 10(desired mark-up of 10%, ω= 1.25(see Woodford (2003)) the effect of mark-up shocks under strategic
complementarity is approximately twelve times smaller than that under strategic substitutability.
(8) Khan and Moessner (2004) consider the interaction of competitiveness and positive steady-state
3.4 A comparison of the RandCscmodels
Next, we contrast the impact effects across theRand theCscmodels of price-setting behaviour. Consider a low competition environment where firms have a 25% desired mark-up (θ= 5). We calibrate the parameter as
c= (θ−1)(1 +ωθ)κ−1
= 337.86
in theRmodel so that the coefficients of the Phillips curve are identical. Consider a structural change in the economy such that there is a one-off increase in degree of competition among firm. This change is represented by a lower desired mark-up of 10% (θ = 10). The impact effect of a 1% mark-up shock on inflation and output is four times smaller in theCscmodel relative to theRmodel.
3.5 Pitfalls of mechanical calibration
With a higher level of competition,θ= 10, a mechanical re-calibration ofc= 1415.5would give equivalent results across the two models. But it has two pitfalls. First, it is unclear why the cost of nominal price adjustment must increase when the average duration (in the Cmodel) remains fixed at four quarters. Second, mechanical calibration may imply that the cost of adjusting nominal prices in theRmodel are implausibly large. This aspect echoes the concern highlighted by Danthine and Donaldson (2002) that in the New Keynesian model with costly capital accumulation, the cost of price adjustment may turn out to be implausibly higher than that of adjusting the capital stock.
4 Interpreting changes in the slope of the NKPC
In the face of higher competition among firms, both theRand theCmodels have different predictions about the direction of change in the slope of the Phillips curve. TheR model predicts unambiguously that the slope should increase. TheC model predicts
unambiguously that the slope should not increase. In this section we present rolling estimates (with increasing observations) based on the ‘hybrid-NKPC’ (ie NKPC with one lag of inflation) proposed by Gal´ı and Gertler (1999).(9) This assumes a fraction of firms to use ‘rule-of-thumb’ pricing when they get an opportunity to change their price. The
hybrid-NKPC specification also resembles another formulation proposed by Christiano, Eichenbaum and Evans (2001) and Woodford (2003) where firms index their prices to past inflation in between periods of reoptimisations. Both extensions imply a similar reduced form and are extensively used in theoretical and empirical literature, although the details of
(9) See Rudd and Whelan (2002) and Gal´ı, Gertler and L´opez-Salido (2003) for the debate on the
the reduced-form coefficients are different. Importantly, the coefficient on the lagged inflation term under either formulation does not depend onθ. Thus, a change in competition does not directly influence the degree of persistence in inflation.(10)
We estimate the following hybrid NKPC for the United Kingdom (1972 Q1-2001 Q4), the United States (1970 Q1-2003 Q4), Canada (1970 Q1-2001 Q4), euro area (1970 Q1-1998 Q4), using GMM.(11)
πt=γfEtπt+1+γbπt−1+λrmc
avg
t (16)
wherermcavgt is the (average) real marginal cost. We use the labour share proxy as a
measure of real marginal cost that is based on the assumption of Cobb-Douglas technology as in Sbordone (2002).(12) The rolling estimates of the hybrid model remain quantitatively similar when the labour share is modified under the assumption of alternative production technologies (see Gagnon and Khan (2004)). The estimates presented in Charts 2-5 indicate that the slope has declined and flattened over the 1990s for the United Kingdom, the United States, Canada, and the euro area, although there are wide confidence
intervals.(13) If the level of competition among firms has indeed increased, then this evidence is consistent with the prediction of theCmodel.
Clearly, the low-inflation environment since the 1990s may have contributed to the flattening of the Phillips curve by increasing the length of nominal contracts. This would be captured by larger values ofαandcin theCand theRmodels, respectively. It is important to note, however, that according to theCmodel, an increase in competition would reinforce the flattening or the decline of the slope due to the move to the low-inflation environment since the 1990s. According to theRmodel, an increase in competition would offset the decline in the slope.(14)
5 Conclusion
We examined the implications of a higher level of competition on short-run inflation dynamics using the New Keynesian framework. As often emphasised, the two commonly used price-setting assumptions based on Rotemberg (1982) and Calvo (1983) imply the
(10) Although persistence in inflation will be influenced by the degree of competition if we consider the
complete system of equations for the hybrid model.
(11) The appendix gives details of the data and instrument set used in the estimation.
(12) Under this approach, effects of supply shocks such as exogenous changes in total factor productivity
and oil prices are captured in the measure of real marginal cost.
(13) Similar evidence for the United Kingdom is presented in Balakrishnan and L´opez-Salido (2002). (14) An alternative way to examine the prediction of the two models could be in a cross-country setting in
same reduced-form inflation dynamics. However, the implications of a change in the degree of competition among firms are quite different across the two models. Higher competition in competition unambiguously increases price flexibility in the former while it may decrease price flexibility in the latter. The impact of mark-up shocks on inflation and output are small when firms’ price-setting behaviour incorporates concerns of potential market share loss. These effects get further dampened in a higher competition
environment.
In the face of increased competition, both models have unambiguous macroeconomic predictions about the direction of change in the slope of the Phillips curve. Evidence from rolling estimates of the slope of the NKPC indicate that the slope has declined or flattened in the 1990s for several countries. Under the assumption of increased competition in the 1990s, this evidence is consistent with the prediction of the Calvo model.
Appendix A: Derivation of the NKPC under theR model
A firm chooses a sequence forPt(i)to maximise the expected sum of future discounted
profits.
t is the stochastic discount factor.
The first-order condition is
In a symmetric equilibrium the optimal priceP∗
t(i)is the same for all firms,P
whereπt =Pt/Pt−1 is the gross inflation rate. The first-order condition for (A-1) can be
written as
When there is no price stickiness (c= 0), from (A-4), firms charge a mark-up over current marginal cost
In the flexible-price equilibrium (c= 0), the equilibrium output,Ytn, is given by
1 = θt
and the aggregate resource constraint is
The efficient level of output,Yte, in the absence of technology or preference shocks is
Yte = 1 (A-9)
The log-linearised aggregate resource constraint (A-3) is
yt =ct (A-10)
Next, (i) substituting outWt/Pt, using (2) and (4) under the symmetric equilibirium, from (A-4), (ii) log-linearising the resulting equation around the flexible-price equilibrium with constantθ, and (iii) using (A-10) we get
πt=βEtπt+1+ θ−1
Following Sims (2002), the model equations are written in the canonical form as
Γ0Yt = Γ1Yt−1+ Ψǫt+ Πηt (A-12)
As in Lubik and Schorfheide (2002), we use (14) to eliminatert in (13) and reduce the
system to two equations. Defineξty =Etyt+1andξtπ =Etπt+1with the corresponding
The dynamics of the system depend on the eigenvalues of the matrixΓ−1
0 Γ1. If both
eigenvalues are greater than one (in absolute value) then the equilibrium is uniquely determined. This stable solution isξt = 0∀t which uniquely determines the endogenous
forecast errors according to
Appendix B: Variables and data sources
Under the assumption of Cobb-Douglas technology, the labour share (St = WPttNYtt ) is a
theoretically appropriate observable proxy for (average) real marginal cost whereWtNt is
labour compensation in the national accounts andPtYtis nominal output. In (16),
rmcavgt = 100∗log(St/S)where Sis the sample mean.
The data sources and the mnemonics for the individual data series are as follows: UK (Bank of England and Batini, Jackson and Nickell (2002)), US (NIGEM - Bank of England), Canada (Bank of Canada and Statistics Canada), and euro area (Fagan, Henry and Mestre (2001)).
Variable UK Canada US Euro area
Pt P GDP D15612 U SP Y Y ED
Yt GDP I56001−I56013−I56018 U SY Y ER
Nt (E+SE)∗ LF SA201: 1970:1-1975:4 U SE∗U SH OU RS LN N D980595: 1976:1-2001:4
Wt W D17023
Nt
U SCOM P Nt
W I N Nt
St GDPAW ∗ D17023D15612−D17001
∗Yt
U SCOM P U SN OM
W I N Y EN
* Source: Batini et al (2002).
UK: 1972 Q1 to 2001 Q4: Employed plus self employed =(E+SE), compensation of
employeesW, labour share adjusted for self-employed workers = GDPAW ∗.
Canada: 1970 Q1 to 2001 Q4: Total labour income =D17023, farm (agriculture +
fishing&trapping) labour income =D17001, total GDP deflator =D15612, total real GDP =I56001, farm GDP =I56013(agriculture) +I56018(fishing & trapping), employment, ‘total employed persons’ = [LF SA201 (1970 Q1 to 1975 Q4) andD980595(1976 Q1 to 2001 Q4)].
United States: 1970 Q1 to 2003 Q4: Nominal output =U SN OM, real output = GDP,
GDP deflator =U SP Y, employee hours =U SE∗U SHOU RS, compensation =U SCOM P.
Euro area: 1970 Q1 to 1998 Q4: Total compensation =W IN, nominal GDP =Y EN,
INSTRUMENT SET:
Chart 1: United Kingdom
Estimate of the slope of the hybrid NKPC: U.K.
With upper and lower confidence intervals
1987 1989 1991 1993 1995 1997 1999 2001
-0.05 0.00 0.05 0.10 0.15 0.20 0.25 0.30
Slope Lower Upper
Chart 2: Canada
Estimate of the slope of the hybrid NKPC: Canada
With upper and lower confidence intervals
1970 1973 1976 1979 1982 1985 1988 1991 1994 1997 2000
-0.075 -0.050 -0.025 0.000 0.025 0.050 0.075 0.100
Chart 3: United States
Estimate of the slope of the hybrid NKPC: U.S.
With upper and lower confidence intervals
1985 1987 1989 1991 1993 1995 1997 1999 2001 2003
0.00 0.08 0.16 0.24 0.32 0.40 0.48 0.56
Slope Lower Upper
Chart 4: Euro area
Estimate of the slope of the hybrid NKPC: Euro area
With upper and lower confidence intervals
1970 1973 1976 1979 1982 1985 1988 1991 1994 1997
-0.006 0.000 0.006 0.012 0.018 0.024 0.030 0.036 0.042
References
Balakrishnan, R and L´opez-Salido, J D (2002), ‘Understanding UK inflation: the role of openness’, Bank of England Working Paper no. 164.
Ball, L, Mankiw, N and Romer, D (1988), ‘The New Keynesian economics and the output-inflation trade-off’, Brookings Papers on Economic Activity, Vol. 1, pages 1–65.
Ball, L and Romer, D (1990), ‘Real rigidities and the non-neutrality of money’, Review of Economic Studies, Vol. 57, pages 183–203.
Batini, N, Jackson, B and Nickell, S (2002), ‘Inflation dynamics and the labour share in the UK’, Bank of England External MPC Unit Discussion Paper no. 2.
Bayoumi, T, Laxton, D and Pasenti, P (2003), ‘When leaner isn’t meaner: measuring benefits and spillovers of greater competition in Europe’, IMF and FRB New York, manuscript.
Calvo, G (1983), ‘Staggered prices in a utility-maximizing framework’, Journal of Monetary Economics, Vol. 12, pages 383–98.
Christiano, L, Eichenbaum, M and Evans, C (2001), ‘Nominal rigidity and the dynamic effects of a shock to monetary policy’, NBER Working Paper no. 8403.
Clarida, R, Gal´ı, J and Gertler, M (1999), ‘The science of monetary policy: a new Keynesian perspective’, Journal of Economic Literature, Vol. 37, pages 1,661–707.
Danthine, J and Donaldson, J (2002), ‘A note on NNS model: introducing physical capital-avoiding rationing’, Economic Letters, pages 433–37.
Dixit, A and Stiglitz, J (1977), ‘Monopolistic competition and optimum product diversity’, American Economic Review, Vol. 67, pages 297–308.
Duca, J and VanHoose, D (2000), ‘Has greater competition restrained U.S. inflation?’, Southern Economic Journal, pages 729–41.
Fagan, G, Henry, J and Mestre, R (2001), ‘An area-wide model (AWM) for the euro area’, European Central Bank Working Paper no. 42.
Gagnon, E and Khan, H (2004), ‘New Phillips curve with alternative production technologies for Canada, the United States, and the euro area’, European Economic Review, forthcoming.
Gal´ı, J, Gertler, M and L´opez-Salido, J (2003), ‘Robustness of the estimates of the hybrid New Keynesian Phillips curve’, University of Pombeu Fabra, manuscript.
Ireland, P (2004), ‘Technology shocks in the New Keynesian model’, NBER Working Paper no. 10309.
Khan, H and Moessner, R (2004), ‘Competitiveness, inflation, and monetary policy’, Bank of England, manuscript.
Kimball, M (1995), ‘The quantitative analytics of the basic neomonetarist model’, Journal of Money, Credit, and Banking, Vol. 27, pages 1,241–77.
Lubik, T and Schorfheide, F (2002), ‘Computing sunspot equilibria in linear rational expectations models’, Journal of Economic Dynamics and Control, Vol. 28, pages 273–85.
Roberts, J (1995), ‘New Keynesian economics and the Phillips curve’, Journal of Money, Credit, and Banking, Vol. 27, pages 975–84.
Rogoff, K (2003), ‘Globalization and global disinflation’, International Monetary Fund, manuscript.
Rotemberg, J (1982), ‘Monopolistic price adjustment and aggregate output’, Review of Economic Studies, Vol. XLIX, pages 517–31.
Rotemberg, J (1987), ‘The New Keynesian microfoundations’, NBER Macroeconomics Annual, pages 63–129.
Rotemberg, J and Woodford, M (1997), ‘An optimization-based econometric framework for the evaluation of monetary policy’, NBER Macroeconomics Annual, pages 297–346.
Rudd, J and Whelan, K (2002), ‘New tests of the new Keynesian Phillips curve’, Federal Reserve Board Discussion Paper no. 2001-30.
Sbordone, A (2002), ‘Prices and unit labor costs: a new test of price stickiness’, Journal of Monetary Economics, Vol. 49, pages 265–92.
Sims, C (2002), ‘Solving linear rational expectations models’, Computational Economics, Vol. 20, pages 1–20.
Steinsson, J (2003), ‘Optimal monetary policy in an economy with inflation persistence’, Journal of Monetary Economics, Vol. 50, pages 1,425–56.
Svensson, L E O (1999), ‘Inflation targeting as a monetary rule’, Journal of Monetary Economics, Vol. 43, pages 604–54.
Taylor, J (1993), ‘Discretion versus policy rules in practice’, Carnegie-Rochester Conference Series on Public Policy, Vol. 39, pages 195–214.
Wadhwani, S (2000), ‘Monetary challenges in a new economy’, Bank of England, Speech at the HSBC Global Investment Seminar (October 2000).
Woodford, M (2003), Interest and prices: foundations of a theory of monetary policy, Princeton University Press, Princeton.
Yun, T (1996), ‘Nominal price rigidity, money supply endogeneity, and business cycles’, Journal of Monetary Economics, Vol. 37, pages 345–70.