ISSN 2085-8272 (print), ISSN 2338-5847 (online) http://journal.ugm.ac.id/jieb
THE NEW ERA OF FINANCIAL INNOVATION:
THE DETERMINANTS OF BITCOIN’S PRICE
Sukmawati Sukamulja
Faculty of Economics, Universitas Atma Jaya Yogyakarta, Indonesia (sukmawatisukamulja@gmail.com)
Cornelia Olivia Sikora
Faculty of Economics, Universitas Atma Jaya Yogyakarta, Indonesia (nellasikora@gmail.com)
ABSTRACT
Financial innovation has entered a new era in which a digitalized system and cryptocurrency have been created. This paper examines the factors that influence the price movement of bitcoin. This is not a legal currency in Indonesia; the Indonesian government has not made any regulations legalizing bitcoin’s use, but it has also not issued any new laws to prohibit the trade in bitcoins and other digital currencies. The demand for, and price growth of, bitcoin are interesting matters to study, especially for Indonesians who still have questions about the progress of bitcoin transactions and the factors that influent them. In Indonesia itself, without any protection from the government, the bitcoin price on December 14, 2017 had already reached more than IDR224.5 million, compare to IDR60 million in October 2017. Bitcoin is the first peer-to-peer currency, and was introduced by Satoshi Nakamoto in 2008. Since its inception, bitcoin has served more than 17 million users, including Indonesians. Bitcoin behaves in a different manner, compared to traditional currencies and the one that affects bitcoin’s price is its attractiveness for investors. The Vector Error Correction Model (VECM) is applied to analyze the short-term and long-term influences. VECM is used in this research because the data is stationary in the first difference and has a cointegration relationship. To make the interpretation clearer, the impulse response function and variance decomposition also are included in this research. The result indicates that the macroeconomic indicator, represented by the Dow Jones Industrial Average (DJIA), the demand for bitcoins and the gold price influence bitcoin’s price fluctuations in the short-run and long-run. Bitcoin’s supply does not influence its price fluctuation in the long-run but does influence it in the short-run. The implication of this research is bitcoin could compete as an alternative investment compared to the capital markets and gold.
Keywords: bitcoin’s price fluctuation, bitcoin’s demand, bitcoin’s supply, cryptocurrency, financial innovation
Journal of Indonesian Economy and Business, Vol. 33, No. 1, 2018 47
INTRODUCTION
Financial innovation has a long history. As long as money and finance still serve human life, financial innovation cannot be stopped. The speed of financial innovation always increases every year, because of the rapid worldwide economic growth, globalization, financial liberalization and deregulation (or in response to government regulations), the development of new legal tools and technology’s progress in the area of Information and Communication Technology (ICT). This paper provides some information about recent financial innovations, especially the one that happened after the financial crisis in 2008. One of the financial innovations after the financial crisis was the rise of the digital currency or, as it is known, cryptocurrency.
Bitcoin is not a currency that is produced, published and supplied by any single government, but it is created by the people that use bitcoins. Some countries already accept bitcoins as a legal method for payment, like the United States of America (USA), the United Kingdom (UK), Canada, Japan, South Korea and Finland. It means that these governments take part in controlling, protecting and managing the circulation of bitcoins. The Government of Japan declared that bitcoin is a legal method of payment, and has the same position and function as the Japanese yen. The application of bitcoin-related laws allows bitcoin trading to come under the supervision of the Anti-Money Laundering (AML) and Know Your Customer (KYC) laws to prevent fraud and any other problems.
Indonesia is one country that is a potential place to trade bitcoins. Bitcoin has been traded by many people in Indonesia, since 2013. This happened because from January until April 2013, there was a crisis in Cyprus. This had started in 2012 in the Republic of Cyprus, and
involved the exposure of Cypriot banks to overleveraged local property companies, the Greek government’s debt crisis, and the downgrading of the Cypriot government’s bond rating. This event made the Republic of Cyprus unable to fund all of the state’s expenses from the international market. This crisis had a bad impact on the Indonesian economy, the value of the rupiah depreciated greatly, and this made many people in Indonesia lose faith in the government, the state banks and also the currency. That is why they started to trade bitcoins, because they are not tied to, or dependent on, government policies or the world’s economic condition.
Journal of Indonesian Economy and Business, Vol. 33, No. 1, 2018 49
Cyber-attacks, another risk comes from cyber-attacks. Some large bitcoin companies and digital currency exchanges that have been hacked prove that cyber-attacks will make the price of bitcoin decrease significantly.
The inception of another digital currency, nowadays there are so many cryptocurrencies that can be found, and the price of bitcoin is getting more and more expensive. If people seek a cheaper cryptocurrency, there is the possibility that those people will buy a different crypto-currency because of its cheaper price. Bitcoin also acts as an investment; it has investment characteristics since its price is volatile and has a tendency to increase, as shown in Figure 1. In Indonesia itself, the price of bitcoin in October 2017 was around IDR60 million, in November 2017 it was IDR100 million, and now on December 14 the price of bitcoin has already reached IDR224,596,402.65 (Bitcoin Price, n.d.). The number of users has also increased significantly. In January 2017 there were around 250,000 users, by November 2017 this had increased to 606,790. Bitcoin Indonesia also accepts company account registrations. It means that not only individuals can trade bitcoin, but also companies in Indonesia. If there are many companies and people trading bitcoin in Indonesia, and then a problem related to bitcoin happens, it will damage the investment world. The Indonesian economy will decrease significantly if the investment world breaks down.
Beside bitcoin’s negative aspects, it also has some benefits such as:
1. Low inflation risk, bitcoin is separated from real economic conditions. Any other currency can lose purchasing power every year because governments keep printing money. The maximum limit for bitcoin is 21 million coins so the users will not experience the
same condition as when they hold more conventional currencies
2. Safe, simple and easy to carry, bitcoin does not have any physical form. When the users want to bring bitcoin to other places or other countries, they do not have to change it with another currency and they only have to bring the device that saves their wallet
3. Untraceable, this is a benefit but also a risk for bitcoin. The benefit is the users do not have to worry about any organization being able to trace the source of the funds they invest. The risk is bitcoin can be used as a medium to commit crime, like money laundering, because governments cannot trace the source of the funds.
The purpose of this research is to provide a clearer understanding about the fluctuations of bitcoin. The macroeconomic factors are as previously stated: The Dow Jones Industrial Average (DJIA), the demand for bitcoin, the limited supply of bitcoins, and the price of gold are examined to see their effect on bitcoin’s price fluctuations. Knowing the factors that influence bitcoin’s price lets people try to precisely predict the effects in the long-run and in the short-run. Hopefully this research will provide a better point of view of bitcoin to some parties, include the Indonesian government, so they can make regulations, and either provide protection for, or prohibit, bitcoin transactions in Indonesia, like in China.
help the investors to recover their finances if they suffer losses.
Based on all the information above, Bitcoin is still a mystery for many people in Indonesia. On one hand it has made interesting progress with its price growth, but on the other hand it is an illegal currency. This research wonders about the role of bitcoin in the future. Will bitcoin will be a legal currency or just one of many investment products? Based on some previous studies, for example Wu, Pandey and DBA (2014), who mention bitcoin’s role as a currency and its efficiency as an investment asset; they conclude that bitcoin is less useful as a currency but it can play an important role in enhancing the efficiency of an investor’s portfolio. Another piece of research conducted by Bergstra and Weijland (2014) said that bitcoin is a Money-Like Informational Commodity (MLIC). Jia (2013) concludes that bitcoin has its major function as a currency, but it is not yet a real currency.
From the research mentioned above, we conduct this research to enrich bitcoin as a commodity or as an investment asset. While we are waiting for the government’s solution to the problem of bitcoin as a legal currency, people can trade bitcoin as an investment commodity with the usual investment risk consequences. As an investment product, bitcoin can compete with other investments, namely the stock exchanges (financial assets) and gold (real asset).
THEORITICAL BACKGROUND
1. Financial Innovation
We know that innovation is the key to growth in a competitive environment. It is like a new business mantra; once you made it then you will experience rapid growth. One of the current trending topics is innovation in the financial industry. Financial innovation is an over-used
term meant to describe any change in the scale, scope and delivery of financial services (Mathews & Thompson, 2008).
According to Merton (1992), recent financial innovations came about, in part, because of a wide array of new security designs, advances in computer and telecommunications technology, and because of important advances in the theory of finance. Other factors that affect financial innovation are global financial competition and the integration of financial systems (Mwangi, 2007). Some researchers also believe that a crisis is a cause of financial innovation, but financial innovation itself can cause a financial crisis. For example, the financial crisis in 2008 was caused by the negative impact of financial innovation. One reason for the crisis was that financial organizations sought to maximize their profits by innovating more financial instruments than they needed (Santoro & Strauss, 2012). Economic freedom also can be driven by financial innovation. By definition, economic freedom refers to the extent to which the economic institutions guarantee the “absence of government coercion or constraint on the production, distribution, or consumption of goods and services beyond the extent necessary for citizens to protect and maintain liberty itself.” Based on research done by Jacque (2004), the result of financial innovation can be classified into five types, such as: New financial intermediaries (venture capital funds), new financial instruments, new financial markets (insurance derivatives), new financial services (e-trading or e-banking), and new financial techniques Value at Risk or Leverage Buy-Out (VaR or LBO). Value at Risk (VaR) is a statistical technique that is used to measure and quantify the financial risk in a firm or investment.
transform into digital money in our digital wallet. The users should have physical money first, after that they can get the e-money. For some people, e-payment is not really interested because it is still controlled by other parties like governments, banks and others. Besides that, before making any e-payment, physical money must be used first; this money has some risks attached to it, relating to inflation and the current regulations.
Bitcoin is an interesting product to review, because it is not tied to any regulations or laws in one country, so the transaction process is easier and also the transaction cost is very low or zero. As mention before, the Indonesian government only stated that bitcoin is not a legal payment, but there is no prohibition on bitcoin trading. In Indonesia, the biggest market exchange for bitcoin is Bitcoin Indonesia (www.bitcoin.co.id). In Indonesia there are no restaurants, universities, cafés or hotels that accept bitcoin payments, but in other countries some do accept them. Some forex brokers like eToro, AvaTrade, LiteForex, Bit4x and others already accept bitcoin. Although a bitcoin payment is not accepted in Indonesia, there is a social project called Bitislands that aims to make Bali the first bitcoin island in the world (idBitcoin, n.d.). This project exists because Bali is one of the most popular tourist destinations. By using bitcoin for payments in Bali, the income will increase and Bali will become an island with advanced technology.
Differing from conventional currencies, bitcoin relies on an open source software algorithm that uses the global internet network to create and verify its transactions. Bitcoins are created at a steady but diminishing rate until an arbitrary limit of 21 million has been reached (Grinberg, 2012). The mining process creates twenty-five bitcoins every twenty-five minutes (the amount will be divided by two every four
years). In other words, the maximum amount of bitcoins will not be achieved until 2140. So far, 16.5 million bitcoins are already in existence, as of September 2017.
Bitcoin is the first highly encrypted digital currency (Kristoufek, 2013). It is also not backed by any tangible assets. Bitcoin depends on a highly decentralized distribution network of users to mine, store, and transfer it; it is not managed by a government, bank or organization (Ron & Shamir, 2013). Three things that make bitcoin profitable is the uncertainty condition, the loss of faith in the existing banking system’s stability and future economic security (Bouoiyour & Selmi, 2017).
3. The System of Bitcoin
The system of bitcoin itself is unique. Bitcoin uses open source software. Bitcoin relies on two fundamental technologies from cryptography. The first one is a public-private key crypto-graphy to store and spend the money and the second is the cryptographic validation of transactions. The standard public-private key cryptography allows anyone to create a public key and an associated private key (Diffie & Hellman, 1976). Bitcoin uses a big database; every data transfer takes many nodes using peer-to-peer networks.
Journal of Indonesian Economy and Business, Vol. 33, No. 1, 2018 53
4. The Way to Get Bitcoin
The users should have a place to store their new bitcoins. In the bitcoin world, this is called a “wallet”, actually this wallet is almost the same as a bank account. Different wallets will have different security systems, so it depends on the user whether he or she wants to have a wallet with a high security system or a low security system. There are three main options for the wallet: A software wallet stored on the hard drive of your computer; an online and web-based service; and a vault service that keeps your bitcoins protected offline.
Different options have different vulnerabi-lities, if users store their bitcoins in their computers, they should back up the computers to protect them if they get corrupted. For the online based service, it will provide the user with a choice of different security systems, from quite good (multi-factor authentication) to quite poor (ID and password). Some examples of bitcoin wallets are Copay, breadwallet and Airbitz for iOS and Android, Armory and Bitcoin Core for computers or PCs and there are some websites also. There are some steps that must be followed to obtain a new wallet: Firstly, users should open the website https://blockchain.info (accessed on September 20, 2017); secondly, click “start new wallet” then complete the form presented by it; thirdly, login to the new wallet that you have now made, your wallet’s address is an alpha-numeric combination, for example:
19ZZ8DZsb5qhtchuKPZWET7Uj8rDoj4KgmB After getting the new wallet, then the user can buy or get bitcoins for free. There are three ways to get bitcoins:
Mining, the bitcoin miner can “go” mining when
someone requests a transaction; the requested transaction is broadcast to a peer-to-peer network consisting of some computers which are known as nodes. All of these computers are
operated by bitcoin miners, after the transaction has been completed, then all of the miners will receive a reward in the form of bitcoins. Mining itself is very difficult, because the user needs a high specification computer with a fast internet connection, and it also takes a long time to solve the block code.
Bitcoin trade exchange, the second way to get bitcoins, is for the user to buy them through formal and trusted websites. Indonesia, the USA, and other countries have different media outlets or websites that are used to buy bitcoins. For Indonesia, if the users want to buy bitcoins, they may visit www.bitcoin.co.id and follow the procedure listed there. The most common way to purchase bitcoins is through an account with a bitcoin exchange, such as Coinbase.com and bter.com (Roose, 2013). For example, a user in Indonesia wants to buy some bitcoins on September 20, 2017, the price of one bitcoin that day was IDR49,699,700 so the user needs to have or deposit that sum of money into the relevant account and he/she or she will get 1 BTC. Bitcoin also can be traded by accessing www.investing.com (accessed on September 20, 2017). In this website, there is a market that trades bitcoins and also other cryptocurrencies.
Faucet, there are several websites that share bitcoins for free, but the users must fulfill several requirements to get those free bitcoins. For example, they should download new applications, play games or watch advertise-ments to get the bitcoins for free.
5. Related Work
bitcoins for their investment portfolios. According to some previous research, there are many factors that influence bitcoin’s price.
As mention before, cryptocurrencies or bitcoin are a new financial instrument and they have become an alternative investment with diversification benefits (Brière, Oosterlinck, & Szafarz, 2013). Since becoming an investment alternative, it has developed a typical charac-teristic of investments; the price of bitcoins tends to increase or decrease significantly in the short-term. The price volatility has attracted the attention of the academic and industrial fields. That is why so much research has been published since the rise in bitcoin’s price.
According to Kristoufek (2013), bitcoin’s price cannot be explained by standard economic theories like future cash flow, purchasing power parity and uncovered interest rate parity, because several features of a normal currency’s supply and demand do not exist in the bitcoin market. Bitcoin is not issued by a central bank or a government. Bitcoin’s price is separated from the real economy and there are no macroecono-mic fundamentals that determine bitcoin’s price formation. Similarly, Ciaian, Rajcaniova, and Kancs (2014) also found that bitcoin’s price is not driven by macroeconomics factors. Both of these researchers found that the one thing that does affect bitcoin’s price is its attractiveness for investors. Yermack (2013) also found that bitcoin’s price is highly correlated with its trading characteristics or its supply and demand. It has no correlation with classical currencies and also is not influenced by macroeconomic events. In contrast, van Wijk (2013) found that the role of global financial development, which can be measured by looking at the stock exchange indices, exchange rates, and oil prices, can also affect bitcoin’s price. Stock exchange indices represent the general macroeconomic situation and the state of financial development,
because those stock exchange indices contain or represent the performance of the big companies in those countries. Research from Zhu, Dickinson, & Li (2017) and Wang, Xue, & Liu (2016) found that macroeconomic indicators represented by the DJIA have a negative effect on bitcoin’s price.
H1: Macroeconomic indicators, namely the stock exchange indices, negatively influence bitcoin’s price fluctuations.
Other research found that market speculation primarily drives bitcoin’s price (Buchholz, Delaney, Warren, & Parker, 2012; Bouoiyour & Selmi, 2015). When the demand increases, then the price will increase too, because the supply of bitcoins is limited. Bouoiyour, Selmi, Tiwari, & Olayeni (2016) stated that bitcoin’s price is determined by the long-term fundamentals, including the supply and demand fundamentals. The fluctuation in bitcoin’s price is also influenced by the new adopters of bitcoin itself, or as can be said, the new users and it’s spread by word of mouth (Garcia, Tessone, Mavrodiev, & Perony, 2014). The research by Polasik, Piotrowska, Wisniewski, Kotkowski, and Lightfoot (2015) found that the rising number of bitcoin users, whether they treat bitcoin as an investment or as a payment media, also drives the price of bitcoin.
H2: The supply and demand of bitcoins negatively influence bitcoin’s price fluctuations
Journal of Indonesian Economy and Business, Vol. 33, No. 1, 2018 55
gold’s price, and this created an opportunity for bitcoin. The volatility of bitcoin’s price is higher than the volatility of gold’s price or some foreign currencies (Dwyer, 2015).
H3: Gold’s price negatively influences bitcoin’s price fluctuations.
METHODOLOGY
The data are gathered with reference to one currency, the US$. The variables in this research consist of: Bitcoin’s price; the total number of wallet users represents the demand for bitcoins; the total number of bitcoins that have been mined represents the supply of bitcoins; the price of gold; and the Dow Jones Industrial Average (DJIA) which represents the macroeconomic indicator. Bitcoin’s price acts as the dependent variable and the others act as the independent variables. The daily closing price for bitcoins, the total number of bitcoins that have been mined, and the total number of bitcoin wallet users were all retrieved from quandl.com/ data/BCHAIN-Blockchain (accessed on September 4, 2017). The Dow Jones Industrial Average data were retrieved from www.investing.com and the gold price was retrieved from quandl.com/data/LBMA/GOLD-Gold-Price-London-Fixing. The theoretical framework suggests that bitcoin’s price and the other explanatory variables are mutually interdependent. The estimation of non-linear interdependencies among interdependent time series in the presence of mutually cointegrated variables is subject to the endogeneity problem (Lütkepohl & Krätzig, 2004). To avoid this problem, this research uses a Vector Auto-Regression (VAR) model, but if the data is cointegrated, the correct method would be a Vector Error Correction Model (VECM). This method is used when the time series data is not stationery but cointegrated. There are several steps that must be fulfilled in this analysis.
Stationary test, an Augmented Dickey-Fuller (ADF) method is used for stationary tests at the same degree (level, first difference or second difference). If the variance is not too big and has a closed tendency to the average value, it means the data is stationary (Gujarati, 2016).
∆ = + +
∑ ∆ + (1)
Where ∆Ft is the first or second difference; α0 is the intercept; γ are the variables; p is the lag length; and is an error term.
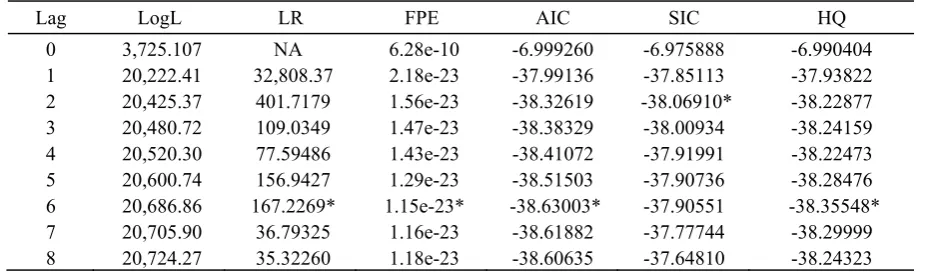
The Determination of optimal lag, one of the problems that occur in a stationary test is the determination of the optimal lag. If the number of the lag that is used in the test is too small, the error will not estimate accurately. If the number of the lag is too big, then it will reduce the ability to reject H0. There are some criteria that could be used to examine the optimal lag that should be used in the stationary test, such as the Akaike Information Criterian (AIC), Schwarz Information Criterion (SIC), and Hannan-Quinn (HQ). In this research we choose the SIC because, based on Lütkepohl and Reimers (1992), the SIC performs well in choosing the lag’s length.
Schwarz Information Criterion (SIC) =
2 + (2)
Where T is the total number of observations and k is the estimated parameters
Granger’s causality test, Granger’s causality
test is very important because it is used to test the relationship between variables. In Johansen’s cointegration test, the result only explains the one-way relationship between variables, but with Granger’s causality test, the result explains the two-way relationship between variables.
test. The purpose of this test is to examine the existence of short-term or long-term relation-ships between the variables. Cointegration is a combination of the linear relationship of the non-stationary variables and all the variables that should be cointegrated in the same degree. Johansen’s test can be seen in the auto-regression model with p as follows (Gujarati, 2016):
= + ⋯ + + + (3)
Where
Y
t is the vector-k on non-stationary variables,Π
t is the vector-d on deterministic variables, andε
t is the innovation vector.Vector Error Correction Model (VECM), the VECM is a model derived from Vector Auto-Regression (VAR). VECM can be used when the time series data have a cointegrated relationship. VECM also can used to determined short-term relationships through the standard coefficient, and estimate long-term relationships by using the residual lag from the regression. This research use VECM because it is free from the limitations of economic theory like endogenous and false exogenous variables; this method captures all the relationships between the variables and avoids any bias parameters.
Innovation accounting, the weakness of the VAR method is it is difficult to interpret the results of the test. Therefore, to reach the objective of this research, which is to test the influence of bitcoin’s supply and demand, the Dow Jones Industrial Average (DJIA) and gold’s price to bitcoin’s price are used; the other analysis tool that should be used is innovation accounting, which consists of the Impulse Response Function (IRF) and variance decomposition. The IRF is used to investigate the responses of one variable when there is a shock to the other variables, or to that variable
itself. Variance decomposition is used to test how big a contribution the independent variable has on influencing the dependent variable.
DATA AND ANALYSIS
The first test is the stationary test which uses an Augmented Dickey Fuller (ADF) method. The purpose of this test is to examine whether the data is stationary or not.
From Table 1 it can be seen that from the results of the stationary test in the level degree, all of the data are not stationary because the t-statistic > MacKinnon’s critical value. The results of the t-statistics for the variables BTC_PRICE, DOW_JONES, BTC_SUPPLY, BTC_DEMAND, GOLD_PRICE are as large as 0.909048, 1.243244, 16.00832, 8.106177, -1.102775, respectively Therefore, the data will be tested in the first-difference degree.
From Table 2, it can be seen that all of the data are already stationary in the first-difference degree because the t-statistic < MacKinnon’s critical value. The result of the ADF t-statistics
for BTC_PRICE, DOW_JONES, BTC_SUPPLY, BTC_DEMAND, GOLD_PRICE are as large as 27.76146,
-33.50909, -31.69683, -9.628928, -31.55764, respectively.
Journal of Indonesian Economy and Business, Vol. 33, No. 1, 2018 57
Table 1. Stationary Test in the Level Degree
Variables t-statistic and MacKinnon Critical Value Explanation
t-statistic 1% 5% 10%
BTC_PRICE -0.909048 -3.436250 -2.864033 -2.568149 Not Stationary DOW_JONES -1.243244 -3.436244 -2.864031 -2.568147 Not Stationary BTC_SUPPLY 16.00832 -3.436255 -2.864036 -2.568150 Not Stationary BTC_DEMAND 8.106177 -3.436255 -2.864036 -2.568150 Not Stationary GOLD_PRICE -1.102775 -3.436244 -2.864031 -2.568147 Not Stationary Source: Summarized from EViews Result-2017
Table 2. Stationary Test in the First-Difference Degree
Variables t-statistic and MacKinnon Critical Value Explanation
t-statistic 1% 5% 10%
BTC_PRICE -27.76146 -3.436250 -2.864033 -2.568149 Stationary DOW_JONES -33.50909 -3.436250 -2.864033 -2.568149 Stationary BTC_SUPPLY -31.69683 -3.436250 -2.864033 -2.568149 Stationary BTC_DEMAND -9.628928 -3.436261 -2.864038 -2.568152 Stationary GOLD_PRICE -31.55764 -3.436250 -2.864033 -2.568149 Stationary Source: Summarized from EViews Result-2017
Table 3. Optimal Lag Test
Lag LogL LR FPE AIC SIC HQ
0 3,725.107 NA 6.28e-10 -6.999260 -6.975888 -6.990404 1 20,222.41 32,808.37 2.18e-23 -37.99136 -37.85113 -37.93822 2 20,425.37 401.7179 1.56e-23 -38.32619 -38.06910* -38.22877 3 20,480.72 109.0349 1.47e-23 -38.38329 -38.00934 -38.24159 4 20,520.30 77.59486 1.43e-23 -38.41072 -37.91991 -38.22473 5 20,600.74 156.9427 1.29e-23 -38.51503 -37.90736 -38.28476 6 20,686.86 167.2269* 1.15e-23* -38.63003* -37.90551 -38.35548* 7 20,705.90 36.79325 1.16e-23 -38.61882 -37.77744 -38.29999 8 20,724.27 35.32260 1.18e-23 -38.60635 -37.64810 -38.24323 Source: Summarized from EViews Result-2017
After finishing with determining the optimal lag, the data are preceded by Granger’s causality test. By comparing the alpha, which is 0.01, 0.05, and 0.10, with the results, Granger’s causality test shows the following findings.
From the results in Table 4, it can be seen that there is a two-way relationship between BTC_DEMAND and BTC_PRICE, because the probability is less than the alpha. For the variables BTC_SUPPLY and BTC_PRICE, the result indicates that there is no two-way relationship between these variables. The change in BTC_SUPPLY does not influence the fluctuation of BTC_PRICE, but the change in
indicates that there is no two-way relationship between GOLD_PRICE and BTC_PRICE, only the change in GOLD_PRICE will affect BTC_PRICE, but the change in BTC_PRICE will not affect GOLD_PRICE.
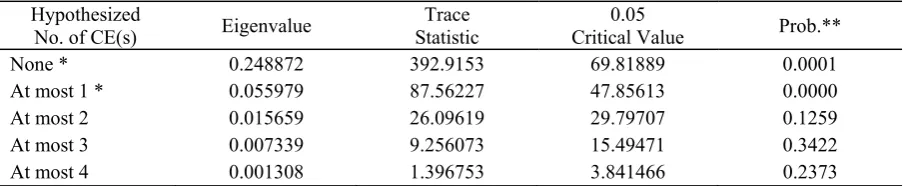
After discovering the relationships between the variables, we then continued with the cointegration test and the results are shown in Table 5. Based on these results, there are two cointegration equations. The first equation is the trace statistic (392.9153) > the critical value (69.81889). The second equation is the trace statistic (87.56227) > the critical value (47.85613). It means that bitcoin’s price, bitcoin’s supply, bitcoin’s demand, the DJIA, and the price of gold have a stable relationship and move in a similar manner in the long-run.
Based on Wang et al. (2016) if the data is stationary in the first difference and there is a cointegration relationship between the variables, then the correct method that should be applied is
the Vector Error Correction Model (VECM). The VECM can explain the long-term and short-term influences. Table 6 presents the long-short-term influence.
From the results shown in Table 6, the long-term statistical variables BTC_DEMAND, DOW_JONES and GOLD_PRICE have a negative relationship with BTC_PRICE and are significant at 1% and 5%, but the variable BTC_SUPPLY is not significant. This result shows that in the long-run the change in BTC_DEMAND, DOW_JONES and GOLD_PRICE is always followed by a change in BTC_PRICE. According to Buchholz et al. (2012) and Ciaian, Rajcaniova, and Kancs (2016) the main factor that drives bitcoin’s price is the interaction between the demand and the supply. The demand is driven by the value of bitcoin as a medium of exchange, so it will influence the price of bitcoin, but the supply of bitcoins is not influenced by the price in the Table 4. Granger Causality Test
Null Hypothesis: F-Statistic Prob. BTC_DEMAND does not Granger Cause BTC_PRICE 4.17974 0.0156** BTC_PRICE does not Granger Cause BTC_DEMAND 27.5729 2.E-12*** BTC_SUPPLY does not Granger Cause BTC_PRICE 1.97405 0.1394 BTC_PRICE does not Granger Cause BTC_SUPPLY 2.56536 0.0774* DOW_JONES does not Granger Cause BTC_PRICE 5.75033 0.0033*** BTC_PRICE does not Granger Cause DOW_JONES 0.47955 0.6192 GOLD_PRICE does not Granger Cause BTC_PRICE 4.96672 0.0071*** BTC_PRICE does not Granger Cause GOLD_PRICE 1.75181 0.1740 ***Significant at 1%, ** Significant at 5%, *Significant at 10%
Source: Summarized from EViews Result-2017
Table 5. Johansen’s Cointegration Test Hypothesized
No. of CE(s) Eigenvalue
Trace Statistic
0.05
Critical Value Prob.**
None * 0.248872 392.9153 69.81889 0.0001
At most 1 * 0.055979 87.56227 47.85613 0.0000
At most 2 0.015659 26.09619 29.79707 0.1259
At most 3 0.007339 9.256073 15.49471 0.3422
At most 4 0.001308 1.396753 3.841466 0.2373
Journal of Indonesian Economy and Business, Vol. 33, No. 1, 2018 59
long-term because the long-term supply is fixed at 21 million coins, and all of the people in the world already known that. The DJIA and gold price also influence bitcoin’s price in the long-term because both of these variables are not fixed and can change at any time. These two variables are also affected by government decisions, when there is a decision that causes a decline in the DJIA or the price of gold, there will be customers or investors shifting from the investments that are regulated by governments to those that are not regulated by governments (ie. bitcoin). This change will affect investors’ decisions and also affect the demand for bitcoins. When the Dow Jones and gold’s price decrease, there will be a possibility that investors will move to bitcoin investments.
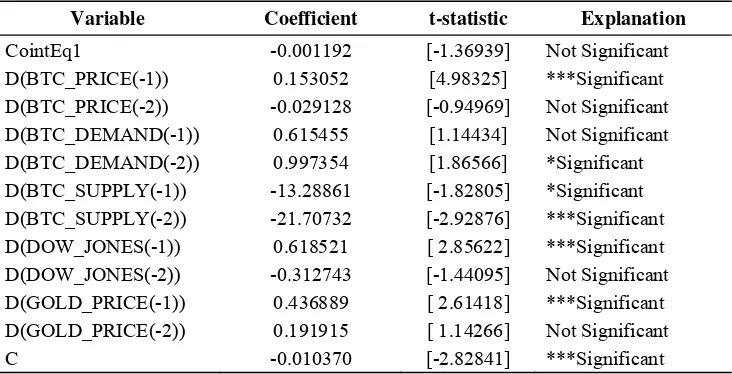
Beside the long-run result, the VECM’s estimation also found the following results for the short-run. Some of the results are not significant because the partial t-statistic (absolute) is smaller than the t-table. The variable BTC_PRICE statistically has a significant effect on BTC_PRICE in the first lag at 1%, but in the second lag BTC_PRICE has no significant effect. It means that the historical price of bitcoins affects the formation of bitcoins in the next period. The variable BTC_DEMAND statistically has no significant effect on BTC_PRICE in the first lag, but in the second lag BTC_DEMAND has a significant effect at the 10% level. The variable BTC_SUPPLY statistically has a significant effect on BTC_PRICE in the first lag and the second lag at 10% and 1% level, respectively.
Table 6. Vector Error Correction Model (Long-term)
Variable Coefficient t-statistic Explanation
BTC_DEMAND(-1) -1.896181 [-2.28495] **Significant
BTC_SUPPLY(-1) -0.803904 [-0.11483] Not Significant
DOW_JONES(-1) -8.664319 [-3.26995] ***Significant
GOLD_PRICE(-1) -7.207159 [-3.81699] ***Significant ***Significant at 1%, **Significant at 5% , *Significant at 10%
Source: Summarized from EViews Result-2017
Table 7. Vector Error Correction Model (Short-term)
Variable Coefficient t-statistic Explanation
CointEq1 -0.001192 [-1.36939] Not Significant
D(BTC_PRICE(-1)) 0.153052 [4.98325] ***Significant D(BTC_PRICE(-2)) -0.029128 [-0.94969] Not Significant D(BTC_DEMAND(-1)) 0.615455 [1.14434] Not Significant
D(BTC_DEMAND(-2)) 0.997354 [1.86566] *Significant D(BTC_SUPPLY(-1)) -13.28861 [-1.82805] *Significant D(BTC_SUPPLY(-2)) -21.70732 [-2.92876] ***Significant D(DOW_JONES(-1)) 0.618521 [ 2.85622] ***Significant D(DOW_JONES(-2)) -0.312743 [-1.44095] Not Significant D(GOLD_PRICE(-1)) 0.436889 [ 2.61418] ***Significant D(GOLD_PRICE(-2)) 0.191915 [ 1.14266] Not Significant
C -0.010370 [-2.82841] ***Significant
The supply of bitcoins has a significant effect on bitcoin’s price in the short-run, and the effect is negative. This happens because when the number of bitcoins being mined increases, it means that the supply is getting closer to the maximum amount. And if the number of bitcoins reaches the maximum amount, there will be a possibility that the number of miners and/or users will decrease, bitcoin will become more centralized and this will have a negative effect, causing an increase in the transaction fees. If that happens, there will be fewer people willing to buy bitcoins and the price will also decrease. The variable DOW_JONES statistically has a significant effect on BTC_PRICE in the first lag at 1%, but in the second lag DOW_JONES has no significant effect. The variable GOLD_PRICE statistically has a significant
effect on BTC_PRICE in the first lag at 1%, but in the second lag GOLD_PRICE has no significant effect. Both the DJIA and gold’s price are related to the US dollar, which also means they are related with the US government. Sometimes the government’s decisions can make the US dollar appreciate or depreciate. If the US dollar appreciates, the Dow Jones Industrial Average and the price of gold get stronger, and people’s willingness to invest in other financial assets will decrease. However, if the US dollar depreciates, people try to find another investment type that gives them a better return.
As mention before, one of the weaknesses of VAR or VECM is it is difficult to interpret them, so IRF and variance decomposition should be applied. Table 8 and Table 9 show the results from the IRF and variance decomposition tests.
Table 8. Impulse Response Function (IRF) Test
Period BTC_PRICE BTC_DEMAND BTC_SUPPLY DOW_JONES GOLD_PRICE 1 0.054218 0.000000 0.000000 0.000000 0.000000 2 0.062455 -0.000660 -0.002577 0.004725 0.004439 3 0.062107 -8.45E-05 -0.008117 0.002765 0.006728 4 0.061460 0.002299 -0.009958 0.002536 0.006882 5 0.061134 0.004380 -0.011832 0.002796 0.006616 6 0.060989 0.005592 -0.013563 0.002786 0.006239 7 0.060832 0.006673 -0.014877 0.002839 0.005985 8 0.060707 0.007577 -0.015893 0.002907 0.005822 9 0.060602 0.008281 -0.016728 0.002964 0.005698 10 0.060504 0.008844 -0.017397 0.003019 0.005608 Source: Summarized from EViews Result-2017-2017
Table 9. Variance Decomposition Test
Journal of Indonesian Economy and Business, Vol. 33, No. 1, 2018 61
In the second column, it can be seen that the response by BTC_PRICE when there is a shock in BTC_DEMAND is less than zero at the second and third period, and an increase from the third period until the tenth period. It is similar with the result of Granger’s causality test, BTC_DEMAND will influence BTC_PRICE. In the third column, the response of BTC_PRICE when there is a shock in BTC_SUPPLY decreases each period until it is less than zero. In the fourth column, the response of BTC_PRICE when there is a shock in DOW_JONES increases each period and also the response of BTC_PRICE when there is a shock in GOLD_PRICE increases in the first until the sixth period, and then starts to decrease in the seventh period until the tenth period.
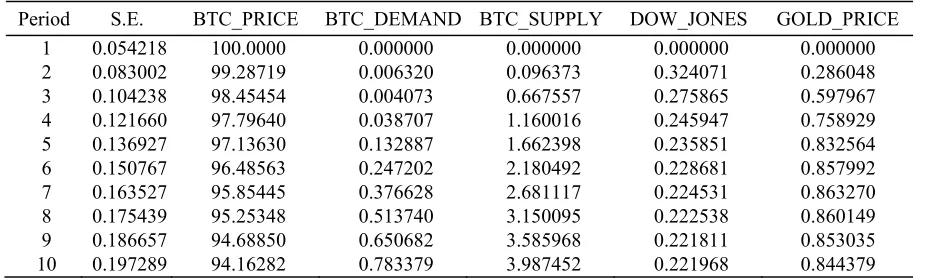
In Table 9 the biggest contribution to BTC_PRICE comes from the variable itself. In the first period, the variance of BTC_PRICE is 100%. In the second period, the variance decreases until it reaches 99%, and then always decreases until the tenth period when it reaches 94.16%. BTC_DEMAND, BTC_SUPPLY, DOW_JONES, and GOLD_PRICE are all 0.00% at the first period and start to increase from the second until the tenth period. BTC demand reaches 0.78% in the tenth period, BTC_SUPPLY reaches 3.99%, DOW-JONES reaches 0.22% and GOLD_PRICE reaches 0.85% in the tenth period. It means that in future periods the change in BTC_PRICE mainly depends on the change in BTC_PRICE itself which is 94.16% and the rest are 0.78% from BTC_DEMAND, 3.99% from BTC_SUPPLY, 0.22% from DOW_JONES and 0.85% from GOLD_PRICE.
DISCUSSION
Bitcoin is a very unique currency because it has no ties with any government or party, the system is decentralized, meaning that everyone can
manage it, and it is unique because there is a limit on the supply of bitcoins, which is 21 million; but this is also a potential future problem. From the variance decomposition test, the contribution of each variable’s shock and how it influences bitcoin’s price can be seen.
The historical price of bitcoin has become the biggest influence on the price of bitcoins. Some people who want to buy bitcoins always look at its historical price, which has tended to increase every year, and therefore people want to buy bitcoin because they think that it has a bright future. It means that the demand for, and users of, bitcoin also increases. The second contributor to the fluctuations in bitcoin’s price is the supply. All of the people already known that the supply of bitcoins is limited to 21 million coins. This limited supply has lead to the increasing price of bitcoins, but also a decrease in their price because customers are shifting to other cryptocurrencies. The third contributor is gold’s price. Gold is regarded as a safe haven for investors; its volatility is lower compared with that of other financial assets. Gold can protect investors during crises, but not necessarily in normal economic conditions. Although it is almost the same as bitcoin, in terms of its supply and function, it is still tied to governments.
bitcoins will also increase. Beside that if governments legalize this currency, it means that the investors will feel more secure investing in bitcoin. The last contributor to bitcoin’s price fluctuations is the stock exchange indices. Stock exchange indices represent the macroeconomic aspects because they are managed directly by governments. In fact, the contribution of this variable to the change in bitcoin’s price is very small, because bitcoin does not have any direct ties to the real economy and/or governments.
CONCLUSION
The probability of losses when trading bitcoin is higher than when trading other investments, as long as bitcoin, as a digital currency, is not controlled by governments. The number of bitcoin users always increases every year, but the supply is limited. The price of bitcoin also increases significantly every year. From the results, the first hypothesis is supported. The macroeconomic indicator represented by the Dow Jones Industrial Average (DJIA) has a significant negative influence in the long-run and in the short-run. From the IRF and variance decomposition tests, if there is a shock in Dow Jones, it will influence bitcoin’s price by as much as 0.22%. The demand for bitcoins has a significant negative influence in the long-run and also the short-run. From the IRF and variance decomposition tests, it can be seen that if there is a positive shock to the demand for bitcoins, it will influence bitcoin’s price by as much as 0.78%. Bitcoin’s supply is not significant in the long-run, but it is significant in the short-run. If there is a shock to the supply of bitcoins, it will also influence bitcoin’s price by up to 3.99%. From these results, the second hypothesis is also supported; both bitcoin’s demand and supply negatively influence the price. The third hypothesis is also supported because the price of gold has a significant
negative effect in the long-run and short-run. From the IRF and variance decomposition tests, the influence of gold’s price on bitcoin’s price is as much as 0.85%. Based on the variance decomposition test, bitcoin’s price fluctuation is mostly influenced by its historical price, which is 94.16%. For the rest, 3.99% comes from bitcoin’s supply, 0.85% from gold’s price, 0.78% from bitcoin’s demand and 0.22% from the macroeconomic indicators.
This research is in line with the previous research by van Wijk (2013) that stated the role of global financial development is measured by looking at the stock exchange indices’ effect on bitcoin’s price. Contrary to that, this research contrasts with Kristoufek (2013) and Ciaian et al. (2014), both of whom found that bitcoin’s price is not driven by macroeconomic factors alone. This research is also in line with some previous research from Buchholz et al. (2012) and Bouoiyour and Selmi (2015) that found market speculation is the primary driver of bitcoin’s price. When demand increased, the price increased, because the supply is limited. We found that the price of gold has a significant effect on bitcoin’s price in the short-run and long-run. This result is similar to the previous research from Zhu et al. (2017) that stated gold’s price does affect the price of bitcoin in the short-run, but not in the long run.
Journal of Indonesian Economy and Business, Vol. 33, No. 1, 2018 63
REFERENCES
Bergstra, J. A., & Weijland, P. (2014). Bitcoin: a money-like informational commodity. arXiv preprint arXiv:1402.4778.
Bitcoin Price. (n.d.). Retrived from www.coingecko.com/id/grafik_harga/bitcoi n/idr - accessed on December 14, 2017. Bouoiyour, J., & Selmi, R. (2015). What does
bitcoin look like? Annals of Economics & Finance, 16(2).
Bouoiyour, J., & Selmi, R. (2017). The bitcoin price formation: Beyond the fundamental sources. arXiv preprint arXiv:1707.01284. Bouoiyour, J., Selmi, R., Tiwari, A. K., &
Olayeni, O. R. (2016). What drives bitcoin price. Economics Bulletin, 36(2), 843-850. Brière, M., Oosterlinck, K. & Szafarz, A. (2013).
Virtual currency, tangible return: Portfolio diversification with bitcoins. (CEB Working Paper No. 13/031 September). Université Libre de Bruxelles: Solvay Brussels School of Economics and Management, Centre Emile Bernheim.
Buchholz, M., Delaney, J., Warren, J., & Parker, J. (2012). Bits and bets, information, price volatility, and demand for bitcoin. Economics, 312. Retrived from http://www.bitcointrading.com/pdf/bitsandb ets.pdf.
Ciaian, P., Rajcaniova, M., & Kancs, D. A. (2014). The economics of bitcoin price formation. EERI Research Paper Series. Ciaian, P., Rajcaniova, M., & Kancs, D. A.
(2016). The economics of bitcoin price formation. Applied Economics, 48(19), 1799-1815.
Diffie, W., & Hellman, M. (1976). New directions in cryptography. IEEE Transactions on Information Theory, 22(6), 644-654.
Dwyer, G. P. (2015). The economics of bitcoin and similar private digital currencies. Journal of Financial Stability, 17, 81-91. Garcia, D., Tessone, C. J., Mavrodiev, P., &
Perony, N. (2014). The digital traces of
bubbles: feedback cycles between socio-economic signals in the bitcoin economy. Journal of the Royal Society Interface, 11(99), 20140623.
Grinberg, R. (2012). Bitcoin: An innovative alternative digital currency. Hastings Sci. & Tech. LJ, 4, 159.
Gujarati, D. N. (2016). Basic Econometrics. Irwin Economics
Singgih, Viriya P. (2017). Bitcoin penetrates deeper into Indonesian market, The Jakarta
Post. Retrieved from http://www.thejakartapost.com/
news/2017/01/03/bitcoin-penetrates-deeper-into-indonesian-market.html.
idBitcoin. (n.d.) Asosiasi Blockchain Indonesia. [Indonesian Blockchain Association].
Retrived from https://idbitcoin.org/project/bitislandscom -
accessed on September 5, 2017
Jacque, L. L. (2001). Financial innovations and the dynamics of emerging capital markets. In Financial innovations and the welfare of nations (pp. 1-21). Springer, Boston, MA. Jia, L. (2013). Bitcoin: theory, practice and
influences. Studies International Finance, 12, 14-25.
Kristoufek, L. (2013). Bitcoin meets google trends and wikipedia: Quantifying the relationship between phenomena of the internet era. Scientific Reports, 3, 3415. Lütkepohl, H., & Krätzig, M. (Eds.). (2004).
Applied time series econometrics. Cambridge university press.
Lütkepohl, H., & Reimers, H. E. (1992). Impulse response analysis of cointegrated systems. Journal of economic dynamics and control, 16(1), 53-78.
Mathews, K. & Thompson, J. (2008). The economics of banking. 2nd ed. Chippreham, Wiltshire, Great Britain.
Miller, M. H. (1986). Financial innovation: The last twenty years and the next. Journal of Financial and Quantitative Analysis, 21(4), 459-471.
Mwangi, M. K. (2007). Factors influencing financial innovation in Kenya’s securities market: A case study of firms listed at the Nairobi securities exchange. Unpublished MBA Project, University of Nairobi.
Pianalto, S. (2007). Financial innovation: benefit and challenges. Presentation to the Community Development Policy Summit, Cleveland, Ohio, 22 June.
Polasik, M., Piotrowska, A. I., Wisniewski, T. P., Kotkowski, R., & Lightfoot, G. (2015). Price fluctuations and the use of bitcoin: An empirical inquiry. International Journal of Electronic Commerce, 20(1), 9-49.
Ron, D., & Shamir, A. (2013, April). Quantitative analysis of the full bitcoin transaction graph. In International Conference on Financial Cryptography and Data Security (pp. 6-24). Springer, Berlin, Heidelberg.
Roose, K. (2013). I bought a bitcoin: How I joined a virtual currency megabubble. New York.
Santoro, M. A., & Strauss, R. J. (2012). Wall street values: business ethics and the global financial crisis. Cambridge University Press.
Singgih, Viriya P. (2017). Bitcoin penetrates deeper into Indonesian market, The Jakarta
Post. Retrieved from
http://www.thejakartapost.com/news/2017/0
1/03/bitcoin-penetrates-deeper-into-indonesian-market.html.
Sukamulja, S. (2001). Kointegrasi, koreksi kesalahan dan keterbentukan harga antar bursa: Kasus Tse dan Nyse-Lse-Jsx [Cointegration, error correction model, and price discovery among NYSE-LSE-TSE-JSX] (Doctoral dissertation, UGM.).
van Wijk, D. (2013). What can be expected from the bitcoin. Erasmus Universiteit Rotterdam.
Vassiliadis, S., Papadopoulos, P., Rangoussi, M., Konieczny, T., & Gralewski, J. (2017). Bitcoin value analysis based on cross-correlations. Journal of Internet Banking and Commerce, 22(S7), 1.
Wang, J., Xue, Y., & Liu, M. (2016). An analysis of bitcoin price based on VEC model. In Proceedings of the 2016 International Conference on Economics and Management Innovations.
Wu, C. Y., Pandey, V. K., & DBA, C. (2014). The value of bitcoin in enhancing the efficiency of an investor’s portfolio. Journal of Financial Planning, 27(9), 44-52.
Yermack, D. (2013). Is bitcoin a real currency? An economic appraisal. National Bureau of Economic Research, No. w19747.
Zhu, Y., Dickinson, D., & Li, J. (2017). Analysis on the influence factors of bitcoin’s price based on VEC model. Financial Innovation, 3(1), 3.