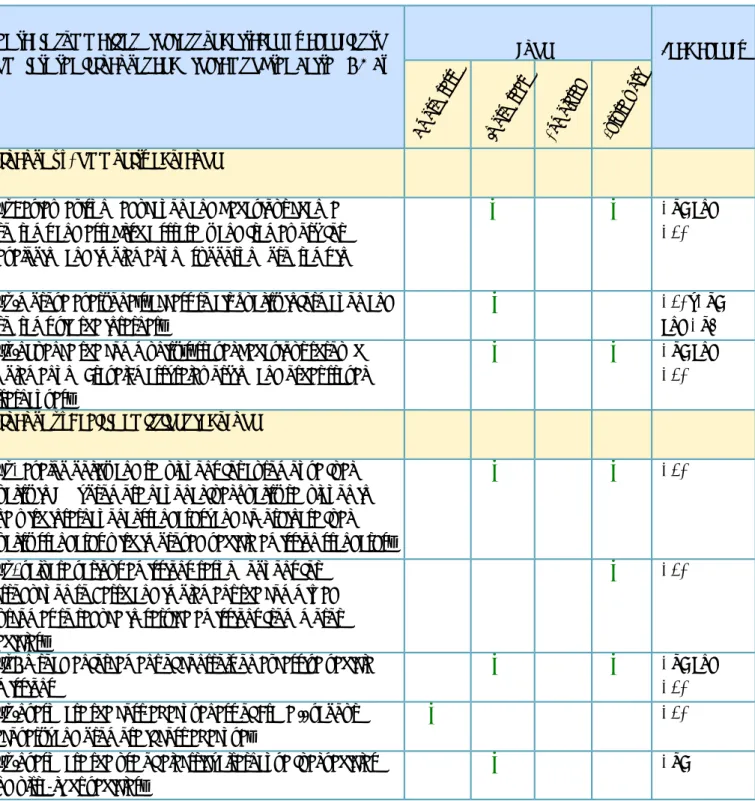
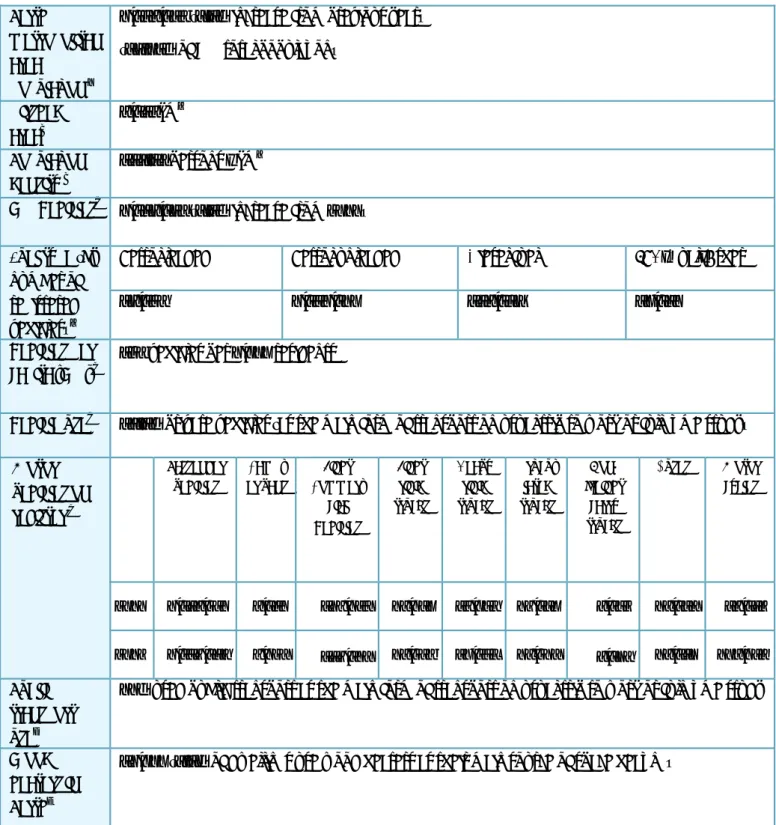
This 'report card' provides a summary of the management actions undertaken, an update on air quality impacts, AQCC membership as well as the resources used to implement the actions over the 2012–13 financial year (Table 1 and Table 2). As part of membership of the Sustainable Energy Association, there is a second Nissan Leaf electric vehicle in use for one year at the RAC's Head Office in West Perth. There have been discussions with Main Roads WA to include CleanRun EcoDrive in the Infrastructure Sustainability Rating Framework as part of the Gateway WA Perth Airport and Air Freight project (DEC).
DEC has purchased and begun testing new monitoring equipment to complement the existing eight air monitoring sites that have been established within the boundaries of the greater Perth metropolitan area. The project also includes local schools and workplaces with the integration of TravelSmart Schools and. The project is also supported by minor infrastructure improvements through the integration of connecting schools and connecting stations (DoT) grant schemes.
The first meeting of the network is planned for August 2013, when the commission will be determined (DoH). The following DoP initiatives will be informed by the strategic assessment led by the Department of Premier and Cabinet (DPC), in close collaboration with the DoP, DPaW and the Office of the. Evaluation of data from the Perth Solar City Living Smart Households program has been completed.
The Strategic Assessment of Perth and Peel Region (SAPPR) is a government project. The evaluation of the program is on hold due to a change in program focus and budget priorities (DoT). It is being reviewed for further improvements which will lead into Phase 2 of the project (DoT).
The first two milestones of the fourth round of TravelSmart Officer funding have been reached. Topics of the meeting include promoting the implementation of Active Transport programmes, strengthening portfolio relationships, promoting improved infrastructure for active transport modes and increasing network capacity (DoT). This research aims to help address some of the knowledge gaps regarding ultrafine particles in the Perth Basin.
As part of the Perth Central Business District Transport Plan, future planned works include: the introduction of a new Green CAT service to Leederville; additional priority lanes for buses; and additional and improved major shared routes as identified in the WA Cycling Network Plan (DoT). Some programs have been removed from Table 3 as they have been completed since Perth AQMP has been in existence. P4: Establish a monitoring steering committee to review air quality monitoring issues in the Perth metro area.
P2: Raise awareness among wood suppliers and installers of wood-burning stoves of the impact of wood-burning stoves on air quality.
Small to medium enterprise emissions reduction
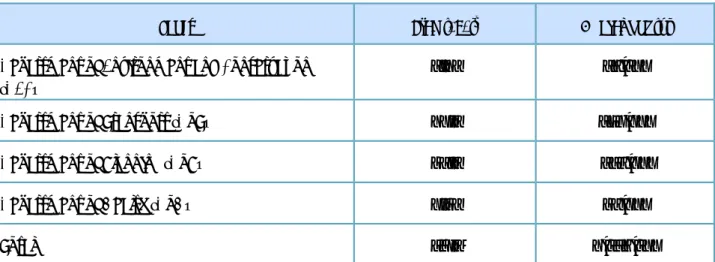
Statistics for the quantification of factors affecting the achievement of the Perth AQMP objectives are provided in Table 4.
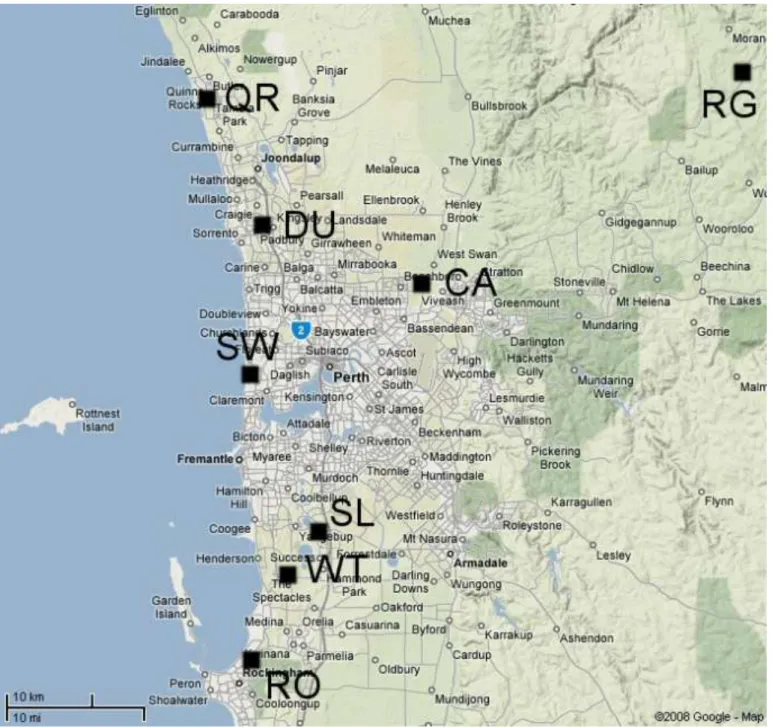
Heavy industry The largest heavy industrial area is in Kwinana in the south-west of the Perth metropolitan region, between Fremantle and Rockingham. The purpose of this section is to provide an indication of Perth's air quality and, by extension, the success or otherwise of the Perth AQMP. It is important to note that there is no single measure of air quality that can provide this, as each approach has its limitations and many programs cannot be directly related to monitoring results.
NEPM air quality standards for CO, NO2 and SO2 were not exceeded at any location in 2012. Although there were more exceedances at monitoring sites compared to last year, the NEPM target was still met for most pollutants except for O3 (0.08ppm averaged over four hours at Caversham and Quinns Rocks). The NEPM ambient air quality advisory standard for particulate matter such as PM2.5 of 25 µg/m3 averaged over 24 hours was exceeded in Caversham, Duncraig, Quinns Rocks and South Lake.
The Ambient Air Quality NEPM advisory standard for particulate matter as PM2.5 of 8µg/m3 averaged over one year was exceeded at Duncraig and South Lake. In 2012, the Ambient Air Quality NEPM standard for carbon monoxide of 9.0ppm averaged over eight hours was not exceeded at any site. In 2012, the Ambient Air Quality NEPM standard for nitrogen dioxide was 0.12ppm averaged over one hour and the 0.03ppm annual average was not exceeded at any site.
In 2012, the NEPM Ambient Air Quality standard for sulfur dioxide of 0.20 ppm one-hour average, the annual standard of 0.02 ppm and 0.08 ppm 24-hour average was not exceeded at any location. In 2012, the standard for ozone of 0.10 ppm averaged over an hour was exceeded at Quinns Rocks, Rolling Green and Swanbourne. The standard for ozone of 0.08 ppm averaged over four hours was exceeded at Caversham, Quinns Rock, Rolling Green and Swanbourne.
The NEPM Ambient Air Quality target of no more than one exceedance at any site was not achieved at Caversham and Quinns Rocks, with two exceedances each. In 2012, the NEPM ambient air quality standard for particulate matter such as PM10 of 50 µg/m3 averaged over 24 hours was exceeded in Duncraig and South Lake twice and four times in Caversham. In 2012, the NEPM ambient air quality advisory standard for particulate matter such as PM2.5 of 25 µg/m3 averaged over 24 hours was exceeded three times in Caversham and Duncraig and four times in Quinns Rocks and South Lake.
The NEPM ambient air quality advisory standard for particulate matter such as PM2.5 of 8µg/m3 averaged over a year was. Since 1995, lead levels in the Queens Building in Perth's central business district have been below 60 percent of the NEPM annual ambient air quality standard of 0.5 µg/m3.