GROWTH AND YIELD PERFORMANCE OF DIFFERENT CHERRY TOMATO VARIETIES GROWN IN DIFFERENT
CALCIUM LEVELS
JANNATUL NAIMA ATKIA
DEPARTMENT OF HORTICULTURE
SHER-E-BANGLA AGRICULTURAL UNIVERSITY DHAKA-1207
JUNE, 2021
GROWTH AND YIELD PERFORMANCE OF DIFFERENT CHERRY TOMATO VARIETIES GROWN IN DIFFERENT
CALCIUM LEVELS BY
JANNATUL NAIMA ATKIA
REGISTRATION NO. 14-06279
A Thesis
Submitted to the Faculty of Agriculture, Sher-e-Bangla Agricultural University, Dhaka in partial fulfillment of the requirements for the degree
of
MASTER OF SCIENCE (MS) IN
HORTICULTURE
SEMESTER: JANUARY-JUNE, 2021
APPROVED BY:
..………
Prof. Dr. Md. Jahedur Rahman Department of Horticulture Sher-e-Bangla Agricultural University
Supervisor
...……….………
Assistant Prof. Md. Rezwan Sarker Department of Horticulture Sher-e-Bangla Agricultural University
Co-Supervisor
...
Prof. Dr. Khaleda Khatun Chairman
Examination Committee
DEPARTMENT OF HORTICULTURE
Sher-e-Bangla Agricultural University (SAU) Sher-e-Bangla Nagar, Dhaka-1207
Ref. No.: Date:
CERTIFICATE
This is to certify that thesis entitled GROWTH AND YIELD PERFORMANCE OF DIFFERENT CHERRY TOMATO VARIETIES GROWN IN DIFFERENT CALCIUM LEVELS” submitted to the Faculty of Agriculture, Sher-e-Bangla Agricultural University (SAU), Dhaka in partial fulfillment of the requirements for the degree of MASTER OF SCIENCE (MS) in HORTICULTURE, embodies the result of a piece of bona fide research work carried out by JANNATUL NAIMA ATKIA Registration No. 14-06279 under my supervision and guidance. No part of the thesis has been submitted for any other degree or diploma.
I further certify that any help or source of information, received during the course of this investigation has been duly acknowledged and style of this thesis have been approved and recommended for submission.
___________________________
Dated: June, 2021 Prof. Dr. Md. Jahedur Rahman Place: Dhaka, Bangladesh Department of Horticulture
Sher-e-Bangla Agricultural University
Supervisor
DEDICATED TO
MY BELOVED
PARENTS
i
ACKNOWLEDGEMENTS
At first, the author takes the opportunity to express her deepest sense of gratefulness to Almighty Allah enables the author to complete her research work for the degree of Master of Science (MS) in Horticulture.
The author really does not have adequate words to express her heartfelt sense of gratification, ever indebtedness and sincere appreciation to her benevolent teacher and research supervisor, Prof. Dr. Md. Jahedur Rahman, Department of Horticulture, Sher-e-Bangla Agricultural University, Dhaka-1207, for her constant help, scholastic guidance, planning experiment, valuable suggestions, timely and solitary instructive criticism for successful completion of the research work as well as preparation of ther thesis.
It is a great pleasure for the author to express her sincere appreciation, profound sense, respect and immense indebtedness to her respected co-supervisor, Assistant Prof. Md. Rezwan Sarker and Chairman, Prof. Dr. Khaleda Khatun Department of Horticulture, Sher-e- Bangla Agricultural University, Dhaka-1207, for providing him with all possible help during the period of research work and preparation of the thesis.
The author would like to express her deepest respect and boundless gratitude to all the respected teachers of the Department of Horticulture, Sher-e-Bangla Agricultural University, Dhaka-1207 for their sympathetic co-operation and inspiration throughout the course of ther study and research work.
Cordial thanks are also due to all laboratory staff and field workers of SAU farm for their co- operation to complete her research work in the field.
The author deeply acknowledges the profound dedication to her beloved Parents and Sisters for their moral support, steadfast encouragement and continuous prayer in all phases of academic pursuit from the beginning to the completion of study successfully.
The Author
ii
GROWTH AND YIELD PERFORMANCE OF DIFFERENT CHERRY TOMATO VARIETIES GROWN IN DIFFERENT CALCIUM LEVELS
BY
JANNATUL NAIMA ATKIA ABSTRACT
A pot experiment was conducted in the semi-greenhouse at the Horticulture Farm of Sher-e- Bangla Agricultural University, Dhaka 1207, Bangladesh, during October 2019 to March 2020 to find out the best combination of calcium fertilizers and different varieties for successful cherry tomato production. The experiment consisted of two factors: Factor A: three types of variety viz. V1= Red Star F1; V2= Sweet Charlie F1; V3= Thai Pink Egg and Factor B: Four doses of calcium fertilizer viz. C1= 0 ppm; C2= 40 ppm; C3= 80 ppm; C4= 120 ppm. There were 12 treatment combinations and experiment was setup in Completely Randomized Design (CRD) with three replications. In case of varieties, the highest plant height at 60 DAT (255.32 cm), maximum branch number per plant (4.58) at 60 DAT, maximum chlorophyll content (75.71 %) at 75 DAT, minimum days required for first flowering (27.67 DAT) and first fruiting (36.33 DAT), maximum flower cluster per plant (30.83), maximum fruit number per plant (284.56), highest single fruit weight (10.52 g), highest amount of TSS (8.90 degrees Brix) and yield per plant (2.94 kg) were obtained from V2 treatment. Similarly, in case of calcium fertilizer, the highest plant height at 60 DAT (233.92 cm), maximum branch number per plant (4.78) at 60 DAT, maximum chlorophyll content (81.53 %) at 75 DAT, minimum days required for first flowering (25.33 DAT) and first fruiting (33.89 DAT), maximum flower cluster per plant (35.28), maximum fruit number per plant (292.77), highest single fruit weight (11.61 g), highest amount of TSS (8.96 degrees Brix) and yield per plant (3.32 kg) were obtained from C2
treatment. In combined effect, the highest plant height at 60 DAT (273.33 cm), maximum branch number per plant (5.67) at 60 DAT, maximum chlorophyll content (86.77 %) at 75 DAT, minimum days required for first flowering (24.00 DAT) and first fruiting (32.00 DAT), maximum flower cluster per plant (36.67), maximum fruit number per plant (362.02), highest single fruit weight (13.33 g), highest amount of TSS (9.47 degrees Brix) and yield per plant (4.34 kg) were obtained from V2C2 treatment. Among the treatment combination, V2C2 (Sweet Charlie F1 variety with 40 ppm Ca) treatment seemed to be more promising for obtaining higher yield of cherry tomato.
iii
TABLE OF CONTENTS
CHAPTER TITLE PAGE
ACKNOWLEDGEMENTS I
ABSTRACT II
TABLE OF CONTENTS III
LIST OF TABLES V
LIST OF FIGURES VI
LIST OF PLATES VIII
LIST OF APPENDICES IX
LIST OF ABBREVIATIONS AND ACRONYMS X
CHAPTER I INTRODUCTION 01
CHAPTER II REVIEW OF LITERATURE 05
2.1 Effect of Ca on growth and yield 05 2.1.1 Effect of Ca on growth and yield 05
2.1.2 Role of Ca on crop protection 11
CHAPTER III MATERIALS AND METHODS 16
3.1 Experimental site and period 16
3.2 Experimental location 16
3.3 Plant and other materials 16
3.4 Experimental Design and treatments 16
3.5 Preparation of growing media 17
3.6 Experimental environment 17
3.7 Growing media preparation for seedling raising 18
3.8 Seed sowing 18
3.9 Transplanting of cherry tomato seedling 18
3.10 Intercultural operations 18
iv
3.11 Harvesting 19
3.12 Data collection 19
3.13 Statistical analysis 22
CHAPTER IV RESULTS AND DISCUSSION 23
4.1 Plant height 23
4.2 Branch number per plant 26
4.3 Number of leaves per plant 29
4.4 Length of leaflet 30
4.5 Breadth of leaflet 31
4.6 Chlorophyll percentage 33
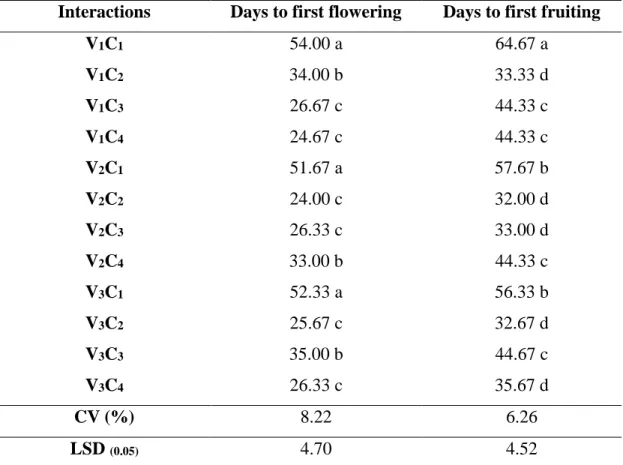
4.7 Days to first flowering 36
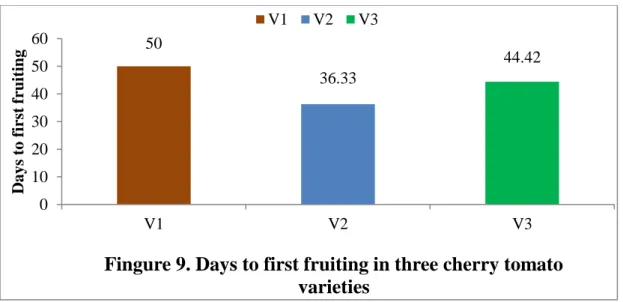
4.8 Days to fist fruiting 38
4.9 Number of flower cluster per plant 41
4.10 Number of flowers per plant 42
4.11 Number of fruit per plant 44
4.12 Length of individual fruit 47
4.13 Diameter of individual fruit 49
4.14 Weight of individual fruit 51
4.15 Total soluble solids (0Brix) content 53
4.16 Yield per plant 55
CHAPTER V SUMMARY AND CONCLUSION 58
CHAPTER VI REFERENCES 62
CHAPTER VII APPENDICES 70
v
LIST OF TABLES
TABLE
NO. TITLE PAGE
NO.
1 Combined effect of different varieties and calcium on plant height of cherry tomato at different days after transplanting (DAT)
26 2 Interaction effect of different varieties and calcium on branch number
per plant of cherry tomato at different days after transplanting
29 3 Leaves number/plant, length of leaflet and breadth of leaflet of three
cherry tomato varieties
32 4 Effect of different level of calcium on leaves number/plant, length of
leaflet and breadth of leaflet of cherry tomato
32 5 Interaction effect of different varieties and calcium on leaves
number/plant, length of leaflet and breadth of leaflet of cherry tomato
33 6 Interaction effect of different varieties and calcium on chlorophyll
percentage of cherry tomato at different days after transplanting
36 7 Combined effects of different varieties and calcium on days to first
flowering and days to first fruiting from transplanting
40 8 Interaction effects of different varieties and calcium on number of
flower cluster per plant, number of flower/plant and number of fruit/plant
47
9 Interaction effect of different varieties and calcium on yield attributing characteristics of cherry tomato
53
vi
LIST OF FIGURES
FIGURE
NO. TITLE PAGE
NO.
1 Plant height of three cherry tomato varieties at different days after transplanting (DAT)
24 2 Effect of different levels of calcium fertilizer on plant height of
cherry tomato at different (DAT)
25 3 Branch number per plant of three cherry tomato varieties at different
DAT
27 4 Effect of different level of calcium on branch number per plant of
cherry tomato at different DAT
28 5 Chlorophyll content (%) of three cherry tomato varieties at different
DAT
34 6 Effect of different level of calcium on chlorophyll content (%) at
different DAT
35 7. Days to first flowering of three cherry tomato varieties 37 8. Effect of different calcium levels on days to first flowering in cherry
tomato
38 9. Days to first fruiting in three cherry tomato varieties 39 10. Effect of different levels of calcium on days to first fruiting in cherry
tomato
39 11. Number of flower cluster per plant in three cherry tomato varieties 41 12. Effect of different levels of calcium on the number of flower cluster
per plant
42 13. Number of flower per plant in three cherry tomato varieties 43 14. Effect of different levels of calcium on the number of flower per
plant in cherry tomato
44 15. Number of fruit per plant in three cherry tomato varieties 45 16. Effect of different level of calcium on the number of fruit per plant in
cherry tomato
46 17. Length of individual fruit of three cherry tomato varieties 48
vii
FIGURE
NO. TITLE PAGE
NO.
18. Effect of different level of calcium on the length of individual fruit 49 19. Diameter of individual fruit in three cherry tomato varieties 50 20. Effect of different doses of calcium on the diameter of individual
fruit
50 21. Individual fruit weight of three cherry tomato varieties 51 22. Effect of calcium on individual fruit weight of cherry tomato 52 23. Total soluble solids content of three cherry tomato varieties 54 24. Effect of different doses of calcium on total soluble solids content of
cherry tomato
54 25. Combined effect of varieties and calcium on total soluble solids
content of cherry tomato
55 26. Yield per plant (kg) in three cherry tomato varieties 56 27. Effect of different level of calcium on yield per plant (kg) in cherry
tomato
57 28. Combine effect of varieties and calcium on yield per plant in cherry
tomato
57
viii
LIST OF PLATES
PLATE
NO. TITLE PAGE
NO.
1 Growing media and cherry tomato plant after transplanting 72
2 Immature and mature fruit cluster 73
3 Data collection 73
4 1st harvested cluster of cherry tomato 73
ix
LIST OF APPENDICES TABLE
NO.
TITLE PAGE
NO.
1 Map showing the experimental site 70
2 Analysis of variance of data on plant height of cherry tomato at different days after transplanting
71 3 Analysis of variance of data on branch per plant of cherry tomato at
different days after transplanting
71 4 Analysis of variance of data on Leaves/Plant, Length of Leaflet and
Breadth of Leaflet of cherry tomato
71 5 Analysis of variance of data on chlorophyll percentage of cherry
tomato at different days after transplanting
71 6 Analysis of variance of data on days of first flowering, days of first
fruiting, flower cluster per plant, flower/plant and fruit/plant of cherry tomato
72
7 Analysis of variance of data on yield attributing characteristics of
cherry tomato 72
x
LIST OF ABBREVIATIONS AND ACRONYMS Abbreviation Full meaning
AEZ Agro-Ecological Zone
Agric. Agriculture
Agril. Agricultural
BBS Bangladesh Bureau of Statistics BCPC British Crop Production Council
cm Centi-meter
CV Coefficient of variation
oC Degree Celsius
df Degrees of freedom
DAT Days After Transplanting
et al. And others
FAO Food and Agriculture Organization
g Gram
ha Hectare
CRSP Collaborative Research Support Program
J. Journal
kg Kilogram
LSD Least Significant Difference
mg Milligram
MoP Muriate of Potash
CRD Completely Randomized Design SAU Sher-e-Bangla Agricultural University
TSP Triple Superphosphate
1 CHAPTER I INTRODUCTION
Cherry tomato (Lycopersicon esculentum var. cerasiforme) is regarded as a botanical variety of the cultivated tomato which is round in shape, similar to a cherry juicy and meaty berry, bigger than 1.5 cm in diameter (Silva and Giordano, 2000). Various colorful cherry tomatoes were found like Red, Black, Green, Bi-Color, White, Stripped, Yellow-Orange and Pink cherry tomato. Commonly cherry tomato is called garden tomato for its size and shape. Its size and shape depend on the range in size from a thumb tip up to the size of a golf ball, and can range from being spherical to slightly oblong in shape (Prema, 2011). It is the sort of tomato, where as it belongs to the Solanaceae family. However, cherry tomato is now very popular in the whole world for its nutritive value, taste and attractive color. Furthermore, it has high content of vitamin A, C and sugar, low calories, lycopene and β- carotene (Rosales, 2011). Use of cherry tomatoes is now available for meal decoration of home, hotel and restaurant. Especially, children like to eat cherry tomato. Fruit set can easily occur in comparatively high temperature which is very significant for tropical climate. Furthermore, Cherry tomatoes are source of germplasm for providing disease resistance and adaptability to cool and hot seasons (Anon, 2009). In Bangladesh, cherry tomato is new type for tomato production and still infancy for farmer field and as well as for consumer market. Due to the awareness of food consumption and nutritive status of Bangladeshi people, cherry tomato can supply both of demand. In general, with ever increasing demand, it has become imperative to develop high yielding varieties with resistance to biotic and abiotic stresses and suitable to fresh market and processing. Hence, identification of qualitative character is another important feature for cherry tomato. Moreover, farmer should know the targeted variety for growth and production of cherry tomato.
2
Therefore, potential value of cherry tomatoes has to be improved by evaluating the cultivated species for its desirable characters under various agro climatic regions.
Besides, cultivars and cultural practices, many biotic and abiotic factors also limit the yield of tomato crop. (Ali et al., 2014). Abiotic stresses like changes in environmental conditions and nutrition results in physiological disorders ultimately decrease crop yield (Khavari-Nejad et al., 2009).
Nutrient management is essential to maximize crop yield (Menzel and Simpson, 1987), enhance fruit quality and increase profitability (Ganeshamurthy et al., 2011). Tomato plant requires macro and micro nutrients for growth and development as well as to complete its life cycle (Brady and Weil, 2002). Essential nutrients are needed for optimum plant growth and development (Fageria, 2005; 2007; Fageria and Baligar, 2005). Soil characterized by high pH limits micronutrients availability to the plant (Ibrahim et al., 2008). Thus, application of essential nutrients enhances the uptake and utilization of nutrients (Phillips et al., 2004) and decrease nutrients deficiency related disorders.
The nutrients required in large quantity are supplied through soil application (Fageria et al., 2009) but nutrients needed in lower quantity can be better absorbed through foliar spray (Fageria et al., 2009; Girma et al., 2007). Treatments with CaCl2 have been found to have better preservation quality on tomato fruits (Genanew, 2013). Calcium (Ca) is an essential macronutrient (Kadir, 2005) and tomato fruits contain calcium levels ranging from 3.08 to 16.42 mg 100/g (Anjum et al., 2020), which may be deficient in plants either due to low calcium in soil, low calcium availability due to high soil pH, and low mobility in the plants especially to the fruits (Kadir, 2005; Peter, 2005) and which can be an effective treatment in reducing physiological disorder (blossom end rot), increasing the fruit firmness, delaying the ripening process, and ethylene
3
production in tomatoes (Abbasi et al., 2013). CaCl2 delays the fruit color development in tomato fruits by slowing down the ethylene production and respiration rate, thereby extending the shelf life of fruits (Anjum et al., 2020). The physiological weight loss of tomato fruits declined up to 19% by applying 0.25% of CaCl2, which maintained the higher firmness during storage (Bhattarai and Gautam, 2006). The foliar application of Ca (0.5% CaCl2) in sweet cherry increases the Ca concentration in fruits and substantial changes in the levels of numerous primary and secondary metabolites (Michailidis et al., 2021).
The ability of calcium to form intermolecular linkages gives it an important role in maintaining the integrity and structure of membranes and cell walls (Hirshi, 2004). In plants, calcium also plays a role similar to a hormone in the regulation of various cell functions (Demidchik et al., 2018). One such function is in the regulation of the protein pump that controls the uptake and movement of nutrients into the root and throughout cells within the plant. At the root level, calcium activates and leads to stimulation of the protein channels that take up nutrients (DiMeglio and Imel, 2019). Adequate availability of calcium at the root surface is required for this process to work effectively (Gweyi, 2015). Saline conditions predispose crops to calcium deficiency by decreasing water uptake (Oshunsanya et al., 2019). This calls for the need to undertake soil tesing before any crop production venture. The movement of calcium in tomato is virtually confined to the xylem and transport of absorbed calcium to the shoots is subdued by salinity (Oshunsanya et al., 2019).
Therefore, a continuous supply of calcium is required for leaf development, plant canopy, and vigorous root growth (Del-Amor and Marcelis, 2006). Foliar fertilization can supplement soil fertilization to maximize crop yield (Fageria et al., 2009). Low levels of Ca in fruit tissues can also cause blossom end rot, which is a physiological
4
disorder that reduces the yield of many vegetables such as tomato (Tonetto de Freitas et al., 2011). Fruit cracking is one of the primary causes of reduced quality and market value in tomatoes and require attention to minimise losses experienced by farmers.
Therefore, supplemental calcium or manipulation of calcium nutrition through pruning or water management may prevent radial cracking of tomoato fruit or reduce cuticle cracking (Dorais et al., 2001).
Varieties associated with proper calcium fertilizer is an important factor for successful cherry tomato production. The combined effect of these production practices have not been defined clearly and the information in this respect is meagre in Bangladesh.
Considering the above facts, the experiment has been undertaken with the following objectives:
• To identify the effect of calcium (Ca2+) on the growth and yield contributing characters of cherry tomato,
• To study the morphological characters of some cherry tomato varieties under different level of calcium application; and
• To study the combined effect of variety and calcium application on the growth and yield of cherry tomato.
5 CHAPTER II
REVIEW OF LITERATURE
The purpose of this chapter was to review the literatures having relevance to the present study. The review of literature of the past studies and opinions of the researchers pertinent to the present experiment were collected through reviewing of journals, thesis, reports and other form of publications. The information were compiled and presented below:
2.1. Effect of calcium (Ca)
2.2.1 Effect of Ca on growth and yield
Mazumder et al. (2021) carried out an experiment to determine the effect of pre-harvest treatments of CaCl2 solution (0.0%, 1.0%, 1.5% and 2.0% w/v) on the growth, yield, quality, and shelf-life performance of tomato varieties. Spraying with 2% of CaCl2
showed an improvement in controlling physiological disorders such as blossom end rot (BER), weight loss, declined disease incidence, and disease severity as well as performed better in growth, yield, quality and shelf-life performance compared to other CaCl2 treatment.
Lavanya and Bahadur (2021) conducted an experiment to identify the effect of calcium and boron on yield and quality of cherry tomato and to find out suitable method in cherry tomato at VRF SHUATS, Naini (Prayagraj) India, during rabi season 2019-20.
It was concluded from the investigation that foliar application with increasing levels of Ca and B from 0% to 0.6% exhibited significant increase in morphological characters as well as yield attributes of cherry tomato. The maximum net returns and (B:C) ratio was obtained in treatment fertilized with 0.6% of calcium + 0.6% of boron which resulted in higher yield and consequently maximum (B:C) ratio (3.45).
6
Sturiao et al. (2020) conducted a study on deficiency of calcium affects anatomical, biometry and nutritional status of cherry tomato. For this study it can be concluded that, the best responses of biometric and production variables, as well as the better nutritional plant status occur with estimated concentrations from 6.0 to 7.0 mmol L−1 Ca in nutrient solution.
Azad et al. (2019) conducted a study to investigate the influences of calcium and mulching practices on yield and fruit quality of tomato. The trials comprised three factors: 1) three tomato varieties viz, BARI F1 Tomato-5, BARI F1 Tomato-6 and BARI F1 Tomato-7; 2) four levels of calcium (Ca) treatment (40 ppm, 60 ppm, 80 ppm, 120ppm) and 3 mulching practices. Results suggested that BARI F1 Tomato-5 variety receiving 80 ppm calcium treatment with mulching condition exposed better quality, yield and yield contributing characters of tomato.
Pinero et al. (2018) conducted a study on sweet pepper fruit quality disorders as affected by foliar Ca applications to mitigate the supply of saline water under a climate change scenario. High CO2 favoured generative growth instead of vegetative growth. Foliar Ca supply did not affect the marketable yield, but reduced the total yield when combined with salinity and 400 µmol mol-1 CO2. Salinity affected negatively the total yield but this was overcome when CO2 was applied. The B and K concentrations were reduced by foliar Ca application, while Ca and Mn were increased at 400 µmol mol-1 CO2. The effect of Ca application differed according to the other treatments applied. This procedure should be optimized to overcome future climate impacts on fruit quality.
Effect of calcium, boron, and zinc foliar application on growth and fruit production of tomato was investigated during the year 2013 at ARI Tarnab, Peshawar to optimize calcium, boron and zinc concentration for enhancing the growth and fruit related attributes of tomato. The experiment was conducted using Randomized Complete
7
Block (RCB) Design with 3 factors, replicated 3 times. Calcium (0, 0.3, 0.6 and 0.9%), Boron (0, 0.25, 0.5%) and Zinc (0, 0.25, 0.5%) were applied as foliar spray three times.
Calcium application at 0.6% increased plant height (88.04 cm), number of primary (2.63) and secondary (7.15) branches, leaves plant-1 (182), leaf area (65.52 cm2), and fruit per plant (66.15). In case of B levels, more plant height (88.14 cm), number of primary (2.61) and secondary (7.44) branches, number of leaves plant-1 (177), number fruits plant-1 (67.78) were recorded with foliar spray of B at 0.25%, while maximum leaf area was found at 0.5% B. Comparing the means for Zn concentrations, maximum plant height (86.53 cm), number of primary (2.53) and secondary (6.42) branches, leaves plant-1 (167), leaf area (63.33 cm2), and fruit per plant (63.78) were higher with 0.5% foliar Zn application. The interaction between Ca, B and Zn also showed significant results for most of the attributes. Therefore, application of Ca (0.6%), B (0.25%), and Zn (0.5%) as a foliar spray can be used alone or in combination to improve growth and fruit production of tomato (Haleema et al., 2018).
Islam et al. (2016) conducted an experiment to investigate the effect of foliar spraying with boron and calcium on the qualities of light red maturity-stage ‘Unicorn’ cherry tomato. These results indicate that B and Ca treatment increases cell -wall compactness, reduces the respiration rate, reduces fresh weight loss, increases shelf life, maintains flesh firmness, and increases vitamin C content in cherry tomato.
An experiment was conducted by Kabir et al. (2013) on the growth and yield of groundnut with phosphorus, calcium and boron and reported that the highest plant height (59.68cm), dry matter content (31.1 g), CGR (20.39 g m-2 d-1), highest branches per plant (7.22) was obtained from Ca2 (165 kg Ca ha-1) and the lowest one (47.18 cm) was found at control (0 kg Ca ha-1).
8
The role of calcium in tomatoes in plants is quite similar to that in people, it is essential for good growth and structure (Martínez-Andújar et al., 2016). Calcium plays a fundamental role in membrane stability, cell wall stabilization and cell integrity (Hirshi, 2004). Insufficient calcium levels lead to deterioration of the cell membrane, the cells become leaky resulting in the loss of cell compounds and eventually death of cell and plant tissues (Biswas et al., 2016). Reduced calcium in edible tomato fruit tissues negatively impacts total yield. Tissues low in calcium are more susceptible than with normal calcium levels to some parasitic diseases during storage. The problems associated with a low plant calcium level can be attributed to soil problems. e.g calcium deficiencies are prevalent in very low soil pH and on soils high in magnesium and potassium (Esfandiarpour-Borujeni et al., 2018). Calcium also plays a role in regulating various cell and plant function as a secondary messenger (Ranty et al., 2016). This function as a secondary messenger assists in various plant functions from nutrient uptake to changes in cell status to help react to the impact of environmental and disease stresses (Ho and White, 2005). Calcium is crucial regulator of growth and development in tomatoes.
9 Source: White and Broadley (2003)
Halina et al. (2016) conducted an experiment to evaluate the effects of foliar Ca feeding on the yield of sweet pepper „Caryca F1‟ and on selected elements of its fruit quality in field ground cultivation. Ca was applied in the form of the following preparations:
10
Ca(NO3)2, Insol Ca, or Librel Ca. Calcium preparations were applied on 3 or 5 dates in 1% concentration of the solution to the full wetting of the plants. A positive influence of Ca feeding on the marketable yield of the fruit was observed: 4.26–4.63 kg m–2 as compared with the controls at 3.80 kg m–2. Calcium foliar feeding caused a limited number of fruits with BER symptoms at 4.3%–5.2% of the total number of fruits, as compared with 14.4% of those of the control fruits. The use of Ca(NO3 )2 had a positive effect on the accumulation of vitamin C and carotenoids as compared with other fertilizers. Reduced Ca spraying proved to be beneficial in terms of fruit yield and concentrations of carotenoids.
Rubio et al. (2010) investigated a study on the influence of Ca2+ and K+ levels on fruit yield and quality of sweet pepper (Capsicum annuum L. cv. Orlando) plants under hydroponic culture. The treatments consisted of three concentrations of Ca2+ (1.5, 4 and 8 mmol L–1) and K+ (2.5, 7 and 12 mmol L–1) that were imposed separately. Fruit yield parameters and different fruit quality parameters, as well as dry matter production and mineral composition in individual parts of the plant, were determined. The increase of Ca2+ in the root medium increased the marketable yield from 1.67 to 2.38 kg plant–1, mainly due to an increase in the number of fruits per plant, while higher K+ levels decreased marketable yield from 2.2 to 1.66 kg plant–1, due to decreases in the number of fruits per plant and the mean fruit weight. With respect to fruit quality, fruit shape index and, therefore, pepper fruit appearance improved with Ca2+ addition to the root medium. Fertilization with K+ increased fruit acidity and decreased maturity index, which could improve fruit storability. Low Ca2+ or high K+ levels reduced both root and shoot dry matter. Therefore, an adequate management of fertilization with Ca2+ and K+ could improve the yield and fruit quality of pepper grown in soilless culture.
11 2.1.2 Role of Ca on crop protection
Manaf et al. (2017) reported that the amounts of Ca in soil solution are usually high enough to provide for all plant demands. Ca-deficiency in plants is a physiological disorder, and occurs only rarely as a result of low Ca levels in the soil. Ca-deficiency symptoms in plants do not generally disappear simply by raising the Ca level of the soil. Therefore, it is important to understand the mechanisms of Ca2+ ion uptake, transport, and distribution in plants. Any factor inhibiting root growth, such as low temperature, inadequate aeration, poor nutrient status, or high H+ ion concentration, can thus restrict Ca uptake and hence impair Ca translocation because of the absence of young root tip cells.
For most crops which include tomatoes, net photosynthesis declines as temperatures increase to 34oC, and calcium is able to mitigate heat stress effects by improving stomatal function and other cell processes (Patterson, 2008). Calcium is also believed to have an influence on the development of shock proteins that help the plant tolerate the stress of prolonged heat (Patterson, 2008). In addition, calcium plays a major role in the quality and shelf life of tomatoes. Excessive calcium restricts plant communities’
growth in calcareous soils and this too affect tomato production if grown in these types of soils (Shukla et al., 2018). Calcium deficiency is rare in nature, but may occur in soils with low base saturation and/or high level of acidic deposition (Havlin et al., 2016).
12 Source: White and Broadley (2003)
Manaf et al. (2017) executed a greenhouse experiment to evaluate the impact with two concentrations (5 and 10 mM l-1) of calcium chloride (CaCl2) foliar application on growth parameters, yield and some biochemical constituents and blossom-end rot
13
(BER) incidence of sweet pepper (Capsicum annuum L.) under drought stress. The obtained results indicated that CaCl2 foliar application CaCl2 with under both irrigation regimes achieved an increment in most of growth parameters, yield and some biochemical constituents. On the contrary, the same applications led to decrease BER incidence in the plants under normal irrigation or water deficiency. However, no- significant effect of CaCl2 was observed on chlorophyll a/b ratio, carotenoids and carotenoids/chlorophyll a+b.
Manaf et al. (2017) reported that Ca sprays help to prevent Ca-deficiency disorders in plants. Ca-deficiency-related disorders are usually linked to the inability of a plant to translocate adequate Ca to the affected part rather than insufficient levels of soil Ca. Ca is a relatively immobile element in plants. Foliar sprays can be used to correct these deficiencies. It is important to cover any young terminal growth with Ca, as application on the older leaves will not benefit the plant.
The increase in the number of fruit of tomato with Ca application might be due the higher uptake of phosphorus that resulted in more flower cluster and enhanced fruits plant-1 in tomato plant (Ilyas et al., 2014). Moreover, calcium may also inhibit flower abscission and, thus, results in increased fruits plant-1.
The combination of Ca+ and B was more effective in increasing fruits plant-1. Similarly, B and Zn promote the translocation of carbohydrate from site of formation to sinks that resulted in increased fruits plant-1 (Singh and Tiwari, 2013).
Ayyub et al. (2012) who reported that tomato plant height, generally, respond positively to foliar application of Ca and increases vegetative or shoot growth of tomato plant.
Kerton et al. (2009) reported that Ca is not recycled when deposited in leaf tissue. Ca flows through the plant in the xylem (White and Broadley, 2003), mostly passively, with the water flow caused by transpiration.
14
Fedrizzi et al. (2008) found that a Ca signal is involved in the regulation of cell division and Ca can be found in the mitotic spindle. Ca is also critical in signal transduction path ways by binding with calmodulin, a cytosolic plant protein.
Tomato fruits that take up B and Ca have better firmness than the control because these treatments may lead to pectin bonding to stabilize cell-wall structure. Ca-treated strawberries contain fewer soluble solids and higher acidity than the control (Hemandez-Munoz et al., 2006, Singh et al., 2007).
Lecourieux et al. (2006) described Ca ions as a second messenger in numerous plant signaling pathways, conveying a wide range of environmental and developmental stimuli to elicit the appropriate physiological responses.
Lecourieux et al. (2006) found that calmodulin is a highly conserved and broadly distributed Ca-binding protein which acts as a multifunctional intermediary by connecting Ca signals to the activation of other cellular components.
Ho and White (2005) showed that Ca controls cell expansion by influencing the incorporation into the plasma membrane of vesicles containing the materials and enzymes required for cell membrane and cell wall construction.
Shoba et al. (2005) conducted a field experiment in Tamil Nadu, India, during the 2002 rabi season, to investigate the effects of calcium (Ca) and boron (B) fertilizer and ethrel [ethephon] applications and 45x45 and 65x45 spacings against fruit cracking in the tomato genotypes LCR 1 and LCR 1 x H 24. Between the 2 genotypes, the fruit cracking percentage was low in LCR 1 x H 24. Among the 2 spacings, closer spacing showed less fruit cracking and among the different nutrient treatments, the spraying of B with Ca was effective in controlling fruit cracking.
15
Ca-interacts with B, which has a stabilizing influence on Ca complexes in the middle lamella of fresh-market tomatoes (Huang and Snapp, 2004). As cell compactness increases, so does shelf life; as a result, tomatoes retain their firmness longer.
Increasing Ca levels in fruit during development leads to increased firmness (Agusti et al., 2004), and Ca-treated tomatoes contain higher Ca levels than the control (Liebisch et al., 2009, Lee and Kim, 2010), as Ca uptake increases in these tomatoes, leading to Ca-pectate bonding. Ca treatment increases calcium pectate levels.
Tomato (Lycopersicon esculentum Mill.) 'Trust' was grown on rockwool with two concentrations of calcium (150 and 300 mg L-1) in combination with four concentrations of magnesium (20, 50, 80 and 110 mg L-1) in fall, 1999, to investigate their effects on plant growth, leaf photosynthesis, and fruit yield and quality (fruit firmness, dry matter, soluble solids and russeting). High Ca (300 mg L-1) concentration increased fruit yield and reduced the incidence of blossom-end rot (BER) and fruit russeting, compared with the low Ca concentration (150 mg L-1). High Ca concentration reduced fruit firmness but did not affect fruit size and leaf photosynthesis (Hao and Papadopoulos, 2003).
White and Broadley (2003) experimented that Ca is required for various structural roles in the cell wall and in membranes. Ca is essential for the synthesis of cell walls. Ca is bound as Ca-pectate in the middle lamella and it is essential for strengthening cell walls and plant tissues.
Kleemann (2000) demonstrated that spraying with Ca reduced the incidence of Ca- deficiency injury in plants.
16 CHAPTER III
MATERIALS AND METHODS 3.1. Experimental site and period
The pot experiment was conducted in the semi-greenhouse at the Horticulture Farm of Sher-e-Bangla Agricultural University, Dhaka 1207, during October 2019 to March 2020.
3.2. Experimental location
The location of the study site was situated in 23°74′N latitude and 90°35′E longitudes.
The altitude of the location was 8m from the sea level as per the Bangladesh Metrological Department, Agargaon, Dhaka-1207, which have been shown in the Appendix I.
3.3. Plant and other materials
The study included three cherry tomato varieties, viz. Red Star F1, Sweet Charlie F1 and Thai Pink Egg. The seeds of the varieties were collected from Siddik Bazar, Gulistan, Dhaka. The styrofoam, cocopeat, earthen pot, plastic tray, plastic pipe, polythene sheet, etc. were collected from Town Hall, Mohammadpur, Dhaka. Experimental chemicals were bought from Agargaon Nursery, Dhaka. Different types of daily instruments also used from many purposes to complete the experiment.
3.4. Experimental Design and treatments
The experiment was conducted in a Completely Randomized Design (CRD) with three replications. Two factors were considered as treatments denoted as V (Different Varieties) and C (Different level of Calcium).
17 Factor-A: Different Cherry tomato varieties
V1= Red Star F1 V2= Sweet Charlie F1 V3= Thai Pink Egg Factor-B: Different Calcium levels
C1= 0 ppm C2= 40 ppm C3= 80 ppm C4= 120 ppm
There were 12 (3 × 4) treatments combination such as V1C1, V1C2, V1C3, V1C4, V2C1, V2C2, V2C3, V2C4, V3C1, V3C2, V3C3 and V3C4.
3.5. Preparation of growing media
The mixture of coco peat and khoa were used to make the growing media. Coco peat blocks were also soaked a plastic container for overnight. The soaked coco peat was washed well in water and spread in a polythene sheet for three hours. Then three ingredients coco peat, khoa and vermicompost @ 60%, 30% and 10% were mixed according to mixer ratio.
3.6. Experimental environment
Round eight inch 36 earthen pots were prepared for culturing the plants. Polythene sheet was placed in the surface of the soil. Pots were filled with different substrates mixture according to the ratio. For seedling growing, Styrofoam box filled with media mixture of coco peat, brick broken and vermicompost at the ratio of 6:3:1 (w/v). Two-week-old seedlings were transferred into the earthen pots. The experiment was conducted in a white net house under intensive care. The room was kept clean and tidy during the time of the experiment. Daily supervision was maintained to protect plants. The plants were cultivating and it continued until March 2020.
18
3.7. Growing media preparation for seedling raising
The mixture of coco peat, broken bricks (khoa) and vermicompost at the ratio of 60:30:10 (w/v). Coconut block was soaked in a big bowl for 24 hours. Then they are mixed with khoa and vermicompost properly. This mixer was placed in a styrofoam sheet box for using seedbed.
3.8. Seed sowing
The seeds were soaked in water for 24 hours and then wrapped with piece of thin cloth.
The socked seed were then spread over polythene sheet for 2 hours to dry out the surface water. After that seeds were sown in styrofoam sheet box and covered with newspaper under room temperature for rising seedling.
3.9. Transplanting of cherry tomato seedling
15 days old cherry tomato seedlings were transferred to earthen pot contains the mixture of coco peat, khoa and ash. After four weeks these seedlings were transplanted to the main 12-inch earthen pot. The plants were transplanted carefully so that the roots were not damaged. After transplanting of tomato plant in the plastic pot light watering was done with sprayer so that the plant was got proper moisture.
3.10. Intercultural operations 3.10.1. Pruning
Four weeks after transplanting, the lower yellow leaves were removed, allowing plants to develop an adequate vegetative frame before fruit set.
3.10.2. Irrigation
Immediately after transplanting, light irrigation to the individual pot was provided to overcome water deficit. After establishment of seedlings, each pot was watered in alternate days to keep the soil moist for normal growth and development of the plants.
During pre-flowering stage, irrigation was done sincerely.
19 3.10.3. Weeding
No weeding was done in the experiment.
3.10.4. Stalking
Firstly, a bamboo stick was used for support cherry tomato plant. Secondly, a small plastic pipe was cut roundly different pieces. Then it used as a hook in plant base and plastic rope used for support the plant.
3.10.5. Insect management
Cherry tomato plants were grown in controlled environment. So, no insecticides were applied in the experiment.
3.10.6. Diseases management
Cherry tomato plants were grown in controlled environment in hydroponic system and all nutrients required for plant were supplied artificially to the plants. The growing environment was clean and no disease attacked to the plant.
3.11. Harvesting
The crop was harvested after 120 and 150 DAT. Harvesting of the crop was done according to treatment.
3.12. Data collection 3.12.1. Plant height (cm)
Plant height was measured in centimeter (cm) by a meter scale at 20, 40 and 60 DAT (days after transplanting) from the point of attachment of growing media up to the top of the trunk.
3.12.2. Number of branches per plant
Total number of branches per plant was counted from the plant of each of unit pot. Data recorded at 20 days interval started from the 20 days of planting up to 60 days.
20 3.12.3. Number of leaves per plant
Total number of leaves per plant was counted from the plant of each of unit pot. Data was recorded at 20 days interval started from the 20 days of planting up to 60 days.
3.12.4. Length of leaflet (cm)
The length of leaflet was measured with a scale from the neck of the leaf to the bottom of 10 selected leaves from each plant and their average was taken in cm.
3.12.5. Breadth of leaflet (cm)
The breadth of leaflet was measured with a scale from 10 selected leaves from each plant and their average was taken in cm.
3.12.6. Chlorophyll contents (SPAD value)
Leaf chlorophyll content as SPAD values were measured from the youngest fully expanded leaf in the third position from the tip by a portable chlorophyll meter (SPAD- 502, Konica Minolta Sensing, Inc., Japan). The SPAD-502 chlorophyll meter can estimate total chlorophyll amounts in the leaves of a variety of species with a high degree of accuracy and is a nondestructive method. Data was recorded at 25 days interval started from the 25 days of planting upto 75 days.
3.12.7. Days to first flowering
The date of flower blooming was recorded from the number of days of 1st the date of flower blooming after transplanting.
3.12.8. Number of flower cluster per plant
Total number of flower cluster of individual plant was recorded.
3.12.9. Number of flowers per plant
Total number of flower cluster of individual plant was recorded.
21 3.12.10. Days of first fruit initiation
The date of fruiting was recorded from the number of days of 1st the date of fruiting after transplanting of cherry tomato.
3.12.11. Number of fruits per plant
Number of fruits per plant were counted at 75 (First harvesting), 120 (Second harvesting) and 180 (Third harvesting) DAT. All the fruits of each plant were counted separately. Only the smallest young fruits at the growing point of the plant were excluded from the counting and the average number was recorded.
3.12.12. Fruit length (cm)
The length of fruit was measured with a slide caliper from the neck of the fruit to the bottom of 5 individual fruits from individual plant three times and their average was taken and expressed in cm.
3.12.13. Fruit diameter (cm)
Diameter of fruit was measured at middle portion of 5 individual fruits from individual plant three times with a slide caliper. Their average was taken and expressed in cm.
3.12.14. Individual fruit weight (g)
The fresh weight of 5 individual fruits from individual plant was recorded by an electric balance three times and the mean value was calculated by the following formula:
Individual fruit weight =Total weight of fruits per plants Total number of fruits per plant 3.12.15. Total soluble solids (% Brix)
Total soluble solid (TSS) content of pineapple pulp was estimated by using Abbe refractometer. A drop of pulp solution squinted from the fruit pulp was placed on the prism of refractometer. Percent TSS was obtained from direct reading of the instrument.
22 3.12.16. Yield per plant
Yield of cherry tomato per plant was recorded as the whole fruit per plant harvested in different times and was expressed in kilogram.
3.13. Statistical analysis
The data in respect of yield, quality and yield components were statistically analyzed to find out the significance of the experimental results. The means of all the treatments were calculated and the analysis of variance for each of the characters under study was performed by “F” test. The difference among the treatment means were evaluated by Least Significant Difference (LSD) test and interpretation of the results were determined by Duncan’s Multiple Range Test (DMRT) according to Gomez and Gomes, (1984).
23 CHAPTER IV
RESULTS AND DISCUSSION 4.1. Plant height
The variation in plant height at different days after transplanting (DAT) among the studied varieties was statistically significant (Figure 1). At 20 DAT, the maximum (52.92 cm) plant height was recorded from V2 (Sweet Charlie F1) and the minimum plant height (46.00 cm) was obtained from V1 (Red Star F1) which was statistically similar with V3 (47.92 cm) treatment. On the other hand, at 40 DAT, the maximum plant height (143.67 cm) was recorded from V2 which was followed by V3 (143.36 cm), while the minimum plant height (107.96 cm) was obtained from control (V1). Similarly, at 60 DAT, the maximum plant height (255.32 cm) was recorded from V2 which was followed by V3 (222.67 cm) treatment, while the minimum plant height (144.17 cm) was found from V1 treatment. Variation of plant height might be due to the genetic variation among the varieties. Mazumder et al. (2021) and Rina (2015) reported in their studies that plant height varied significantly due to use of different groundnut varieties.
Parvin (2012) also found same type of result in tomato. She found that BARI Tomato 15 gives the tallest plant at different days after transplanting.
24
[V1= Red Star F1; V2= Sweet Charlie F1; V3= Thai Pink Egg]
There was significant variation among different doses of calcium in respect of plant height at different stages of growth (Appendix II and Figure 2). The maximum (57.44 cm) plant height was recorded from C2 (40 ppm Ca) which was statistically similar with C3 (53.89 cm) and the minimum plant height (38.00 cm) was found in control (0 ppm Ca) treatment at 20 DAT. On the other hand, at 40 DAT, the maximum plant height (147.37 cm) was recorded from C2 which was statistically identical with C3 (139.67 cm) treatment, while the minimum plant height (118.42 cm) was obtained from control (C1) treatment. Similarly, at 60 DAT, the maximum plant height (233.92 cm) was recorded from C2, while the minimum plant height (184.86 cm) was found from control treatment. It is clear that all calcium levels maintained a lead over control with regard to plant height. The result might be due to the fact that calcium enhances the vegetative growth of tomato plant (Parvin, 2012). She obtained the maximum plant height (33.71 cm, 53.77 cm and 75.33 cm) at (30, 45 and 60 DAT) from T3 treatment (Ca @ 100.0
46 107.96 144.17
52.92 143.67 255.32
47.92 143.36 222.67
2 0 D A T 4 0 D A T 6 0 D A T
Plant height (cm)
Days after transplanting (DAT)
Fi g u re 1 . E f f e c t o f d i f f e re n t v a r i e t i e s o n p l a n t h e i g h t o f c h e r r y t o ma t o a t d i f f e re n t d a y s a f t e r
t r a n s p l a n t i n g ( D AT )
V1 V2 V3
25
kg/ha). Sturiao et al. (2020) and Manivannan et al. (2007) also reported that calcium increased the plant height.
[C1= 0 ppm; C2= 40 ppm; C3= 80 ppm; C4= 120 ppm]
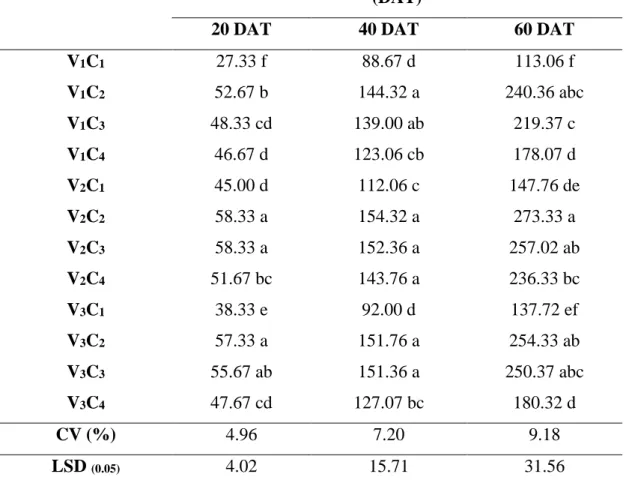
Combination of variety and level of calcium showed significant variation for plant height throughout the growing season (Table 1 and Appendix II). At 20 DAT, the longest plant (58.33 cm) was recorded from the V2C2 (Sweet Charlie F1 variety with 40 ppm Ca) treatment and V2C3 (Sweet Charlie F1 variety with 80 ppm Ca), while the shortest plant (27.33 cm) from V1C1 (Red Star F1 variety with 0 ppm Ca). Similarly, at 40 DAT, the longest plant height (154.32 cm) was recorded from the V2C2 treatment combination which was statistically similar with the V2C3 (152.36 cm), V3C2 (151.76 cm), V3C3 (151.36 cm), V1C2 (144.32 cm) and V2C4 (143.75) treatment while, the shortest plant height (88.67 cm) was recorded from V1C1 treatment combination. At 60 DAT, the tallest plant (273.33 cm) was recorded from V2C2 treatment combination and the shortest plant (113.06 cm) was obtained from V1C1 treatment combination.
38 118.42 184.86
57.44 147.37 233.92
53.89 139.67 208.07
46.44 121.13 202.67
0 50 100 150 200 250
2 0 D A T 4 0 D A T 6 0 D A T
Plant height (cm)
Days after transplanting (DAT)
Fi g u re 2 . E f f e c t o f d i f f e re n t l e v e l s o f b o ro n f e r t i l i z e r o n p l a n t h e i g h t o f c h e r r y t o ma t o a t
d i f f e re n t D AT
C1 C2 C3 C4
26
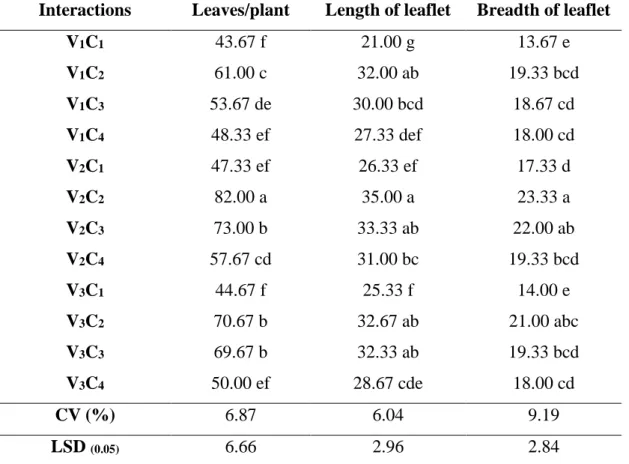
Table 1: Combined effect of different varieties and calcium on plant height of cherry tomato at different days after transplanting (DAT)
Interactions Plant height (cm) at different days after transplanting (DAT)
20 DAT 40 DAT 60 DAT
V1C1 27.33 f 88.67 d 113.06 f
V1C2 52.67 b 144.32 a 240.36 abc
V1C3 48.33 cd 139.00 ab 219.37 c
V1C4 46.67 d 123.06 cb 178.07 d
V2C1 45.00 d 112.06 c 147.76 de
V2C2 58.33 a 154.32 a 273.33 a
V2C3 58.33 a 152.36 a 257.02 ab
V2C4 51.67 bc 143.76 a 236.33 bc
V3C1 38.33 e 92.00 d 137.72 ef
V3C2 57.33 a 151.76 a 254.33 ab
V3C3 55.67 ab 151.36 a 250.37 abc
V3C4 47.67 cd 127.07 bc 180.32 d
CV (%) 4.96 7.20 9.18
LSD (0.05) 4.02 15.71 31.56
In a column means having similar letter(s) are statistically identical and those having dissimilar letter(s) differ significantly as per 0.05 level of probability.
[V1= Red Star F1; V2= Sweet Charlie F1; V3= Thai Pink Egg; C1= 0 ppm; C2= 40 ppm; C3= 80 ppm; C4= 120 ppm]
4.2 Branch number per plant
Statistically non-significant variation was recorded for branch number per plant due to use of different cherry tomato varieties at 20, 40 and 60 DAT (Appendix III and Figure 3). Numerically, at different days after transplanting (DAT) the maximum number of branches per plant (1.58, 3.33 and 4.58) was recorded from V2 (Sweet Charlie F1) at 20, 40 and 60 DAT, respectively. On the other hand, at the same DAT the minimum number of branches per plant (1.42, 3.00 and 4.17) was recorded from V1 (Red Star F1).
27
Mazumder et al. (2021) and Rina (2015) reported in their studies that number of branches varied significantly due to use of different groundnut varieties. Parvin (2012) also found same type of result in tomato. She found that BARI Tomato 15 gives the highest number of branches at different days after transplanting.
[V1= Red Star F1; V2= Sweet Charlie F1; V3= Thai Pink Egg]
Statistically non-significant variation was recorded for branch number per plant of cherry tomato due to application of different doses of calcium at 20 DAT, 40 DAT and 60 DAT (Appendix III and Figure 4). Numerically, at different days after transplanting (DAT) the maximum number of branches per plant (1.56, 3.44 and 4.78) was recorded from C2 (40 ppm Ca) at 20, 40 and 60 DAT, respectively. On the other hand, at the same DAT the minimum number of branch per plant (1.44, 3.00 and 4.22) was recorded from control (C1) condition. Sturiao et al. (2020) and Manivannan et al. (2007) also reported that calcium increased the number of branches.
1.42 3 4.17
1.58 3.33 4.58
1.5 3.33 4.58
0 0.5 1 1.5 2 2.5 3 3.5 4 4.5 5
2 0 D A T 4 0 D A T 6 0 D A T
No. of branch
Days after transplanting (DAT)
Fi g u re 3 . E f f e c t o f d i f f e re n t mu l c h e s o n b r a n c h n u mb e r p e r p l a n t o f c h e r r y t o ma t o a t d i f f e re n t
D AT
V1 V2 V3
28
[C1= 0 ppm; C2= 40 ppm; C3= 80 ppm; C4= 120 ppm]
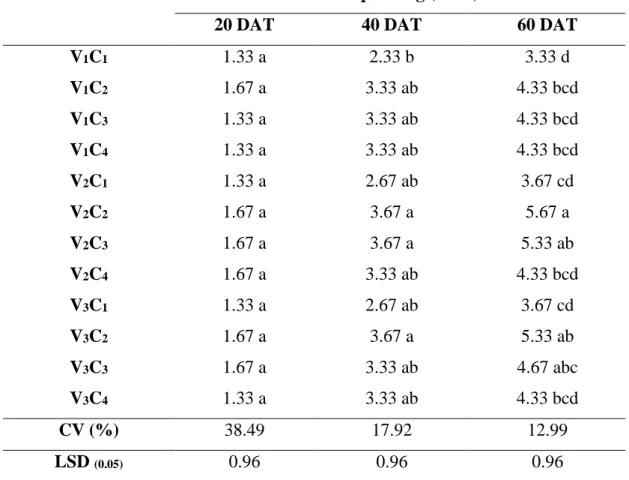
Due to combined effect of variety and calcium also showed significant differences of the branch number per plant of cherry tomato at 40 and 60 DAT (Table 2 and appendix III). Numerically, at different days after transplanting (DAT) the maximum number of branches per plant (1.67, 3.67 and 5.67) was recorded from V2C2 (Sweet Charlie F1
variety with 40 ppm Ca)treatment combination at 20, 40 and 60 DAT, respectively. On the other hand, at the same DAT the minimum number of branches per plant (1.33, 2.33 and 3.33) was recorded from V1C1 (Red Star F1 variety with 0 ppm Ca) treatment combination, respectively.
1.44 3 4.22
1.56 3.44 4.78
1.56 3.22 4.44
1.44 3.22 4.33
0 1 2 3 4 5 6
2 0 D AT 4 0 D AT 6 0 D AT
No. of branch
Days after transplanting (DAT)
Fi g u re 4 . E f f e c t o f d i f f e re n t l e v e l o f c a l c i u m o n b r a n c h n u mb e r p e r p l a n t o f c h e r r y t o ma t o a t
d i f f e re n t D AT
C1 C2 C3 C4
29
Table 2: Interaction effect of different varieties and calcium on branch number per plant of cherry tomato at different days after transplanting
Interactions Branch number per plant at different days after transplanting (DAT)
20 DAT 40 DAT 60 DAT
V1C1 1.33 a 2.33 b 3.33 d
V1C2 1.67 a 3.33 ab 4.33 bcd
V1C3 1.33 a 3.33 ab 4.33 bcd
V1C4 1.33 a 3.33 ab 4.33 bcd
V2C1 1.33 a 2.67 ab 3.67 cd
V2C2 1.67 a 3.67 a 5.67 a
V2C3 1.67 a 3.67 a 5.33 ab
V2C4 1.67 a 3.33 ab 4.33 bcd
V3C1 1.33 a 2.67 ab 3.67 cd
V3C2 1.67 a 3.67 a 5.33 ab
V3C3 1.67 a 3.33 ab 4.67 abc
V3C4 1.33 a 3.33 ab 4.33 bcd
CV (%) 38.49 17.92 12.99
LSD (0.05) 0.96 0.96 0.96
In a column means having similar letter(s) are statistically identical and those having dissimilar letter(s) differ significantly as per 0.05 level of probability.
[V1= Red Star F1; V2= Sweet Charlie F1; V3= Thai Pink Egg; C1= 0 ppm; C2= 40 ppm; C3= 80 ppm; C4= 120 ppm]
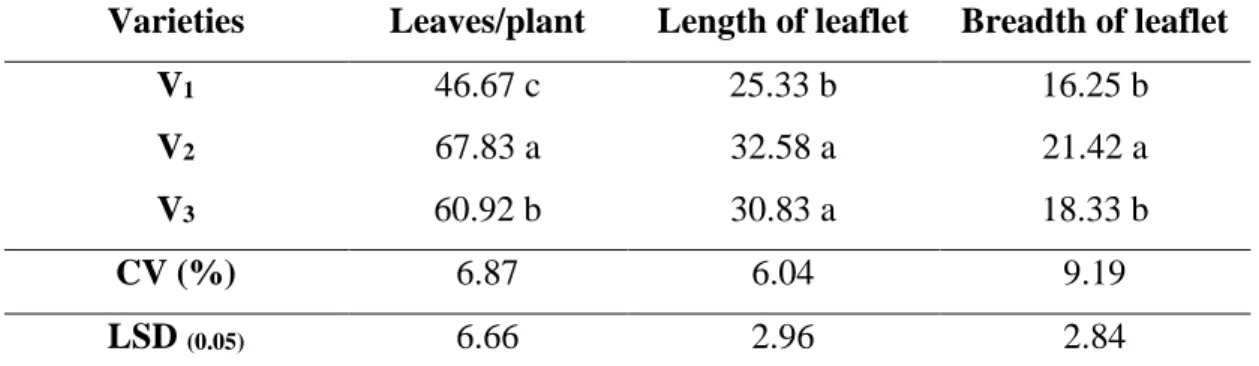
4.3 Number of leaves per plant
Different varieties had significant influences on number of leaves per plant (Table 3 and appendix IV). The maximum number of leaves (67.83) per plant was recorded from V2 (Sweet Charlie F1) treatment which was identical from all other varieties. On the other hand, the minimum number of leaves (46.67) per plant was recorded from V1
(Red Star F1) treatment. Similar trend of results was found by Parvin (2012). She found that BARI Tomato 15 gives the maximum number of leaves per plant at different days
30
after transplanting. Mazumder et al. (2021) and Rina (2015) reported in their studies that number of leaves varied significantly due to use of different groundnut varieties.
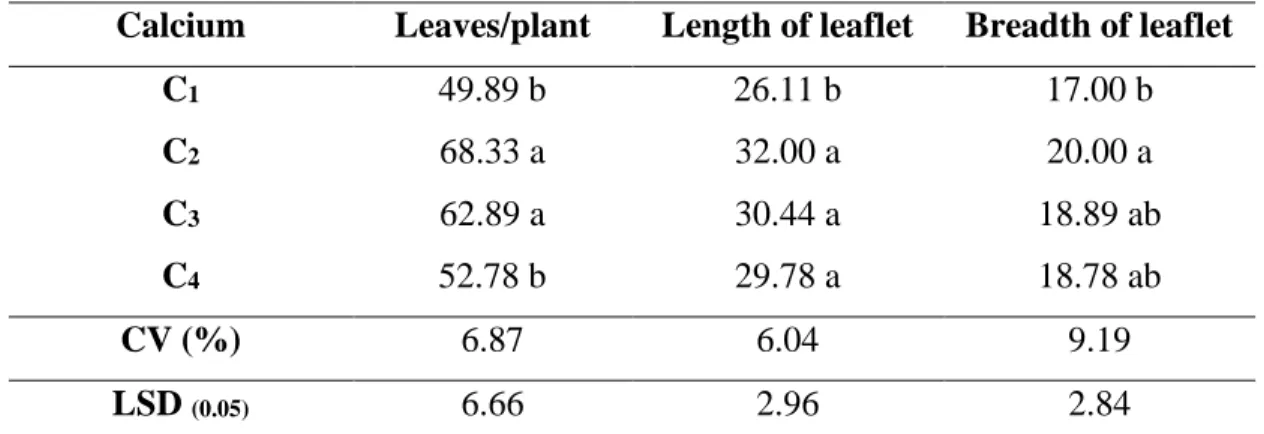
Number of leaves per plant of cherry tomato varied significantly due to application of different level of calcium fertilizer (Table 4 and appendix IV). The maximum number of leaves (68.33) per plant was recorded from C2 (40 ppm Ca) which was statistically similar with C3 (53.89 cm), while the minimum number of leaves (49.89) per plant was recorded from control treatment which was statistically similar with C4 (52.78) treatment. The results agreed with the findings of Azad et al. (2019) and Safarzadeh (2004) who stated that gypsum increased foliage yield by its application at rate of 150 kg ha-1. This fact was supported by other authors like Tzortzakis (2010) in leafy vegetables and Lolaei et al. (2012) in tomato.
Combine effect of varieties and calcium showed statistically significant differences on number of leaves per plant (Table 5 and appendix IV). The maximum number of leaves per plant (82.00) of cherry tomato was recorded from V2C2 (Sweet Charlie F1 variety with 40 ppm Ca) treatment combination while, the minimum number of leaves per plant (43.67) was recorded from V1C1 (Red Star F1 variety with 0 ppm Ca) treatment combination which was statistically similar with V3C1 (44.67) treatment combination.
4.4 Length of leaflet
Leaflet length of cherry tomato varied significantly due to use of different varieties (Table 3 and appendix IV). The longest leaflet length (32.58 cm) was recorded from V2
(Sweet Charlie F1) which was statistically similar with the V3 (30.83 cm) treatment, while the shortest leaflet length (25.33 cm) was recorded from V1 (Red Star F1) treatment.
Leaflet length of cherry tomato varied significantly due to application of different doses of calcium fertilizer (Table 4 and appendix IV). The longest leaflet length (32.00 cm)