Lie Detection Analyzing Brain Wave Patterns using EEG Headset.
BY
K. A. Mahamudul Hasan ID: 161-15-7303 Mozibur Rahman
ID: 161-15-7300 AND Nusrath Sharmin
ID: 161-15-7293
This Report Presented in Partial Fulfillment of the Requirements for the Degree of Bachelor of Science in Computer Science and Engineering
Supervised By
Prof. Dr. Syed Akhter Hossain Head
Department of CSE
Daffodil International University Co-Supervised By
Dr. Sheak Rashed Haider Noori Associate Professor and Associate Head
Department of CSE
Daffodil International University
DAFFODIL INTERNATIONAL UNIVERSITY
DHAKA, BANGLADESHDECEMBER 2019
©Daffodil International University iii
ACKNOWLEDGEMENT
First we express our heartiest thanks and gratefulness to almighty God for His divine blessing makes us possible to complete the final year project/internship successfully.
We really grateful and wish our profound our indebtedness to Prof. Dr. Syed Akhter Hossain, Head, Department of CSE Daffodil International University, Dhaka. Deep Knowledge & keen interest of our supervisor in the field of “Machine Learning” to carry out this project. His endless patience ,scholarly guidance ,continual encouragement , constant and energetic supervision, constructive criticism , valuable advice ,reading many inferior draft and correcting them at all stage have made it possible to complete this project.
We would like to express our heartiest gratitude to Prof. Dr. Syed Akhter Hossain, Head, Department of CSE, for his kind help to finish our project and also to other faculty member and the staff of CSE department of Daffodil International University.
We would like to thank our entire course mate in Daffodil International University, who took part in this discuss while completing the course work.
Finally, we must acknowledge with due respect the constant support and patients of our parents.
©Daffodil International University iv
ABSTRACT
Lie is one form of deception. People wants to differentiate between truth and lie but it is not always possible. Truth always show the right path. From ancient time, different methods were applied to find out the truth. Mostly in judiciary and for security of a nation, we need to check whether a person is telling the truth or not. Most of the methods are based on body’s states that can be altered easily. But brain waves are not easy to alter. So, in this research project we have tried to detect lie by analyzing brain waves. Brain waves can be detect using EEG Headset. It produces lots of data of brain signal that has been analyzed using data mining techniques. And machine learning & neural network algorithms are used to make decision based on the collected data. Neural oscillation are collected using an EEG headset during question-answer session. After that data were preprocessed and then three algorithms (two class locally deep SVM, two class decision forest tree and two class neural network) that were selected were applied on the data. We have found 63.1% accuracy in Two Class locally Deep SVM, 99.2 % accuracy in Two Class Decision Forest and 55.7%
accuracy in Two Class Neural Network algorithm.
©Daffodil International University
TABLE OF CONTENTS
CONTENTS PAGE
Board of examiners i
Declaration ii
Acknowledgements iii
Abstract iv
CHAPTER
CHAPTER 1: INTRODUCTION
1-21.1 Introduction 1
1.2 Motivation 1
1.3 Objectives 1
1.4 Research Question 1
1.5 Expected Outcome 1
1.6 Report Layout 2
CHAPTER 2: BACKGROUND
3-52.1 Introduction 3
2.2 Related Works 3
2.3 Research Summary 4
2.4 Scope of the Problem 4
2.5 Challenges 5
©Daffodil International University
CHAPTER 3: RESEARCH METHODOLOGY
6-133.1 Data Collection 6
3.2 Data Preprocessing 8
3.3 Method Selection 9
3.4 Two Class Locally Deep SVM 9
3.5 Two Class Neural Network 11
3.6 Two Class Decision Forest 12
CHAPTER 4: RESULT DISCUSSION
4.1Result Discussion14-16 14
CHAPTER 5: CONCLUSION AND FUTURE WORK
175.1 Conclusion 17
5.2 Future Work 17
REFERENCES
18©Daffodil International University
LIST OF FIGURES
FIGURES PAGE NO
Figure 3.2.1: Data and resampled data comparison 8
Figure 3.4.1: Work flow diagram of Two Class Locally Deep SVM 10 Figure 3.5.1: Work flow diagram of Two Class Neural Network 11 Figure 3.6.1: Work flow diagram of Two Class Decision Forest 13 Figure 4.1.1 Two-Class Locally Deep SVM accuracy graph 15 Figure 4.1.2 Two Class Neural Network accuracy graph 15 Figure 4.1.3 Two Class Decision Forest accuracy graph 16
©Daffodil International University
LIST OF TABLES
TABLES PAGE NO
Table 3.1.1: Brain Waves details 7
Table 3.4.1: Result of Two Class Locally Deep SVM 10
Table 3.4.1: Result of Two Class Neural Network 12
Table 3.4.1: Result of Two Class Decision Forest 13
Table 4.1.1 Result comparison of Three Models 14
©Daffodil International University 1
CHAPTER 1 Introduction
1.1 IntroductionPeople lies to create false belief or impression. It is done to make someone believe something that is not true. At first, lying may seem simple or harmless but the outcome is always harmful. It is important to detect lies in different stage of life. Mostly in court trials, airports, intelligence interviews, police investigations and so on, it is important to find out whether someone is telling the truth or lying. Though sometime it is hard to accept the truth, everyone loves, respects and appreciates the truth in every situation.
1.2 Motivation
Lie detection is an interesting topic. It is like reading someone’s mind. We were curious about lie detection from a movie called ‘Shawshank Redemption’. In the movie, a people was sent to jail because there was no way to detect the truth or lies. These kind of things happen in real life also. To find the truth and separate lies from the truth is our motivation.
1.3 Objective
We need to detect lies in court trials, police investigations, airports and so on. Our main objective of this research is to provide help to the Govt. and law enforcement authority to identify whether the suspect is telling the truth or not. Another objective is we want to contribute in this research topic.
1.4 Research Question
Some research has been done on this topic. In this research project, our main goal is to get better accuracy by using different algorithms and data mining techniques.
1.5 Expected Output
By completing this research work, we will be able to predict whether a subject is telling the truth or not.
Expected outcome of this research work is-
©Daffodil International University 2
A better approach in detection of lie.
Better accuracy than previous researches.
1.6 Report Layout
The structure of the report file is as follows:
Chapter 1: Introduction
There are introductory information in this chapter. The motivation behind this research work, the objective of this project and the expected outcome from this research project are discussed in this chapter.
Chapter 2: Background
Background information about lie detection, the related research works that have been done on this topic, scope in this research topic and the challenges in this research project are summarized and discussed in this chapter.
Chapter 3: Research Methodology
In this chapter, there are information about data collection procedure, then data preprocessing procedure. After that algorithms selection and the reasons of the selection are discussed. Later, the working procedure of the algorithms are discussed.
Chapter 4: Result Discussion
The result from the algorithms are analyzed in this chapter. Result comparison and the decisions from the result are discussed in this chapter.
Chapter 5: Conclusion and Future Work
Conclusion of the research project is done in this chapter. The future scope on this lie detection topic is discussed in this chapter.
©Daffodil International University 3
CHAPTER 2 Background
2.1 IntroductionA lie is something that is stated to deceive someone based on false information. People lies to get other people to make a decision that is in the favor of the lying person. To catch the real culprit or to find out the hidden truth, we have to detect lie. But, it is not easy to detect lies because the decision comes from the brain. Though there are some physical expressions when telling lies but that’s all can be controlled and altered. If we can collect and process brain’s signal, and find the truth from the signal then we can get the real data.
2.2 Related Works
Over the years, many research has been done to develop appropriate way to detect lie and deception. One of the most widely used technique is the polygraphic test[1]. It makes decision based on response from nervous system. In previous, Detection of lie was done based on a person’s physical states or emotional excitement. Physical states are blood pressure, body temperature, respiration rate, skin resistance and electrodermal response (EDR) [2]. A trained examiner then question the subject and a polygraph instrument measures the state of the subject. Emotional states were determined by the trainer. Here’s the theory is, for a physically fit man there will be certain changes in physical states [3]
because of telling lies. From previous research hypothesis, by observing brain signal rather than polygraphic measurement, there is a better possibility to detect deception. [4][5].
(Turnip et al.) [6]developed an EEG-P300 signal[7] based lie detection system using ANFIS Method. Twelve subject whose age around 20years, were involved in this experiment. They extract their data by using Discrete Wavelet Transform (DWT). Later, they classified their extracted signal by the help of Adaptive Network Fuzzy Interference System method. This experiment shows that ANFIS method achieved less training time.
In this approach they got 64.27% accuracy.
(Immanuel et al.)[8] created a lie detection system using blink parameters from EEG data.
They used 10 subject to collect data. A person’s blink rate decreases drastically while they are lying and then increases rapidly moments after. They used Blinker algorithm to collect ocular data such as blink rate, number of blinks and blinks duration. The use of blink parameters, particularly blink rate as a credible and prevailing indicator of lies in a subject.
The result showed 95.12% accuracy while decreases in blink rate during a lie.
©Daffodil International University 4 (Anwar et al.)[9] developed an Event Related Potential (ERP) based Lie Detection using EEG headset. They used EEG headset to record brain signals in an information concealment testing environment. To create this model they used Discrete Wavelet transform (DWT), Principal Component Analysis (PCA), Support Vector Machine (SVM)[10], Cross validation and Grid Search. The results showed an accuracy of 83%.
[11]A Microsoft’s principal developer Jennifer Marsman used Emotive Epoc+ headset to collect raw EEG data and using machine learning she tried to develop a lie detector by using her husband as test subject. She asked her husband Chris some questions and then saved the EEG data. She used Two-Class Decision Jungle algorithm to predict possible lies. The accuracy she found was 71.2%. She only used one subject and she said that this project needs much more work. Alternative to polygraph, lie detection based on EEG Data has much more accuracy.
2.3 Research Summary
In lie detection topic, most of the research work have been done to develop polygraph test.
EEG-P300 signal was used to detect deception. Jennifer Marsman[11] worked with brain waves. She only collected data from her husband and used Two-Class Decision Jungle algorithm in the prediction.
In this research work, we have used Neurosky mindwave EEG headset. A python module was written to collect data using the headset. We have taken three types of brain waves (Alpha, Beta and Gamma). Min-max normalizer is used to normalize the data. We have applied three algorithms (Two Class Locally Deep SVM, Two-Class Decision Forest and Two-Class Neural Network) to perform lie detection. Later, we have compared the result of the three algorithms and chosen the best one.
2.4 Scope of the Problem
There are a lot of scope in this topic to work. In previous, Two-Class Decision Jungle algorithm was used by Jennifer Marsman and there was only one subject. So, there is a scope to work with more subjects. Also, different algorithms can be applied to compare with previous one.
©Daffodil International University 5 2.5 Challenges
There are some challenges that we have faced during this research project. The challenges are as follows:
Choosing appropriate question. We were careful about ambiguous question.
Selecting subject properly.
Preprocessing the data properly.
Selecting the algorithms.
©Daffodil International University 6
CHAPTER 3 Research Methodology
3.1 Data CollectionSince EEG headset is not that much available to peoples, there are very few works have been done using this. So, it is very hard to find any kind of EEG dataset and even harder when it is Lie Detection. So, we have been decided to collect data manually using a real EEG headset.
In our research we have used “Neurosky Mindwave single channel EEG headset” to collect data. It has no official API. So, the first challenge was reading raw values from the headset.
For this we have written an API in python 3 to interact with the headset. After creating API, we started to collect data.
We have set a question paper with five random questions which answer can be YES or NO.
We have made it sure that those questions were not analytical and not unknown to anyone.
First, we have set the EEG Headset up to one’s head from whom we have wanted to collect signal data, and then we have connected the headset to computer via a Bluetooth device.
Then we asked them five questions and have told them to say the truth and second time we asked them the same question again but this time we asked them to lie.
For each question we have collected data on exact that point when one has said Yes or No in his/her answer and saved in a .csv file. The EEG headset passes new values in every 1 millisecond through the API. So, for one answer we might got multiple rows of data. Which have made it a multilabel problem.
The EEG Headset can give us 12 different values which are attention, meditation, raw value, delta, theta, low alpha, high alpha, low beta, high beta, low gamma, mid gamma and poor signal.
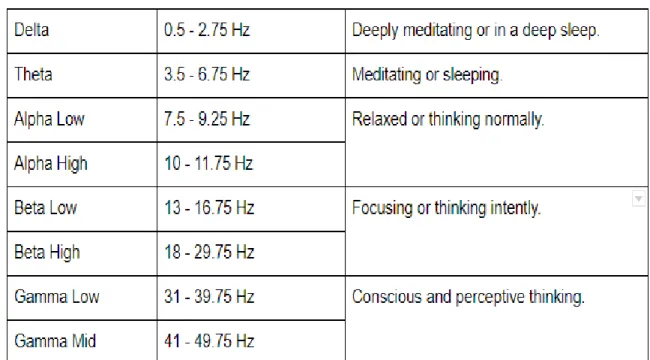
©Daffodil International University 7 Table 3.1.1: Brain Waves Details
Table 3.1.1: Brain Waves. This is denoting the HZ for each ray we are getting from the EEG headset. And we also get what each ray denotes.
Every value has different range and denote different state of mind. A brief detail can be found in Lie detection is not related with meditation or sleep value. So, from the table we can tell that we only need seven columns which are low alpha, high alpha, low beta, high beta, low gamma, mid gamma and the attention value. And also, we have to check that if the value we take are accurate or not. That’s why we can use poor signal column which evaluate the strength of the signal which has come from the EEG Headset. 0 denote the best signal and higher the value goes more inaccurate the signal is.
Since the question set only contains Yes and No type question so we can say that it is a binary problem. That’s why we have added a new column in each question dataset named
“is True”. When the answer against the question was correct, we have putted 1 in every row on “is True” column. And When the answer against the question was not correct, we have putted 0 in every row on “is True” column. Totally we survey 80 people. And the total question was 1600.
©Daffodil International University 8 3.2 Data Preprocessing
When we get the data from EEG headset, we cannot directly fit them into model. Because there are many noisy data which can make the model less accurate. And also, EEG signal is not giving same length every time. So, we have to manipulate them to make the length fixed for all column.
We have collected each question data in different “csv” file in Data folder. So, first we visit all path inside data folder and read all the csv files and convert it into a list of pandas Data Frame. Also, we have added 0 or 1 in “is True” column depending on each dataset denoting true or false.
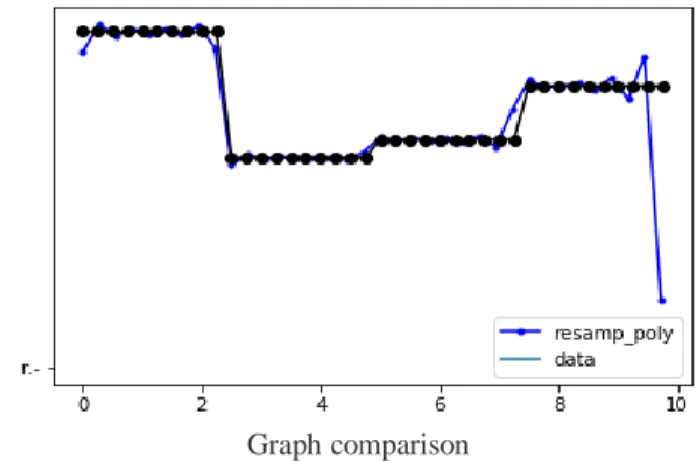
Shape for each dataset was different. So, we reshape each data frame using polyphase method. First, we have found the avg length of all data columns and apply polyphase method. We need to pass three parameters in that method. Which is up sampling factor, down sampling factor and the data column.
We use bellows method to find the value for each data frame.
up sampling factor = ceiling (al / dL) * DSF +0.001) where,
al = average length of all dataset columns, dL = current dataset column length,
DSF = Down sampling factor = 100
After using polyphase method for each column, we have got n*m dimension for each data frame.
Graph comparison
Fig 3.2.1 data and resampled data comparison. The black line data is the actual data and the other graph is the resampled data after using polyphase method.
©Daffodil International University 9 Then we got another problem. Our dataset had very big values. Which could make the model less acceptable. So first we have merged all data Frame into one data Frame. We have used min max scaler to scale all the columns. We have scaled low alpha, high alpha, low beta, high beta, low gamma, mid gamma and the attention and have dropped all other columns.
The min max method works like below
xi−min(x)/max(x)−min(x) - - - (1) In eq. (1),
xi = given value min(x) = 1
max(x) = max value of that column
After completing all those tasks, we have imported the data Frame into a csv file
3.3 Method Selection
There are a few works in EEG signal. Where we can see that not many models work fine with this kind of data. But decision forests, Support Vector Machine and neural network models can be good on that kind of signal. So that we have decided to work with these three types of model. We have used Two-Class Decision Forest which is based on decision forests algorithm, Two-Class Locally Deep Support Vector Machine which is based on SVM and Two-Class Neural Network which is based on neural network algorithm.
3.4. Two Class Locally Deep SVM
SVM can be used in linear and non-linear classification tasks. This method is very good for larger training set. Also, the training time for this method is very low.
This model is a supervised learning method. Since our dataset is quite large so we have decided to apply Two class locally deep SVM.
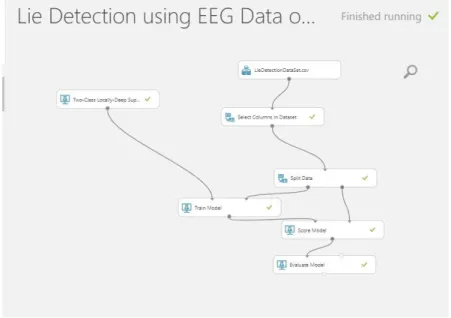
©Daffodil International University 10 We have built our model using Microsoft Azure Machine Learning Studio. First, we have imported our dataset in “csv” format, then we have selected all the column which will be trained. Then we have split our data set in a manner of 80% as training dataset and 20% as test dataset. After that we have selected the Two Class Locally Deep SVM and start training the model. After completing the training, we have scored our model and evaluate the model. The evaluation gives us 63.1% of accuracy. We have accepted more. So we have decided that the model is not best fit for our data set.
work flow diagram
Fig 3.4.1 work flow diagram of Two-Class Locally Deep SVM. This is the diagram where we are using Two-Class Locally Deep SVM using Microsoft azure.
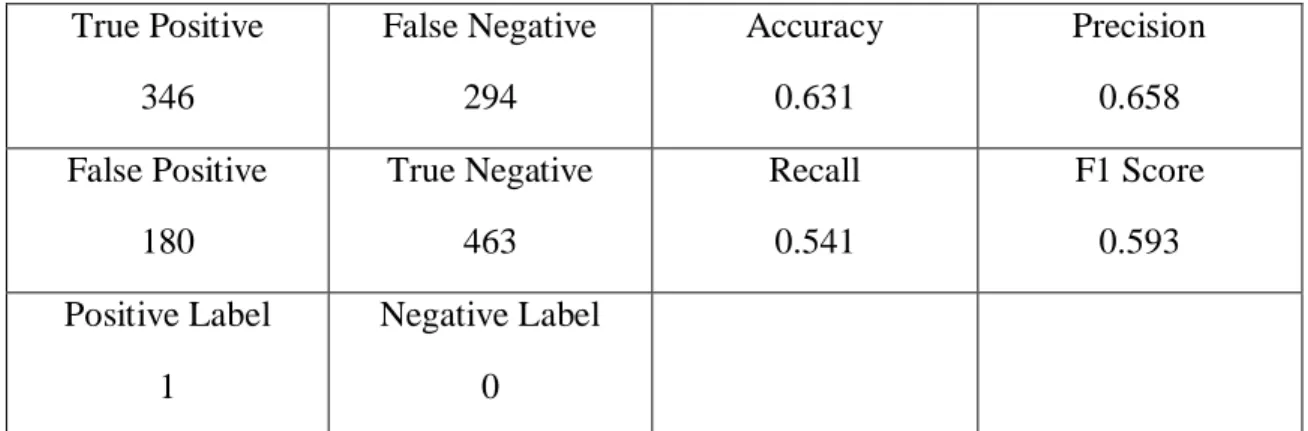
Table 3.4.1 Result of Two-Class Locally Deep SVM
True Positive 346
False Negative 294
Accuracy 0.631
Precision 0.658 False Positive
180
True Negative 463
Recall 0.541
F1 Score 0.593 Positive Label
1
Negative Label 0
Table 3.4.1 Result of Two-Class Locally Deep SVM. It denotes the true positive, false positive, true negative, false negative rate for each input. And also the accuracy, recall, precision and f1 scale for Two-Class Locally Deep SVM.
©Daffodil International University 11 3.5 Two Class Neural Network:
Two Class Neural Network create a neural network model that can be used to predict a target that has only two values. This model is a supervised learning method.
This method has a very long-time trending period but the accuracy is good for binary data prediction. That’s why we have used that method.
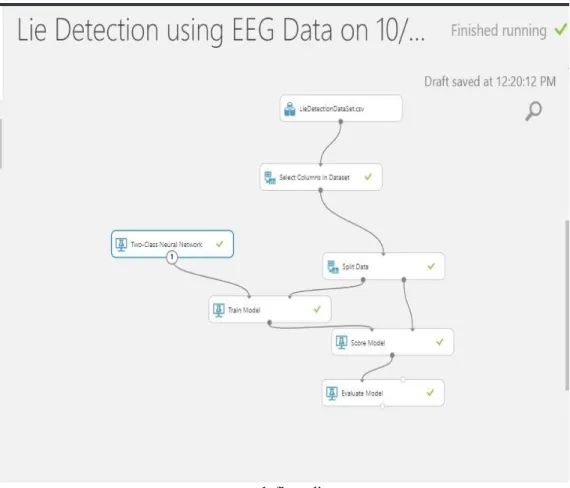
We have built our model using Microsoft Azure Machine Learning Studio. First, we have imported our dataset in “csv” format, then we have selected all the column which will be trained. Then we have split our data set in a manner of 80% as training dataset and 20% as test dataset. After that we have selected theTwo Class Neural Network and start training the model. After completing the training, we have scored our model and evaluate the model. The evaluation gives us 55.7% of accuracy. Which is worse than the previous model. So, also this model is not fit for our data.
work flow diagram
Fig 3.5.1 work flow diagram of Two-Class Neural Network. This is the diagram where we are using Two-Class Neural Network using Microsoft azure.
©Daffodil International University 12 True Positive
151
False Negative 489
Accuracy 0.557
Precision 0.657 False Positive
79
True Negative 564
Recall 0.236
F1 Score 0.347 Positive Label
1
Negative Label 0
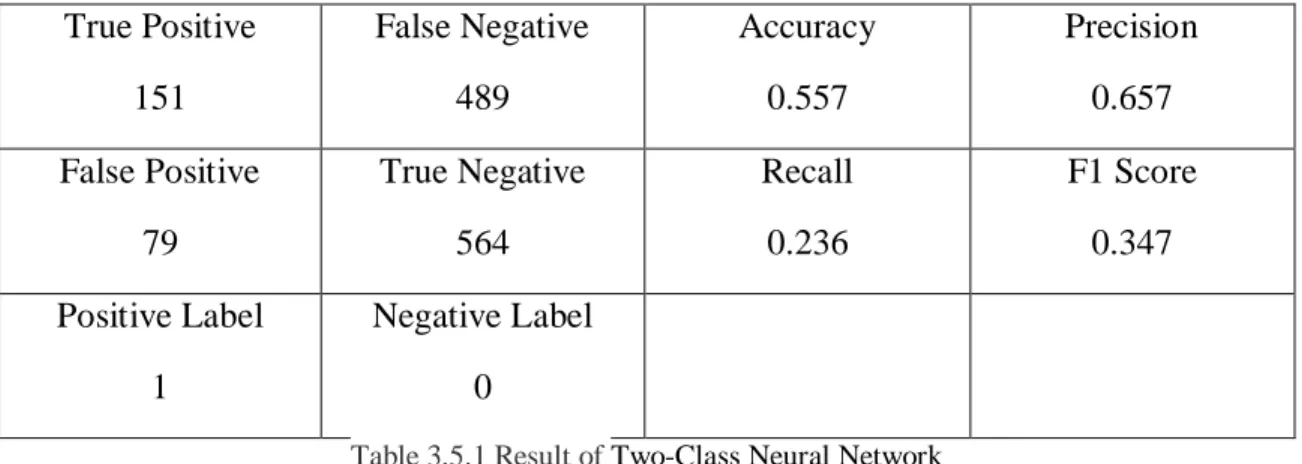
Table 3.5.1 Result of Two-Class Neural Network
Table 3.5.1 Result of Two-Class Neural Network. It denotes the true positive, false positive, true negative, false negative rate for each input. And also the accuracy, recall, precision and f1 scale for Two-Class Neural Network.
3.6 Two Class Decision Forest
Decision forests are fast, supervised ensemble models. This model works great with binary prediction.
This is actually an ensemble learning method. Ensemble method principle is rather than depending on single model we may get better result when we use multiple related model.
Two class decision forest combine all those models and perform based on this. This is the main reason that we have chosen this model for our dataset.
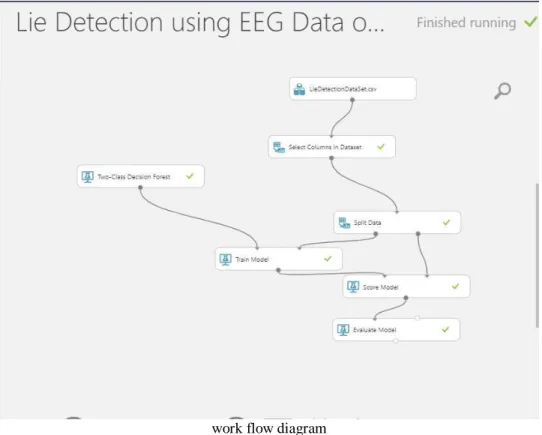
We have built our model in Microsoft Azure Machine Learning studio. First, we have imported our dataset in csv format, then we have selected all the column which will be trained. Then we have split our data set in a manner of 80% as training dataset and 20% as test dataset. After that we have selected Two Class Decision Forest and start training the model. After completing the training, we have scored our model and evaluate the model.
The evaluation gives us 99.2% of accuracy. This is the best accuracy we have ever got. So, we have decided that this model is best fit for our dataset.
©Daffodil International University 13 work flow diagram
Fig 3.6.1 work flow diagram of Two-Class Decision Forest. This is the diagram where we are using Two-Class Decision Forest using Microsoft azure.
True Positive 638
False Negative 2
Accuracy 0.992
Precision 0.988 False Positive
8
True Negative 635
Recall 0.997
F1 Score 0.992 Positive Label
1
Negative Label 0
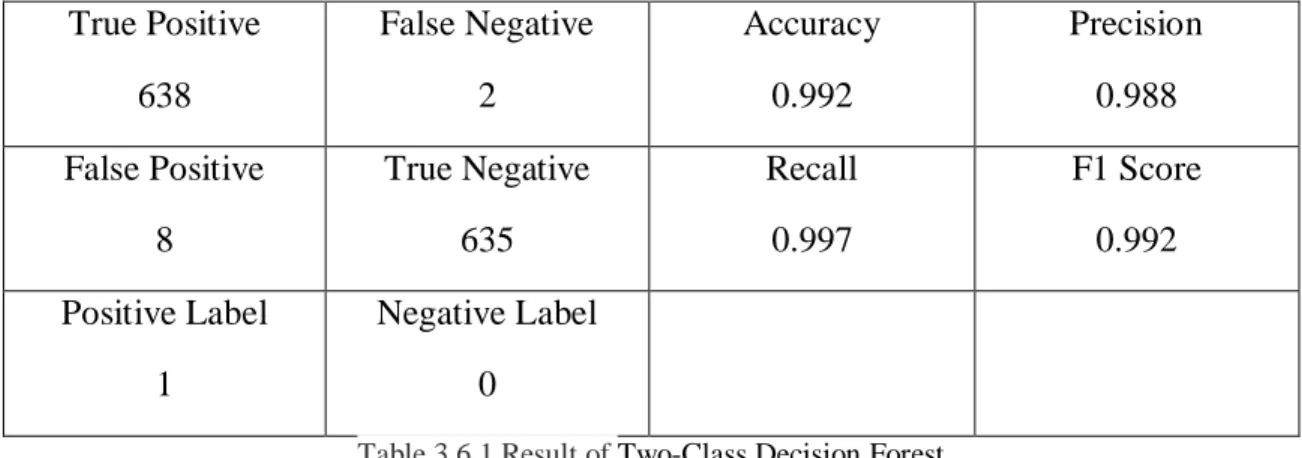
Table 3.6.1 Result of Two-Class Decision Forest
Table 3.6.1 Result of Two-Class Decision Forest. It denotes the true positive, false positive, true negative, false negative rate for each input. And also the accuracy, recall, precision and f1 scale for Two-Class Decision Forest.
©Daffodil International University 14
CHAPTER 4 Result Discussion
4.1 Result DiscussionFrom above discussion, Two Class Decision Forest works great along with the data set as expected. But we have expected a little high value of accuracy from other two model. SVM and Neural Network worked great with some dataset which was collected form 14 channel EEG headset. Since ours have single channel headset. Maybe that’s why it’s not that much good with our data.
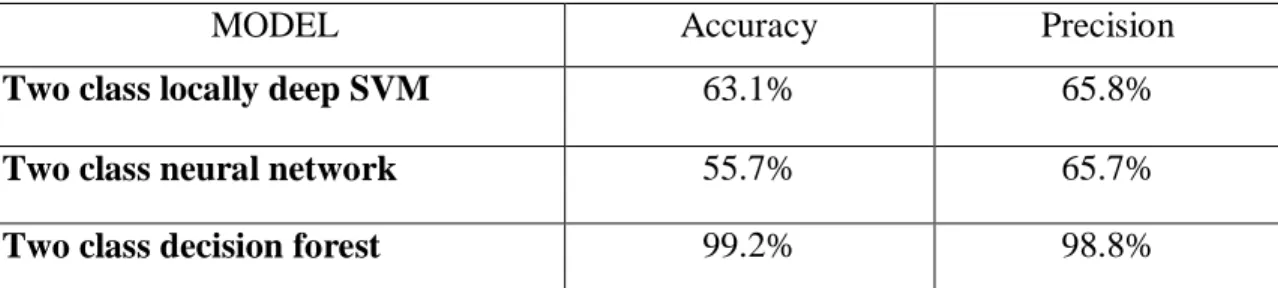
Table 4.1.1 Result comparison of Three Models
MODEL Accuracy Precision
Two class locally deep SVM 63.1% 65.8%
Two class neural network 55.7% 65.7%
Two class decision forest 99.2% 98.8%
Table 4.1.1 Result comparison of Three Models. This table denoting the output result comparison for each model. Which is accuracy and precision.
Two class decision forest works great along with the data set as expected with 98.2%
accuracy. But accuracy from other two model are lower than we have expected. We have expected that SVM and neural network would work great. Decision Forest method is an ensemble learning method. That can be a reason for the highest accuracy from the model.
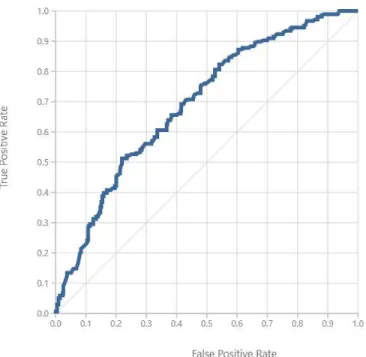
©Daffodil International University 15 The visual graph of true positive rate and false positive rate are given below for each model.
SVM accuracy graph
Figure 4.1.1 Two-Class Locally Deep SVM accuracy graph. X axis denoting the false positive rate and y axis denoting the true positive rate. The more left and upper the graph is the more accuracy it has.
Two class neural network accuracy graph
Figure 4.1.2 Two class neural network accuracy graph. X axis denoting the false positive rate and y axis denoting the true positive rate. The more left and upper the graph is the more accuracy it has.
©Daffodil International University 16 Figure 4.1.3 Two class decision forest accuracy graph
Figure 4.1.3 Two class decision forest accuracy graph. X axis denoting the false positive rate and y axis denoting the true positive rate. The more left and upper the graph is the more accuracy it has.
©Daffodil International University 17
CHAPTER 5
Conclusion and Future Work
5.1 ConclusionThe result of the study shows that lie detection through analyzing brain waves data is an efficient method. From the study, 99.2% accuracy is found. The high accuracy means law enforcement authority and Govt. agencies can use EEG based lie detection systems and it can be admissible in court.
5.2 Future Work
In this research project, we have taken subjects whose age are range from 18 to 25 and we have applied three algorithms. So, in future there are some scopes to work such as-
Choose subjects from different age range.
Choose autistic people as subjects
Choose disabled person as subjects and compare the result with normal person
Apply different algorithms.
©Daffodil International University 18
References
[1] The Polygraph and Lie Detection. National Academies Press, 2003.
[2] V. Abootalebi, M. H. Moradi, and M. A. Khalilzadeh, “A new approach for EEG feature extraction in P300-based lie detection,” Comput. Methods Programs Biomed., vol. 94, no. 1, pp. 48–57, 2009.
[3] S. Azhan, A. Zaman, and M. R. Bhuiyan, “Using machine learning for lie detection: classification of human visual morphology,” 2018.
[4] L. A. Farwell and E. Donchin, “The Truth Will Out: Interrogative Polygraphy (‘Lie Detection’) With Event‐Related Brain Potentials,” Psychophysiology, vol. 28, no. 5, pp. 531–547, 1991.
[5] J. P. Rosenfeld, J. Ellwanger, and J. Sweet, “Detecting simulated amnesia with event-related brain potentials,” Int. J. Psychophysiol., vol. 19, no. 1, pp. 1–11, 1995.
[6] A. Turnip, M. F. Amri, M. A. Suhendra, and D. E. Kusumandari, “Lie detection based EEG-P300 signal classified by ANFIS method,” J. Telecommun. Electron. Comput. Eng., vol. 9, no. 1–5, pp.
107–110, 2017.
[7] S. Kamran Haider, M. I. Daud, A. Jiang, and Z. Khan, “Evaluation of P300 based Lie Detection Algorithm,” Electr. Electron. Eng., vol. 2017, no. 3, pp. 69–76, 2017.
[8] J. Immanuel, A. Joshua, and S. Thomas George, “A Study on Using Blink Parameters from EEG Data for Lie Detection,” 2018 Int. Conf. Comput. Commun. Informatics, ICCCI 2018, pp. 1–5, 2018.
[9] S. Anwar, T. Batool, and M. Majid, “Event Related Potential (ERP) based Lie Detection using a Wearable EEG headset,” Proc. 2019 16th Int. Bhurban Conf. Appl. Sci. Technol. IBCAST 2019, pp.
543–547, 2019.
[10] A. I. Simbolon, A. Turnip, J. Hutahaean, Y. Siagian, and N. Irawati, “An experiment of lie detection based EEG-P300 classified by SVM algorithm,” Proc. 2015 Int. Conf. Autom. Cogn. Sci.
Opt. Micro Electro-Mechanical Syst. Inf. Technol. ICACOMIT 2015, pp. 68–71, 2016.
[11] “Keynote: Using EEG and Machine Learning to Perform Lie Detection - Jennifer Marsman - YouTube.” [Online]. Available: https://www.youtube.com/watch?v=63k0Zc3yWb4. [Accessed:
03-Nov-2019].
©Daffodil International University 19