CLASSIFICATION OF CHRONIC KIDNEY DISEASE (CKD) USING DATA MINING TECHNIQUES
By Faisal Arafat ID: 142-15-3664
Shajedul Islam ID: 142-15-3647
Kaniz Fatema ID: 142-15-3807
This Report Presented in Partial Fulfilment of the Requirements for the Degree of Bachelor of Science in Computer Science and Engineering
Supervised by
Ms. Farhana Irin Lecturer Department of CSE
Daffodil International University
DAFFODIL INTERNATIONAL UNIVERSITY
DHAKA, BANGLADESHMAY 2018
©Daffodil International University i
APPROVAL
This project titled “Classification of Chronic Kidney Disease (CKD) Using Data Mining Techniques,” submitted by Faisal Arafat, ID No: 142-15-3664, Shajedul Islam, ID No: 142-15-3647 and Kaniz Fatema, ID No: 142-15-3807 to the Department of Computer Science and Engineering, Daffodil International University, has been accepted as satisfactory for the partial fulfillment of the requirements for the degree of Bachelor of Science in Computer Science and Engineering and approved as to its style and contents.
The presentation has been held on 5th May 2018.
BOARD OF EXAMINERS
Dr. Syed Akhter Hossain Chairman Professor and Head
Department of Computer Science and Engineering Faculty of Science & Information Technology Daffodil International University
Dr. Sheak Rashed Haider Noori Internal Examiner
Associate Professor and Associate Head
Department of Computer Science and Engineering Faculty of Science & Information Technology Daffodil International University
Md. Zahid Hasan Internal Examiner
Assistant Professor
Department of Computer Science and Engineering Faculty of Science & Information Technology Daffodil International University
Dr. Mohammad Shorif Uddin External Examiner Professor
Department of Computer Science and Engineering Jahangirnagar University
©Daffodil International University ii
DECLARATION
We hereby declare, this project has been done under the supervision of Ms. Farhana Irin, Lecturer, Department of CSE, Daffodil International University. We also declare that neither this thesis nor any part of this thesis has been submitted elsewhere for award of any degree or diploma.
Supervised By:
Ms. Farhana Irin Lecturer
Department of Computer Science and Engineering Daffodil International University
Co-Supervised By:
Rubaiya Hafiz Lecturer
Department of Computer Science and Engineering Daffodil International University
Submitted By:
Faisal Arafat ID: 142-15-3664
Department of Computer Science and Engineering Daffodil International University
Shajedul Islam ID: 142-15-3647
Department of Computer Science and Engineering Daffodil International University
Kaniz Fatema ID: 142-15-3807
Department of Computer Science and Engineering Daffodil International University
©Daffodil International University iii
ACKNOWLEDGEMENT
First we express our heartiest thanks and gratefulness to almighty God for his divine blessing makes us possible to complete the final year thesis successfully.
We really grateful and wish our profound our indebtedness to Ms. Farhana Irin, Department of CSE, Daffodil International University, Dhaka. Deep Knowledge & keen interest of our supervisor in the field of “Data Mining and Machine Learning” to carry out this thesis. Her endless patience, scholarly guidance, continual encouragement, constant and energetic supervision, constructive criticism, valuable advice, reading many inferior draft and correcting them at all stage have made it possible to complete this thesis.
We would like to express our heartiest gratitude to Prof. Dr. Syed Akhter Hossain, Professor and Head, Department of CSE, for his kind help to finish our thesis and also to other faculty member and the staff of CSE department of Daffodil International University.
We would like to thank our entire course mates in Daffodil International University, who took part in this discussion while completing the course work.
Finally, we must acknowledge with due respect the constant support and patience of our parents.
©Daffodil International University iv
ABSTRACT
In the past decade rapid growth of digital data and global accessibility of it through modern internet has seen a massive rise in machine learning research. In proportion to it, the medical data has also seen a massive serge of expansion. With the availability of structured clinical data, it has attracted scores of researchers to study on the automation of clinical disease detection with machine learning and data mining. Chronic Kidney disease (CKD) also known as renal disorder has been such a field of study for quite some time now. So, our research aims to study the automated detection of chronic kidney disease with clinical data using several machine learning classifier. This research particularly focuses on Random Forest classifier, Naïve Bayes and decision tree in the purpose of classifying the intended dataset. Observational and comparative studies will be conducted on the each of the classifier’s accuracy. The correlation and importance of each of the attributes to achieve the intended classification has been also explored in this study.
Overall our endeavor has been to achieve a sustainable and feasible model to detect the chronic kidney disease with comprehensive clinical accuracy.
©Daffodil International University v
TABLE OF CONTENTS
CONTENTS PAGE
Board of examiners i
Declaration ii
Acknowledgement iii
Abstract iv
CHAPTERS
CHAPTER 1: INTRODUCTION 1-5
1.1: Introduction 1
1.2: Motivation: A Silent Story of Bangladesh 1-2
1.3: Can Data Science help? 3
1.4: Rationale For the study 3-4
1.5: Research Questions 4
1.6: Expected Outcome 5
1.6: Report Layout 5
CHAPTER 2: BACKGROUND STUDY 6-15
2.1: Introduction 6
2.2 Chronic Kidney Disease (CKD) 6
2.2.1 CKD Definition 6-7
2.2.2 Causes and Risk Factors of CKD 8-11
2.2.3 The effect of CKD on kidney 11-12 2.3 Related Works and Comparative studies 12-14
2.4 Research Summary 14
2.5: The Scope of this Problem 15
2.6: Challenges 15
©Daffodil International University vi
CHAPTER 3: RESEARCH METHODOLOGY 16-22
3.1: Introduction 16
3.2: About Dataset 17
3.3: Data Description and preprocessing 17-20
3.4: Screenshot of the dataset 21
3.5: Classification Algorithm 21
3.5.1: Random Forest Classifier 21
3.5.2: Logistic Regression 22
3.5.3: Naive Bayes 22
CHAPTER 4: EXPERIMENTAL RESULTS AND DISCUSSION 23-32
4.1: Introduction 23
4.2: Experimental Results 23-28
4.2.1: Naïve Bayes with Confusion matrix and Classification Error 25 4.2.2: Logistic Regression with Confusion matrix and Classification Error 26 4.2.3: Random Forest with Confusion matrix and Classification Error 26-32
4.3: Potential Future improvement 32
4.4: Summery 32
CHAPTER 5: RESULTS AND CONCLUSION 33-34
5.1: Summary of the study 33-34
5.2: Conclusion 34
5.3: Recommendation 34
5.4: Implication of further studies 34
REFERENCES 35-36
©Daffodil International University vii
LIST OF TABLES
TABLES
PAGE
Table 2.1: GFR stages to classify CKD 7
Table 3.1: Attributes in the used dataset 17-18
Table 4.1: Weight of the attributes 23-24
Table 4.2: Confusion Matrix of Naive Bayes 25
Table 4.3: Confusion Matrix of Logistic Regression 26
Table 4.4: Confusion Matrix of Random Forest 26
©Daffodil International University viii
LIST OF FIGURES
FIGURES
PAGE
Figure 2.1: Proposed clinical progression of diabetic kidney disease 8 Figure 2.2: Criteria for Renal Biopsy in Patient’s with Diabetics 10
Figure 2.3: Causes of ESRD in U.S. 2008 11
Figure 3.1: Steps associated with KDD 16
Figure 3.2: Dataset before pre-processing 21
Figure 3.3: Dataset after pre-processing 21
Figure 4.1: Weight of the attributes 24
Figure 4.2: Important factors for ckd in Naïve Bayes 25 Figure 4.3: Important factors for nckd in Naïve Bayes 25 Figure 4.4: Important factors for ckd in Logistic Regression 26 Figure 4.5: Important factors for nckd in Logistic Regression 26 Figure 4.6: Important factors for ckd in Random Forest 27 Figure 4.7: Important factors for nckd in Random Forest 27
Figure 4.8: Random forest tree 1 27
Figure 4.9: Random forest tree 2 28
Figure 4.10: Random forest tree 3 28
Figure 4.11: Random forest tree 4 29
Figure 4.12: Random forest tree 5 29
Figure 4.13: Random forest tree 6 30
Figure 4.14: Random forest tree 7 30
Figure 4.15: Random forest tree 8 31
Figure 4.16: Random forest tree 9 31
Figure 4.17: Random forest tree 10 32
Figure 5.1: Accuracy of all classifier 33
Figure 5.2: Runtime of classifiers in (ms) 33
Figure 5.3: ROC Comparison Curves 34
©Daffodil International University 1
CHAPTER 1 INTRODUCTION
1.1 Introduction
As the medical technologies of our time making groundbreaking contribution to reduce human death due to many fatal chronic diseases, eradicating it and transcending above the grasp of diseases is still far from a reality.
There have been many fatal diseases over the course of past centuries. Some of those formed into epidemic and affected millions. Deadly diseases like Smallpox, SARS, Marliese and polio has been cured with vaccine in the past century. We are still fighting to cure the likes of Cancer, HIV, and Ebola etc.
One of the most deadly health hazards of our time is chronic kidney disease or in abbreviation. CKD is defined as the gradual degradation of the normal kidney function and the consequence can be catastrophic. Kidney is essential for the filtering and purification process of our blood. Without at least one functioning kidney, death is imminent and inevitable within a few days. As it is a chronic disease and the symptoms are mild and gradual, it often goes unnoticed for years and until the very late stage [5].
So, the scope of this research is to build a model using data mining techniques to predict if a patient does indeed have CKD by reviewing and analyzing symptoms and various health parameters; Using Data Mining tools to classify those data and compare the results of acquired through different techniques.
1.2 Motivation: A Silent Story of Bangladesh
The demographic of the situation of CKD in Bangladesh is far from ideal. The Annual Mortality rate due to Kidney Disease has increased by 52.3% from 1990 on an
©Daffodil International University 2 average of 2.3% per year. In a study conducted in 2014 by the title “High prevalence
of chronic kidney disease in a community survey of urban Bangladeshis: a cross- sectional study [17]” founds that education level was not associated with the presence of CKD among men, although among women, those who had received fewer than 5 years of education experienced higher odds of CKD compared with women educated at the University level or beyond (Odds ratio [OR] 3.6, 95% Confidence Interval [CI]
1.4 to 9.4) [17]. Wealth status was not associated with CKD among women or men.
Since smokers in our sample were predominantly (96%) men, we tested the association between smoking and CKD among men only and found no association.
Use of smokeless (chewable) tobacco was associated with higher odds of CKD among women (OR 2.8, 95% CI 1.4 to 5.7) [17].
The situation is deteriorating as the high cost of diagnosing test also responsible for people averting to get tested for CKD. As a result a big portion of people bearing the disease are totally oblivious to their own CKD status.
In Bangladesh, huge portion of population living below the poverty line does not have sufficient access to the required medical attention. The public medical sector which is almost completely run by the federal fund does not have the financial capability or the proper medical resources to incorporate this large amount of financially unprivileged people to the medical sector. As a result a very major health concern such the chronic kidney disease. And renal failure is not diagnosed in this population. As chronic kidney disorder often does not show any symptoms as a result these chronic phase transitions quickly into the ESRD or End Stage Renal Failure [5] and requires Blood dialysis which is unaffordable to many people or quickly becomes unaffordable after few months into the treatment. In Most cases patients develops ESRD without knowing they even had a chronic renal disorder in the first place. The lack of federal funding, Lengthy process in healthcare, persistent lack of quality and overall unsatisfactory service in public health institutes has forced the general public to seek private healthcare. This consequently has flourished the private sector but at the price of high medical costs. So massive amount of people affected by ESRD face morbid consequences with the lack of proper treatment and Dialysis which often leave the patient and the family in unfathomable sufferings and humanitarian crisis.
©Daffodil International University 3 As the first step towards treatment in any medical condition is to getting diagnosed
first. With the advancement of medical technology and capacity of storing medical data in digital form has rejuvenated the idea of medical automation and data revolution has all but made the possibility of artificially automated Doctor more than just an ambitious dream. An automated virtual system to classify CKD, is still not entirely convincing or decisive to the vast majority of doctors and medical personal and rightly so. But with more data, efficiency and more accuracy, a future of automated artificial medical assistant can become a reality.
1.3 Can Data Science help?
As the world of technology is moving towards computerized mechanization and AI automation, Yottabytes of robust and raw data is being produced in real time. This abundance of data leaves us with the opportunity to analyze those data with new data mining and machine learning techniques.
So as far as the medial data is concerned more and more computerized technology and preservation of patient’s data is becoming more and more common. Analyzing those data with conventional statistics may give us the “how’s” and “why’s” but using data mining and machine learning can demonstrate the potential solution of those problems. Classification using data mining, machine learning and deep learning is being practiced increasingly. These techniques can also reveal hidden patterns.
From Bangladesh’s point of view the CKD situation can be a field of study using automated classification as the disease is fairly simple to classify using appropriate data. The public sector deals with huge number of patient simultaneously. So an automated system can give a pre-suggestive classification of the test results which a doctor can confirm after verifying. This testing platform can be implemented for a certain period of time during which further data will be collected. Custom modification of the model can be done. further training of the model using real time and actual clinical data will be a leap forward to knowing how much can we rely on an automated system. And with increasing accuracy and consistency there is a fairly
©Daffodil International University 4 good chance of automating CKD diagnosis and many more diseases with proper
implementation.
1.4 Rationale For the study
Here are some of the reasons and arguments in favor of the study on chronic kidney disorder classification.
● The potential of an automated system for classification of disease has always attracted researchers. Although the clinical acceptance for this has not got too much attention, it definitely has potential to get implemented.
● Chronic kidney disease can be deceptive in nature as the symptoms comes often at a very late stage. The system can tell the patients which test to take and once the test is done the patient can check their personal CKD risk level themselves.
● An automated system can constantly check the risk percentage of the patients in the public hospitals which can later be verified by the doctors.
● Often patients get tested for various other medical conditions. The system can check those and notify the doctor if the patient has any risk of CKD potentially saving the risk of developing ESRD by getting diagnosed early.
● The overwhelming number of people that seek medical services in the public medical hospitals in Bangladesh has to endure endless agony to go through the process. An automated system can certainly save those people a lot of money and time. The hospital can filter out lots of patient who does not need medical attention by using the system, leaving only those who are genuinely at risk of the disease. This will save time, resources and money for the public hospitals.
Bangladesh has a massive count of people suffering in kidney disease. And what makes the situation worse is that many of them depend on public treatment where it has deal with this huge number of patient resulting in lengthy process of healthcare.
©Daffodil International University 5 1.5 Research Question
Followings are the list of things we tried to accomplish in his project.
❖ Can the CKD disease be classified with Convincing level of clinical accuracy?
❖ Applying different classifier to the dataset.
❖ Enlisting and comparing the accuracy rate of each classifiers.
❖ As the dataset is quite extensive we will work with various subset of the dataset.
1.6 Expected Outcome
❖ By analyzing the dataset CKD status of patient should be classified with comprehensive accuracy.
❖ Comparing different Machine Learning classification methods.
❖ Finding out the correlation of different attributes in the dataset in developing CKD.
1.7 Report Layout
In the first chapter of the project we have discussed about the overview of the project, our motivation our project. We have discussed about our objective and what out expected outcome was.
The second chapter we have extensively discussed about our background study on chronic kidney disease and literature survey. We have also enlisted many of the studies on this field.
Third chapter is about the research methodology that we have used. We have also briefly discussed about the classifier algorithm used in this research.
Fourth chapter includes the detailed description of our experimental result and comparative studies of the classifier accuracies.
In the Fifth chapter we discussed about the summary, future scope of the study and discussed about further areas for study in the similar field.
©Daffodil International University 6
CHAPTER 2
BACKGROUND STUDY
2.1 Introduction:
In the next few parts we will discuss about chronic kidney disease and it’s Definition.
We will also explore the Risks and effects of the Chronic Kidney disease. We discussed about the literature survey in similar field.
2.2: Chronic Kidney Disease
2.2.1 CKD Definition
Chronic kidney disease is referred to the kidney damage or the gradual decrease of Glomerular filtration (GFR) rate of the kidney for three months or more [1].
The measurement of Glomerular filtration Rate or GFR is the most common way to determine the state of kidney. GFR is measured by measuring the clearance of a substance excreted by the kidney which are often called filtration markers. The clearance is then used in a formula to determine GFR.
The characteristics of the perfect filtration marker are regarded as follows:
● Not protein bound;
● Is freely filtered by the glomerulus(ultra filtrates plasma);
● not tubular secretion;
● No renal metabolism. [2]
Very few substances fulfill the above mentioned criteria completely but some has a very close proximity to meeting those features. Inulin is such substance that can be used to measure GFR. But Inulin is not an internal constitute of the body. So an external infusion of inulin is required for detection of inulin clearance. In most practical cases creatinine clearance is used for this process. Creatinine (direct result of protein metabolism) is an endogenous substance that can be used for GFR measurement pretty accurately [5].
©Daffodil International University 7 The estimation of GFR is used to classify kidney impairment. A low GFR rate is
indicative of a disruptive kidney function. Table 1.2.1 illustrates the various stages for Kidney disease and its severity.
Table 2.1: GFR stages to classify CKD [3]
GFR categories in CKD
GFR category GFR (ml/min/1.73) Terms
G1 ≥90 Normal or high
G2 60-80 Mildly decreased*
G3a 45-59 Mildly to moderately decreased
G3b 30-44 Moderately to severely decreased
G4 15-29 Severely decreased
G5 <15 Kidney failure
Table 2.1 is taken from ‘Clinical Practices and Guideline for the Evaluation and Management of CKD, 2012” by KDIGO (Kidney disease: Improving global outcome) Work Group
As Table 2.1 demonstrates CKD or renal disease has been divided into 5 stages G1, G2, G3, G4, and G5. One noticeable factor is that G3 has been divided into two sections. A GFR rate of less than 45 is considered as indicative of CKD. GFR rate of less than 15 is considered as kidney failure which is also known as ESRD or End Stage Renal Disease.
©Daffodil International University 8 2.2.2 Causes and Risk Factors of CKD
Worldwide prevalence of diabetes is expected to increase from an estimated 290 million in 2018 to approximately 439 million by 2030 for ages between 20 and 79 years with estimated health expenditures approximated at 561 billion dollars. Diabetic kidney disease is the leading cause of end-stage renal disease (ESRD) in developed countries with 20-30 % of those with diabetes expected to develop chronic kidney disease (CKD). While the development and progression of diabetic kidney disease has been most studied in those with type 1 DM, clinical and pathologic progression and changes appear to be similar for those with type 2 DM. Factors predisposing to the development of nephropathy include a positive family history of diabetic kidney disease and ethnicity with particular high prevalence seen in those African origin and Hispanic origin and in Pima Indians. In addition, obese individuals seem to be more predisposed to the development of diabetic kidney disease as well as those that have or develop high blood pressure and/or have poor control of their diabetes. Of the modifiable risk factors, smoking and the use of oral contraceptives are noted to have added risk for the development of diabetic nephropathy. Diabetic nephropathy (DN) is clinically characterized by hyper filtration early on with subsequent occurrence of microalbuminuria, progression to microalbuminuria over the course of 10-20 years, and then progression to ESRD[5] (Figure 2.1)
Figure 2.1: Proposed clinical progression of diabetic kidney disease [3]
©Daffodil International University 9 Kidney disease develops in approximately 30 % of patients with either type 1 DM or
type 2 DM. Diabetic nephropathy is generally a pathologic diagnosis of diabetic kidney disease in diabetic patients who have undergone renal biopsy. Diabetic kidney disease is more generally used for the presumed clinical diagnosis given to patients with long-standing diabetes with proteinuria in the presence of other diabetic microvascular complications, particularly diabetic retinopathy. Patients with this clinical diagnosis generally undergo clinical evaluation to rule out other secondary glomerular or renal pathology [5]. In patients with long-standing diabetes and CKD without proteinuria or other evidence of microvascular complications such as retinopathy, the presumption of diabetic kidney disease is less certain, and renal biopsy may need to be considered particularly if progression of CKD is rapid (Figure 2.2).
Glomerular hyper filtration may be noted early in patients with DM and in some patients preceding the diagnosis of diabetes [7]. Several factors can lead to hyper filtration in the diabetic patient including renal vasodilation induced by elevated blood glucose levels and glycosylated proteins, insulin-like growth factor, atrial natriuretic peptide, as well as increased proximal tubular NaCl reabsorption. Blood glucose control and regression to norm albuminuria can be seen in some patients with good metabolic control, progression to macro albuminuria frequently occurs with intermittent and gradual increase of urine protein. Persistent and increasing overt proteinuria over 5–10 years frequently results in gradual loss of renal function, fluid retention and edema, and eventual need for renal replacement therapy. Urine sediment is often bland for patients with diabetic kidney disease; however, micro hematuria may also occur. An active urine sediment with dysmorphic red cells, red or white cell casts, or persistent significant hematuria should be investigated to rule out other glomerular or genitourinary pathologies. In addition, glomerulopathy other than diabetic nephropathy should also be entertained in patients that have onset of diabetes less than 10 years or have no evidence of other microvascular disease, microalbuminuria, or proteinuria or in those with diabetes who appear to have a rapid deterioration in their kidney function.
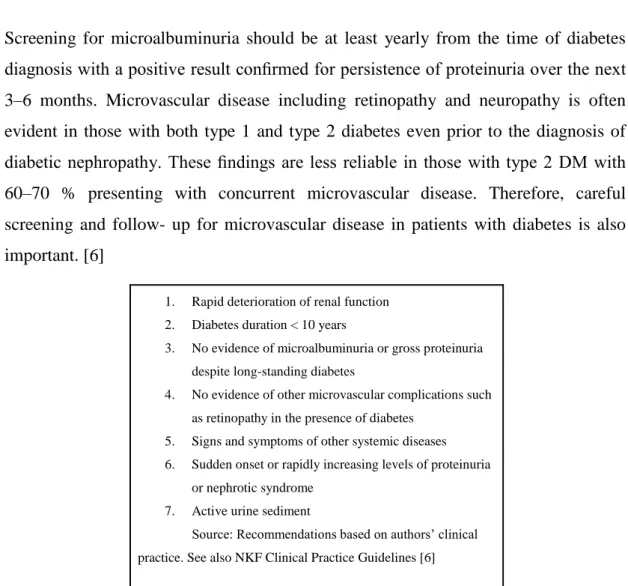
©Daffodil International University 10 Screening for microalbuminuria should be at least yearly from the time of diabetes
diagnosis with a positive result confirmed for persistence of proteinuria over the next 3–6 months. Microvascular disease including retinopathy and neuropathy is often evident in those with both type 1 and type 2 diabetes even prior to the diagnosis of diabetic nephropathy. These findings are less reliable in those with type 2 DM with 60–70 % presenting with concurrent microvascular disease. Therefore, careful screening and follow- up for microvascular disease in patients with diabetes is also important. [6]
1. Rapid deterioration of renal function 2. Diabetes duration < 10 years
3. No evidence of microalbuminuria or gross proteinuria despite long-standing diabetes
4. No evidence of other microvascular complications such as retinopathy in the presence of diabetes
5. Signs and symptoms of other systemic diseases 6. Sudden onset or rapidly increasing levels of proteinuria
or nephrotic syndrome 7. Active urine sediment
Source: Recommendations based on authors’ clinical practice. See also NKF Clinical Practice Guidelines [6]
Figure 2.2: Criteria for Renal Biopsy in Patients with Diabetes and Kidney Disease to Rule out Other Glomerular pathologies
Although practically and theoretically many different factors can cause CKD, Statistically few factors tends to have greater effect. Some of those have been discussed below. There are several factors that can causes CKD. Diabetes and hypertension are the two common major causes of CKD. There are some other causes include glomerulonephritis, cystic kidney disease and urologic disease. The causes of ESRD are shown in (Figure 2.3).
©Daffodil International University 11 Figure 2.3: causes of ESRD in U.S. 2008 [3]
2.2.3 The Effects of CKD in Kidney
Kidney is responsible for the filtration and disposal of unnecessary and detrimental substance from the blood. CKD gradually diminishes the filtration efficiency of a kidney which leads to higher density of dispensable material in blood. This makes blood less capable of accumulating oxygen to carry which in turn causes less oxygen supply around the body disrupting normal bodily function. Some of many effects of kidney disorder is listed below [5].
❏ Reduced Urination[5]
❏ Unbalanced electrolyte[5]
❏ Hormonal imbalance[5]
❏ Abnormal enzyme Production[5]
❏ Swollen body parts [5].
❏ Fatigue and Muscle cramp[5]
Long time chronic kidney disorder leads towards End Stage Renal Disease (ESRD) which is the final form of Kidney damage. AT ESRD stage kidney loses its minimum
©Daffodil International University 12 functional efficiency for the patient to be alive without medical tools to filtrate the
blood. At this deadly stage patient requires blood dialysis or Kidney transplant to survive CKD patients.
2.3 Related works and Comparative studies
Although the unstructured form of medical data and its nature of being geographically diverse makes it difficult to automate the classification of the disease that much complicated. Usually those data has geographical, racial and cultural partiality. And often clinical symptoms for a disease varies over different regions. So the data is often biased towards particular set of values or characteristics. The difficulty of integrating different set of data is a challenge itself for medical automation.
Despite those challenges there have been various studies in the field which endeavored to classify CKD with a range of data mining techniques. Many of those has been breaking new grounds and has brought new ideas to classify renal disorders.
Some of those are discussed below.
Dr. S. Vijayarani and Mr S Dhayanand [8] from Bharathiar University, India;
developed models to classify renal disorders using Naive Bayes and SVM (support vector machine algorithm). The model was trained by using dataset of six attributes which are Age, Gender, Urea, Creatinine and GFR. The model’s class values classified patient’s kidney status in five different categories which are Normal, Acute Nephritic Syndrome, Chronic kidney disease, Acute renal failure and Chronic Glomerulonephritis. This was in fact a comparative studies between how the Naïve Bayes and SVM models compare in degree of accuracy and efficiency. The SVM model has a significantly higher value of accuracy then that of the Naïve Bayes. The SVM model had classified 70.96% of the instances accurately while the Naïve Bayes model classified 70.32% of the instances in the test dataset.
©Daffodil International University 13 Abhinandan Dubey [9] in 2015used clustering method to classify Chronic Kidney
disease.The Final result had three different clusters K1, K2, k3. Two of those clusters K1 and K3 had a full probability of falling into the CKD class where the K2 had a probability of .50545. So the K2 class cannot classify a single class which has both values CKD or Non-CKD.
Abeer Y. Al-Hyari, Ahmad M. Al-Taee, Majid A. Al-Taee [10] in 2013 used fourteen different attributes to classify kidney disease and Chronic Renal Failure and Normal class. They used three different algorithms which includes neural network, Naive Bayes and Decision tree. The DT algorithm had the highest degree of accuracy of 92.2% while Naive Bayes and ANN had an accuracy of 88.2% and 82.4%.
Subasi A., Alickovic E., Kevric J. [11] in the field of medical science the importance of diagnosis a disease is very important. They developed a computational system to predicting CKD using Machine learning techniques. And they showed that RF (Random Forest) Algorithm is better for use to predict similar diseases.
Andrew Kusiaka, Bradley Dixonb, ShitalShaha [12] predicted the survival time of an ESRD patients to optimize effort and cost giving hemodialysis to patients using Decision tree and RS algorithm. DT had a success rate of 67% where the RS algorithm had 56% success rate.
S.Ramya, Dr. N.Radha [13] in 2016 the purpose of this work is to classify the different stages of chronic kidney disease according to its severity. They used Back propagation Neural Network, Radial Basis Function and Random forest classification algorithms for predicting CKD. The models are evaluated with four different
measures like Kappa, Accuracy, Sensitivity and Specificity. The best accuracy provided by Radial Basis Function for predicting CKD and the accuracy is 85.3%.
©Daffodil International University 14 Mohammed Abdul Khaleel and Sateesh Kumar Pradham [14] Nowadays the use of
data mining techniqueson medical data for finding pattern, classification etc.
becoming familiar for diagnosis and decision making. In this paper they used data mining techniques for finding locally frequent pattern in terms of CPSA (cost, performance, speed, accuracy). And also they collate between some data mining approach with useful methods.
Maojo V., Sanandrés J. [15] in this paper they discuss about various data mining techniques and tools that used in the scientific world, mostly that can associated with medical application.
Alickovic, Emina&Subasi, Abdulhamit. [16] They applied Bayesian Network, Decision tree (J48), Multilayer Perceptron and Support Vector Machine (SMO SVM) for classifying Breast Cancer Wisconsin (Diagnostic) Data Set (WDBC). The SMO SVM achieved the accuracy of 97.72%.
2.4 Research Summary
So as the previous literature survey and study demonstrates there has been decent number of studies in this field. The studies has been fairly successful in their own way. This type of computerized classification problem has been researched on many other diseases. From studying different algorithm to making re-optimization to the existing algorithm to find better results, researchers has gone through many different ways. The noticeable factor is that although the accuracy has been quite good, yet we have not seen any real implementation of this processes. Probably the idea of consulting a computerized diagnosis system for a disease isn’t as convincing as consulting a doctor for the public. But with more accuracy and some experimental periods, a fully automated diagnosis probably would be as normal as consulting a doctor.
©Daffodil International University 15 2.5 The scope of this problem
The scope of this problem is to classify our dataset using different machine learning algorithms which includes training and testing the model. We will try to explore the correlation between the dataset attributes to find out there dependency on each other in the development of chronic kidney disease.
In Bangladesh an automated diagnosis system would reduce the lengthy process in health care. With an improved symptoms analyzing algorithm, the system can suggest diagnostic test to the users hence reducing time and cost in big hospitals.
2.6 Challenges
The primary challenge for this thesis is to collect data on kidney disease in Bangladesh. The dataset we used is detailed and was well pre-processed. In contrast, finding this type of dataset is quite difficult in Bangladesh. Same patient’s data are not kept in a structured way. So test results for the same person is hard to find collectively. Besides the tests are often done discreetly. And all the test for required data are usually not done. So the data is in incomplete form. So with this kind of data results in insufficient or biased training which will result in lower accuracy.
The type of data is also important for the training of the model. Quite often the patient affected in kidney disease comes at a very late stage and so the model is trained with the data for which most of its class value is classified as CKD. So the model later cannot classify the initial form of CKD which is disruptive to build an efficient model.
©Daffodil International University 16
CHAPTER 3
RESEARCH METHODOLOGY
3.1 Introduction
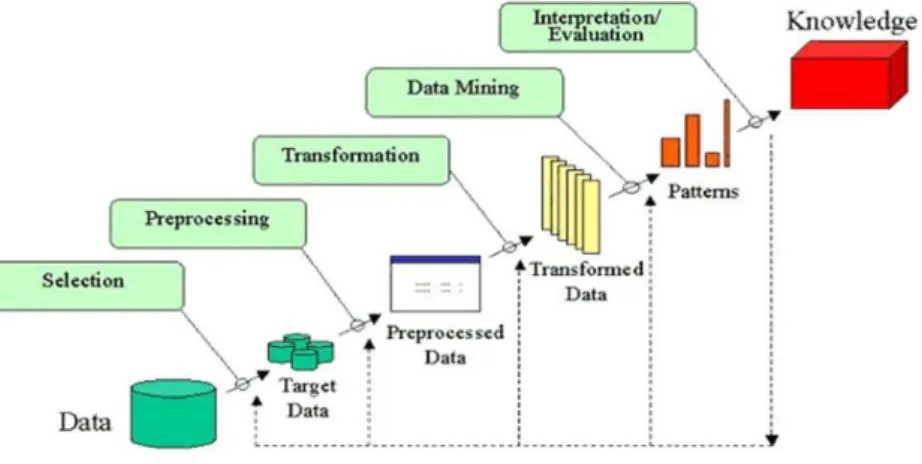
Data Mining is a technique where large volume pre-existing raw data in database is processed, or altered to needs and analyzed to reveal useful patterns and new relations among attributes for achieving various goals. Data mining is also called knowledge discovery in databases also known as KDD.
Figure 3.1: Steps associated with KDD
For a long time conventional data analysis techniques through statistical approach has been used. This approach has been very useful and no doubt it will be still be used in the foreseeable future As the storage capacity of modern computers increased, accumulating and preserving various transactional and other types of data became more convenient. Inevitably the size and diversity of the data grew larger and traditional data analysis techniques began to be less effective and inefficient for such large amount of data warehouses. So data mining and machine learning techniques gained popularity among large companies and researchers.
©Daffodil International University 17 The latest explosion of Medical data through machine automation and use of
computerized technology in diagnosis and treatment of disease has made the data mining and machine learning a “Gold Mine” for extracting new patterns and useful knowledge in medical advancement. Al though the acceptance of an automated classification of disease is still not popular and desirable among medical community, it is still a research area of enormous potential for data scientist and researchers around the globe.
So in our endeavor we will try to explore this concept of data mining to help automation of the classification of chronic Kidney disease CKD).
3.2 About Dataset
The source of the dataset we used for the proposed system has been prepared at Apollo Hospital in Tamil Nadu of India. The owner of the dataset graciously made the dataset available in the machine learning data site Kaggle.com from which we gained access to the dataset. Followings are the information of the creative personal of this dataset.
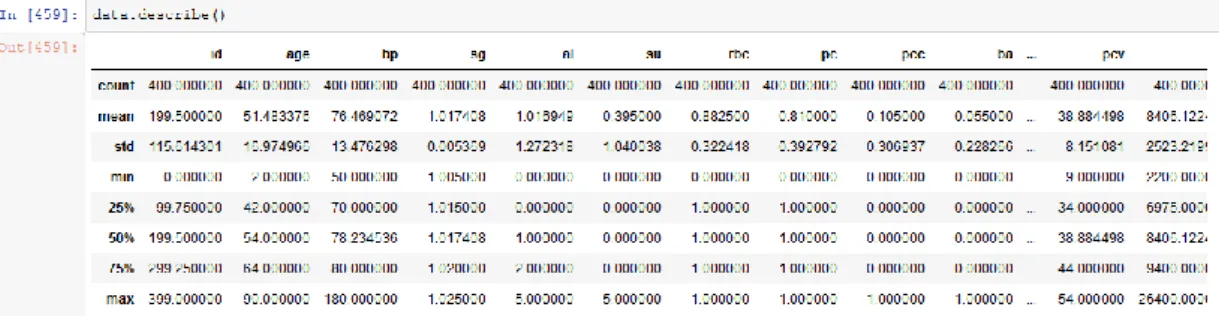
The data set had 20 different attributes and 400 instances. The class value for this data set is CKD which refers to the prevalence of kidney disorder in a patient and other one is Non-CKD indicates vice-versa. The dataset has 250 instances of the class value
“CKD” and the other 150 has been classified as a NON-CKD.
3.3 Data Description and Preprocessing
In table 3.1 we have listed the attributes in the data set.
Table 3.1: - Attributes in the used dataset
Attributes Attribute Description Attributes Attribute Description
age Age Sod- Sodium
bp blood pressure Pot- Potassium
©Daffodil International University 18
sg specific gravity Hemo- Hemoglobin
al Albumin Pcv- packed cell volume
su Sugar Wc- white blood cell count
rbc red blood cells Rc- red blood cell count
pc pus cell Htm- Hypertension
pcc pus cell clumps Dn- diabetes mellitus
ba- Bacteria Cad- coronary artery disease
bgr blood glucose random Appet- Appetite
bu- blood urea Pe pedal edema
Sc- serum creatinine Ane Anemia
Class CKD / Non-CKD
❏ Age: Age is considered to be a factor in developing CKD as the decaying of kidney function accelerates as people gets older. It is of numerical value in the data set.
❏ Blood Pressure: Blood Pressure can be an important health parameter as the existence of Hypertension increases the risk of CKD. It is a nominal value in the data set which is measured in the unit of mm/Hg.
❏ Specific Gravity: specific gravity or in the context of clinical urology term
“Urine specific gravity” is the ratio of the excreted substance to the water density in the urine. In the data set it has five values.
❏ Albumin: Albumin is a substance that is often found in the urine if the kidney has a disruptive functionality. Albumin is a protein based substance which should not be present in the urine of a healthy person. In the dataset the albumin attribute is a nominal attribute with values of (1, 2, 3, 4, and 5).
©Daffodil International University 19
❏ Sugar: Measurement of the on spot glucose level. It is of numerical value.
❏ RBC: The measurement of Red Blood Cell in the blood. RBCs takes oxygen while breathing in the lungs and this oxygen enter in the lungs through the blood vessels releasing in tissues squeezing through the capillaries. The presence of RBC is suggestive of defective excretion of the blood in the kidney. In the data set it has numerical values.
❏ Pus cell: It consists of white blood cells or dead cells that generate while body’s immune systems get infected. Again pus cells in urine indicate the presence of harmful chemicals or substances in urine. This particular attribute classifies if the pus cell in the urine is of typical or of unusual nature. In the dataset it has nominal values of Normal and Abnormal.
❏ Pus cell clumps: plus cell clump indicates that the pus cell has been in the urine long enough and formed a clump which is indicative of more advanced level of infection. In the dataset this attribute indicates the presence of pus cell clumps. This is a nominal attribute with values of present and not present.
❏ Bacterial Infection: presence any bacteria in the urine sample.It is of nominal value which are “Present” or “Not Present”.
❏ Blood Glucose Random: Blood Glucose level with or without fasting. In the data set it is of numerical value. It has been measured in mgs/dl in this dataset.
❏ Blood Urea: This is the Urea Nitrogen level in the blood. A healthy kidney Separates and discharges the urea nitrogen through urine. A high level of blood urea means the kidney is filtering the urea nitrogen properly. In the dataset it has numerical values.
❏ Serum Creatinine: Creatinine clearance in urine is measured to estimate the GFR rate of kidney. Here serum creatinine is measured in mgs/dl and it is numerical in the dataset.
❏ Sodium: Sodium rate in the urine. Measured in mEq/L. It is of numerical value.
©Daffodil International University 20
❏ Potassium: Potassium rate in the urine. Measured in mEq/L. It is of numerical value.
❏ Hemoglobin: The hemoglobin level in the blood measured in gms.
❏ Packed Cell Volume: The red blood cell percentage in the Blood measured which is numerical.
❏ White Blood Cell count: The White Blood cell or WBC count in the blood.
The unit of measurement is cells/cumm.
❏ Red Blood Cell Count: The Red Blood cell or RBC count in the blood. The unit of measurement is cells/cumm.
❏ Hypertension: This attributes enlists if the patient has preexisting hypertension. It is nominal and has two values which are “Yes” or “No”.
❏ Diabetes Mellitus: This attributes suggests if the patient has a medical history of diabetes or not.
❏ Coronary Artery Disease: Coronary Artery Disease is the blockage of artery in the heart which is commonly referred to as blockage of the heart. It is nominal and has a “yes” or “no” value in the data set.
❏ Appetite: suggests if the patient has a lack of appetite or not.
❏ Class values: at last the class values for the data set are “CKD” referring to having chronic kidney disease and “NOT CKD”.
The dataset is quite extensive and detailed in its patient data with some of the
preprocessing already done. We did some preprocessing which we will be discussing in the next section.
©Daffodil International University 21 3.4 Screenshot of the dataset
Figure 3.2:-Dataset before pre-process
Figure 3.3: Dataset after pre-process 3.5 Classification Algorithms
In ML classification the aim is to prophesy the target class by analyzing the training dataset. Find the actual boundaries for every target class. In general by using the training dataset to get better boundary states which could be used to determine each target class. Whenever the boundary is determined, the next task is to predict the target class. And this process is called classification. Here we use some of the classification methods to predict the class level.
3.5.1: Random Forest Classifier
Random forest algorithm is mostly used supervised machine learning algorithm for regression and classification problem in the area of machine learning. In this algorithm it indeed generate the forest with certain amount of decision trees. For getting robust prediction higher the number of trees in the forest. It will give the best accuracy results.
©Daffodil International University 22 3.5.2: Logistic Regression
There are some machine learning algorithms from the area of statistics. Also known as go-to technique for classification problem in machine learning. Logistic Regression and Linear Regression is little bit similar because both have the goal of estimating the values for the parameters or coefficients. After train a model in machine learning we find out the relation between training and testing data.
3.5.3: Naive Bayes
Naive Bayes is a machine learning algorithm or classifier which uses the Bayes theorem with independent assumptions between features. The one dimensional Naive Bayes classifier computes the ratio of the log probabilities of the features belonging in all the classes. The naive Bayes classifier computes the class value probability assuming each of the attributes independently. Which means Naive Bayes does not considers the correlation between attributes. Naive Bayes is a very scalable classifier but it can create bias towards one or more attributes which often results inaccuracy.
©Daffodil International University 23
CHAPTER 4
EXPERIMENTAL RESULTS AND DISCUSSION
4.1: Introduction
In the following chapters we will discuss about the results of the conducted experiment. We will explore and compare the different classifier accuracy and performance. We will the results in graph and also in tables.
4.2: Experimental Results
Following Section from 4.2.1 - 4.2.3 extensively discusses the results from our study.
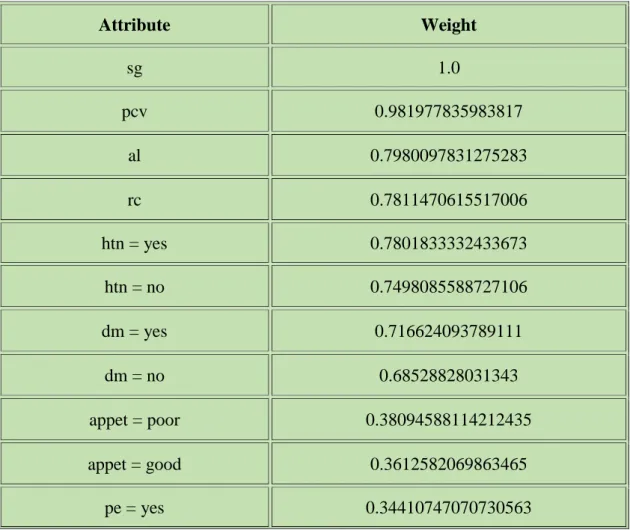
Here we see the weight of the all attributes. Weight is defined as the global importance of each of the attribute for the value of the target class which is independent of the modeling algorithm that we used in the study. Table 4.1 shows the weight of the attributes.
Table 4.1: Weight of the attributes
Attribute Weight
sg 1.0
pcv 0.981977835983817
al 0.7980097831275283
rc 0.7811470615517006
htn = yes 0.7801833332433673
htn = no 0.7498085588727106
dm = yes 0.716624093789111
dm = no 0.68528828031343
appet = poor 0.38094588114212435
appet = good 0.3612582069863465
pe = yes 0.34410747070730563
©Daffodil International University 24
pc = normal 0.34410747070730563
pe = no 0.32374292248419567
su 0.2482116957632279
ane = yes 0.24331692678811156
ane = no 0.2206705189308262
sc 0.17988274136984753
bp 0.17283514007109563
rbc = normal 0.15671613683800362
pcc = notpresent 0.1216142982799562
age 0.04006509319585821
wc 0.0
Figure 4.1: Weight of the attributes
The graph shows some interesting facts. The Albumin has the highest weight which is clearly obvious because albumin measurement is one of first clinical diagnosis test done for any CKD patients.
©Daffodil International University 25 The noticeable fact from the study is that the red blood cell count has a very high
weight of 0.986 which can be a very significant indication towards CKD detection as a low Red blood cell count might be suggestive of clinical attention of CKD. The other weight of the attributes are listed in the table 4.1.
In the table 4.2, 4.3 and 4.4 shows the confusion matrix for the different classifiers.
4.2.1: Naive Bayes Confusion Matrix Table 4.2: Confusion Matrix of Naive Bayes
Figure 4.2: Important factors for ckd in Naïve Bayes
Figure 4.3: Important factors for nckd in Naïve Bayes
©Daffodil International University 26 4.2.2: Logistic Regression Confusion Matrix
Table 4.3: Confusion Matrix of Logistic Regression
Figure 4.4: Important factors for ckd in Logistic Regression
Figure 4.5: Important factors for nckd in Logistic Regression
4.2.3: Random Forest Confusion Matrix Table 4.4: Confusion Matrix of Random Forest
©Daffodil International University 27 Figure 4.6: Important factors for ckd in Random Forest
Figure 4.7: Important factors for nckd in Random Forest Figure 4.8 to 4.17 shows all the tree generated in Random Forest Classifier..
Figure 4.8: Random forest tree 1
©Daffodil International University 28 Figure 4.9: Random forest tree 2
Figure 4.10: Random forest tree 3
©Daffodil International University 29 Figure 4.11: Random forest tree 4
Figure 4.12: Random forest tree 5
©Daffodil International University 30 Figure 4.13: Random forest tree 6
Figure 4.14: Random forest tree 7
©Daffodil International University 31 Figure 4.15: Random forest tree 8
Figure 4.16: Random forest tree 9
©Daffodil International University 32 Figure 4.17: Random forest tree 10
4.3: Potential Future Improvement
The study shows that an automated system can be implemented in the clinical diagnosis of Chronic Kidney Disease. With more training data and more efficient algorithm this can be a real life implementation for clinical diagnosis in Bangladesh.
Bangladesh medical system can accumulate more clinical data in an organized and structured way where each patient’s medical data can be secured which can be later be used in many different studies for other diseases and also incorporate with the existing system for automated classification and detection of those diseases.
4.4: Summary
In brief the Random Forest Classifier had the most accurate detection of the disease which is 97.5%.
Although numerically the result is pretty high that might be the result of an insufficient and partial data.
©Daffodil International University 33
CHAPTER 5
SUMMARY, CONCLUSION, RECOMMENDATION AND IMPLICATION FOR FUTURE RESEARCH
5.1: Summary of the study
Shows the accuracy of the models that we use along with the runtimes.
Figure 5.1: Accuracy of all classifiers
Figure 5.2: Runtime of all classifiers
Shows the ROC curves for all models, together on one chart. The closer a curve is to the top left corner, the better the model is. Only shown for two-class problems.
©Daffodil International University 34 Figure 5.3: ROC Comparison Curves
5.2: Conclusion
So to conclude it all, we have used three different classifier among which the Random Forest classifier had the highest level of accuracy. Although the other classifier also gave very close and accurate result compared to Random Forest Classifier.
5.3: Recommendation
So this Model can be used with convincing accuracy for a Clinical testing period to find out its feasibility and sustainability in practical use. More clinical data needs to be amassed with required data organization which should be used to train the model order for it to be used as a truly medically comprehensive platform for automated CKD detection.
5.4: Implication for further studies
Further studies can be undertaken on various other diseases using similar techniques and more data on other clinical health problems should be accumulated in order for similar studies.
Web based or android based application can be developed with permission and supervision from appropriate authorities for public usage of the platform. Further studies in the field required for achieving clinical accuracy and reliability.
©Daffodil International University 35
REFERENCES
[1] Andrew S. Levey, MD; Josef Coresh, MD, PhD; Ethan Balk, MD, MPH; Annamaria T. Kausz, MD, MS; Adeera Levin, MD; Michael W. Steffes, MD, PhD; Ronald J. Hogg, MD; Ronald D. Perrone, MD; Joseph Lau, MD; and Garabed Eknoyan-2002 “National Kidney Foundation Practice Guidelines for Chronic Kidney Disease: Evaluation, Classification, and Stratification.”
[2] Methods of Estimating GFR – Different Equations Including CKD-EP Christopher M Florkowski and Janice SC Chew-HarrisPMCID: PMC3100284
[3] KDOQI US Commentary on the 2012 KDIGO Clinical Practice Guideline for the Evaluation and Management of CKD Lesley A. Inker, MD,1 Brad C. Astor, PhD,2 Chester H. Fox, MD,3 Tamara Isakova, MD,4James P. Lash, MD,5 Carmen A. Peralta, MD,6 ManjulaKurella Tamura, MD,7 and Harold I. Feldman, MD, MSCE8
[4] Methods of Estimating GFR – Different Equations Including CKD-EPI Christopher M Florkowski , and Janice SC Chew-Harris ; PMCID: PMC3100284 ---- NCBI
[5] Principles of Renal Physiology by Christopher J. Lote 4th Edition.
[6] KDOQI. KDOQI clinical practice guidelines and clinical practice recommendations for diabetes and chronic kidney disease. Am J Kidney Dis. 2007; 49(2 Suppl 2):S12–154
[7] Okada R, Yasuda Y, Tsushita K, Wakai K, Hamajima N, Matsuo S. Glomerular hyperfiltration in prediabetes and prehypertension. Nephrol Dial Transplant. 2012; 27(5):1821–5.
[8] Dr. S. Vijayarani , Mr.S.Dhayanand (2015) – “DATA MINING CLASSIFICATION ALGORITHMS FOR KIDNEY DISEASE PREDICTION” Published in - International Journal on Cybernetics & Informatics (IJCI) Vol. 4, No. 4, August 2015
[9] AbhinandanDubey (2015) - “A Classification of CKD Cases Using MultiVariate K-Means Clustering” International Journal of Scientific and Research Publications, Volume 5, Issue 8, August 2015 1ISSN 2250-3153.
[10] Abeer Y. Al-Hyari ,Ahmad M. Al-Taee , Majid A. Al-Taee (2013) - “ Clinical Decision Support System for Diagnosis and Management of Chronic Renal Failure” ; 2013 IEEE Jordan Conference on Applied Electrical Engineering and Computing Technologies (AEECT).
[11] Subasi A., Alickovic E., Kevric J. (2017) “Diagnosis of Chronic Kidney Disease by Using Random Forest” In: Badnjevic A. (eds) CMBEBIH 2017. IFMBE Proceedings, vol 62. Springer, Singapore
©Daffodil International University 36 [12] AndrewKusiaka, Bradley Dixonb, ShitalShaha - “Predicting survival time for kidney dialysis
patients: a data mining approach” - Computers in Biology and Medicine 35 (2005) 311–327
[13] S.Ramya, Dr. N.Radha - “Diagnosis of Chronic Kidney Disease Using Machine Learning Algorithms” - International Journal of Innovative Research in Computer and Communication Engineering (An ISO 3297: 2007 Certified Organization) Vol. 4, Issue 1, January 2016.
[14] Mohammed Abdul Khaleel and Sateesh Kumar Pradham, “A Survey of Data Mining Techniques on Medical Data for Finding Locally Frequent Diseases”, International Journal of Advanced Research in Computer Science and Software Engineering, 2013, Vol.3, No. 8, pp. 149-153.
[15] Maojo V., Sanandrés J. (2000) A Survey of Data Mining Techniques. In: Brause R.W., Hanisch E.
(eds) Medical Data Analysis. ISMDA 2000. Lecture Notes in Computer Science, vol 1933. Springer, Berlin, Heidelberg.
[16] Alickovic, Emina&Subasi, Abdulhamit. (2011). Data Mining Techniques for Medical Data Classification.
[17] Shuchi Anand, Masuma Akter Khanam, Juliann Saquib, Nazmus Saquib, Tahmeed Ahmed, Dewan S Alam, Mark R Cullen, Michele Barry, and Glenn M Chertow “High prevalence of chronic kidney disease in a community survey of urban Bangladeshis: a cross-sectional study” 2014 Feb 20.
doi: 10.1186/1744-8603-10-9
©Daffodil International University 37 PLAGARISM REPORT
Score: 08% similarity
![Table 2.1: GFR stages to classify CKD [3]](https://thumb-ap.123doks.com/thumbv2/filepdfnet/11106643.0/16.892.134.809.274.759/table-2-1-gfr-stages-classify-ckd-3.webp)
![Figure 2.1: Proposed clinical progression of diabetic kidney disease [3]](https://thumb-ap.123doks.com/thumbv2/filepdfnet/11106643.0/17.892.242.693.754.1042/figure-2-proposed-clinical-progression-diabetic-kidney-disease.webp)