BY
MD. AMIRUL HASAN PULOK ID: 171-15-9453
SUMAYIA ISLAM ID : 171-15-8976 ISRAT JAHAN JEMI
ID : 171-15-8655
This Report Presented in Partial Fulfillment of the Requirements for the Degree of Bachelor of Science in Computer Science and Engineering
Supervised By Lamia Rukhsara
Lecturer Department of CSE
Daffodil International University Co-Supervised By
Dr. Sheak Rashed Haider Noori Associate professor & Associate Head
Department of CSE
Daffodil International University
DAFFODIL INTERNATIONAL UNIVERSITY
DHAKA, BANGLADESHJUNE 2021
APPROVAL
This Project titled“Early Prediction of students' result using Machine Learning
Technique”, submitted byMd. Amirul Hasan Pulok, ID No:171-15-9453andSumayia Islam, ID No:171-15-8976 andIsrat Jahan Jemi, ID No:171-15-8655to the Department of Computer Science and Engineering, Daffodil International University, has been
accepted as satisfactory for the partial fulfillment of the requirements for the degree of B.Sc. in Computer Science and Engineering and approved as to its style and contents.
The presentation has been held on01 June 2021.
BOARD OF EXAMINERS
______________________
Dr. Touhid Bhuiyan Professor and Head
Department of Computer Science and Engineering Faculty of Science & Information Technology Daffodil International University
Chairman
____________________
Md. Tarek Habib Assistant Professor
Department of Computer Science and Engineering Faculty of Science & Information Technology Daffodil International University
Internal Examiner
________________________
Saiful Islam Senior Lecturer
Department of Computer Science and Engineering Faculty of Science & Information Technology Daffodil International University
________________________
Dr. Md Arshad Ali Associate Professor
Department of Computer Science and Engineering Hajee Mohammad Danesh Science and Technology University
External Examiner
©Daffodil International University
We hereby declare that this project has been done by us under the supervision of Lamia Rukhsara, Lecturer, Department of CSE Daffodil International University. We also declare that neither this project nor any part of this project has been submitted elsewhere for award of any degree or diploma.
Supervised by:
Lamia Rukhsara Lecturer
Department of CSE
Daffodil International University Co-Supervised by:
Dr. Sheak Rashed Haider Noori Associate professor & Associate Head Department of CSE
Daffodil International University Submitted by:
Md. Amirul Hasan Pulok ID: 171-15-9453
Department of CSE
Daffodil International University Sumayia Islam
ID: 171-15-8976 Department of CSE
Daffodil International University Israt Jahan Jemi
ID: 171-15-8655 Department of CSE
Daffodil International University
ACKNOWLEDGEMENT
First we express our heartiest thanks and gratefulness to almighty God for His divine blessing makes it possible to complete the final year research based project/internship successfully.
We are really grateful and wish our profound indebtedness to Lamia Rukhsara, Lecturer,Department of CSE Daffodil International University, Dhaka. Deep Knowledge
& keen interest of our supervisor in the field of “Data Mining” to carry out this research based project. His endless patience ,scholarly guidance ,continual encouragement , constant and energetic supervision, constructive criticism , valuable advice ,reading many inferior drafts and correcting them at all stages have made it possible to complete this research based project.
We would like to express our heartiest gratitude to Professor Dr. Touhid Bhuiyan, Professor & Head, Department of CSE, for his kind help to finish our research based project and also to other faculty members and the staff of CSE department of Daffodil International University.
We would like to thank our entire course mate in Daffodil International University, who took part in this discussion while completing the course work.
Finally, we must acknowledge with due respect the constant support and patients of our parents.
©Daffodil International University
ABSTRACT
In this century, educational institutes have stored a lot of student data which is increasing constantly. This data contains various attributes like student grades, school, and family-related features. It is needed to analyze those data to predict students’
performance for the development in the field of education. To evaluate this study, we have applied Machine Learning Algorithms like Simple Linear Regression, Support Vector Regression
,
Random Forest Regression. This research also aims to prove how different factors and variables affect the predicted student's success rate.Keyword: data preprocessing, visualization, correlation matrix, descriptive statistics, scatter plot, train dataset, test dataset, linear regression, coefficient, intercept, accuracy, educational data mining, machine learning
Board of examiners i
Declaration ii
Acknowledgments iii
Abstract iv
Keyword v
CHAPTER
CHAPTER 1: INTRODUCTION
5-61.1 Introduction 5
1.2 Motivation 5
1.3 Objective 6
CHAPTER 2: RELATED WORK
72.1 Data Mining 7
2.2 EDM- Educational Data Mining 7
CHAPTER 3: RESEARCH METHODOLOGY
8-93.1 Dataset Description 8
3.3 Working Methodology 9
4.1 Data Pre-processing 10
4.2 Libraries 10-11
4.3 Import Data-Set 11
4.4 Discover and Visualize 13-19
4.5 Data Cleaning 19-20
4.6 Data Splitting 20-21
CHAPTER 5: MODEL SELECTION, TRAIN, AND TEST
22-265.1 Model Selection and Training 22-25
5.2 Overall Accuracy 25-26
CHAPTER 6: CONCLUSION
276.1 Conclusion 27
6.2 Limitation and Future work 27
REFERENCES
28LIST OF FIGURES
FIGURES PAGE NO
Figure 3.1: The attribute of the dataset 8
Figure 4.2: Different types of Libraries 11
Figure 4.4: The First five row of the data frame 12
Figure 4.4.2: View of data type 13
Figure 4.4.3: Representation of the entire 14
Figure 4.4.4: Scatter plot of G1 vs G3 14
Figure 4.4.5: Scatter plot of G1 vs G2 15
Figure 4.4.6: Correlation matrix to visualize the data 16
Figure 4.4.6: Figure of Most correlated with G3 17
Figure 4.5.1: Figure of checking null value 19
Figure 4.5.2: Procedure of cleaning the dataset 20
Figure 4.6.1: Split dataset as explanatory variables and response variable 20 Figure 4.6.2: Split the dataset into a training set and test set 21 Figure 5.1.1: Train and Test of Random Forest Regression 22-23 Figure 5.1.1: Train and Test of Linear Regression 24-25
©Daffodil International University
LIST OF TABLES
TABLES PAGE NO
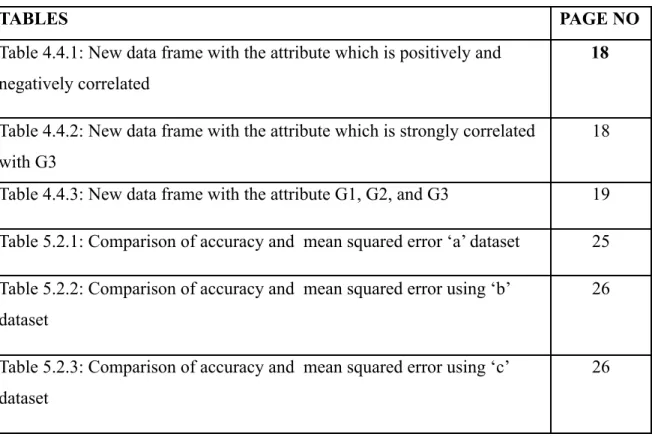
Table 4.4.1: New data frame with the attribute which is positively and negatively correlated
18
Table 4.4.2: New data frame with the attribute which is strongly correlated with G3
18
Table 4.4.3: New data frame with the attribute G1, G2, and G3 19 Table 5.2.1: Comparison of accuracy and mean squared error ‘a’ dataset 25 Table 5.2.2: Comparison of accuracy and mean squared error using ‘b’
dataset
26
Table 5.2.3: Comparison of accuracy and mean squared error using ‘c’
dataset
26
CHAPTER 1 Introduction
1.1 Introduction:
Data mining tools can extract important knowledge, information even what is going to happen in the future. The prediction of students' results is beneficial not only for students but also for educators and the academic sector.To improve teaching techniques and environment, institutes need to mine educational data. Hidden knowledge of the learning process can help educators to understand students' motives. Various data mining
techniques used to solve certain educational problems. We can obtain students'
performance from measuring the co-curriculum of the institute and learning assessment of students. Recently in the education area, data mining is applied widely so that educators can monitor their students' achievements and their learning activities and it also allows the administration to improve their system performance. Basically, institutions stored large amounts of data related to students, educators, and administrators. We can use those kinds of data for prediction.
For predicting students' performance we have studied various existing prediction models. Machine learning techniques are quite smart and efficient compared to other methods.
1.2 Motivation:
Educational institutions are playing an important and vital role in the growth and development of a nation.
Prediction of a student's performance in the educational sector is also important as well.
If educational institutes could predict the result of the students in advance then the institute will be able to focus on students who fail to achieve the expected results.
©Daffodil International University
1.3 Objective:
1. We want to reduce student’s academic failure rate using an early prediction model.
2. We want to expand the road map for students to get better results.
3. Prediction model takes data as input from the educational database and also from the students.
CHAPTER 2 Related Work
2.1 Data Mining:
Data mining is an established framework nowadays. It is the process to discover meaningful patterns from large amounts of data which mainly provide methods and tools to enable a wide variety of techniques. Data mining has different types such as text mining, social media mining, audio mining, web mining, video mining. It is not easy to store a lot of massive amounts of data. For this purpose, many relational database servers are being built continuously.
Data mining mainly provides various types of methods to predict results which include clustering, classification, and association rule algorithms. Clustering is the process of grouping data or records into classes. Classification is the process of constructing a pattern. It is the testing set classifier based on the training set. Association rule is a process of rule-based machine learning methods.
2.2 EDM- Educational Data Mining:
Educational Data Mining (EDM) has recently been highlighted in the data mining field.
It mainly concerns the developing method to explore the unique prediction model.
Educational data mining has contributed to some theories of machine learning by researchers in the learning sciences and educational psychology. EDM mainly works about predicting students' future learning behavior, starting the effects of educational support, discovering or improving domain models, and advancing scientific knowledge about learning and learners and its prediction models are basically operated two support decision making processes and policy. It is not only useful for student progress but also beneficial for mentors and institutes. It is improving comprehension of learners' domain representations and also evaluation of learners' engagement improving in the learning tasks.
©Daffodil International University
CHAPTER 3
Research Methodology
3.1 Dataset Description:
Dataset: To do this research we have used a dataset which is collected from two Portuguese Schools. It is collected by some questionnaires and using school reports.
There is 32 attributes we have got which is important to analyze and predict student performance.
Figure 3.1: The attribute of the dataset
3.2 Working Methodology:
For this research, we have used Kaggle Notebook. It is the largest data science community with various types of useful tools which are most important to analyze datasets. We will go through a few steps to predict the result of the student.
a) We will first visualize the dataset that we have collected b) Select an attribute and transform the data into a feature
c) Then we will clean the dataset where the index has a null value or Zero value d) Split the dataset to train the machine
e) Train to the machine and measure the accuracy
©Daffodil International University
CHAPTER 4 Data Preprocessing
4.1 Data Pre-processing Concept:
“Data Preprocessing is an important step for data mining. When we work with a data set we get noises, missing values, and maybe an unusable format that cannot be directly used for machine learning models[10].” It is mandatory to clean and put data in a formatted way to do various kinds of operations. From the data preprocessing concept, If there is any missing or duplicate value present in the dataset then we must replace, delete or clean and make it suitable for a machine learning model. Data pre-processing also increases the accuracy and efficiency
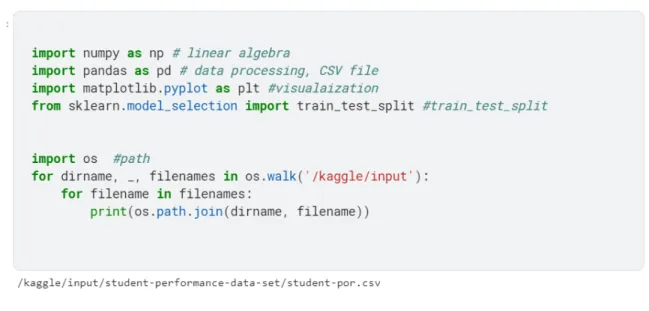
4.2 Libraries:
To implement machine learning algorithms we have used various Libraries such as Panda, NumPy, Seabon.
Pandas is an open-source library that is one of the most widely-used data science libraries. It makes data processing and wrangling easy, ingesting data from tons of different sources like SQL, CSV. Panda is great for manipulation features like handling imputing missing data files, missing data, manipulating columns.
Numpy library is heavily used in deep learning and machine learning and this is an absolute must for any computationally heavy algorithms and analyses. Its
Multi-dimensional arrays also make complex problems infinitely easier.
Seaborn’s correlation graphs make it super easy to visually spot correlation across all of the dimensions of the dataset. Seaborn is easily accessible and a great tool for quickly visualizing data.
Fig 4.2: Different types of Libraries
4.3 Import Data-Set:
Using the panda library we have imported data into DataFrame. The read_csv function is used to read data from a CSV file and store it into a data frame as df.
©Daffodil International University
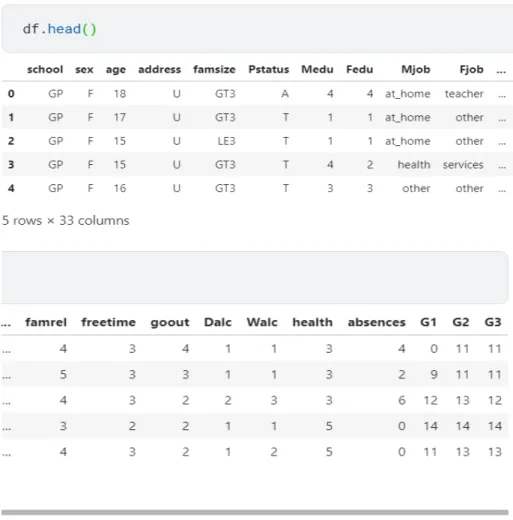
The first five rows and all the columns show the data which is stored in the dataset.
Figure 4.4.1: The First five row of the data frame
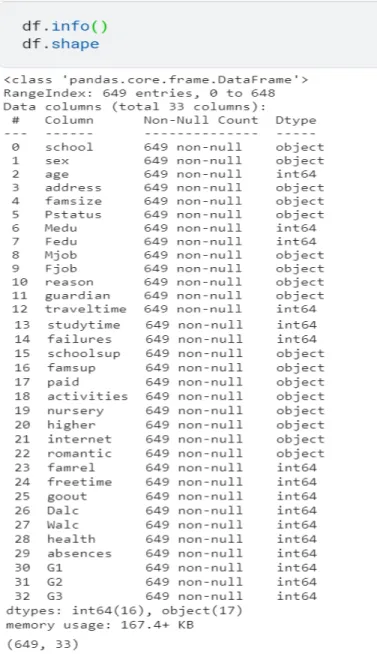
We have to know what kind of data is present in the dataset. In Figure 4.4.2 We can see that there are two types of data available in the dataset, one is numeric features and another is categorical features.
Figure 4.4.2: View of data type
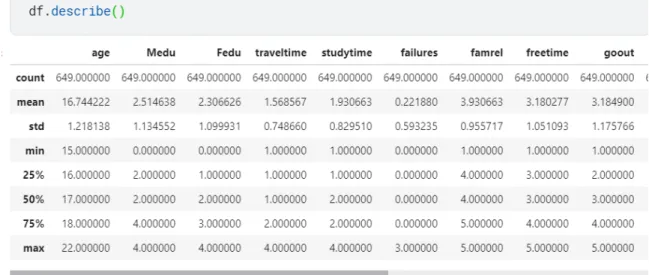
We need to find the numerical value of the dataset, we used a describe function.
From Figure 4.4.3 description we get detailed information of numerical value.
©Daffodil International University
Figure 4.4.3: Representation of the entire or a sample of a population
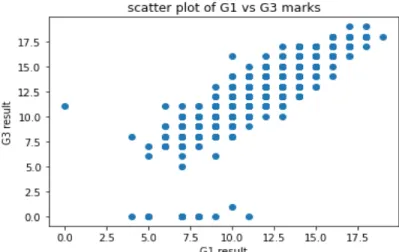
Results attribute is G1, G2, and G3, we want to check the linear relationship between them.
Figure 4.4.4: Scatter plot of G1 vs G3
Figure 4.4.5: Scatter plot of G1 vs G2
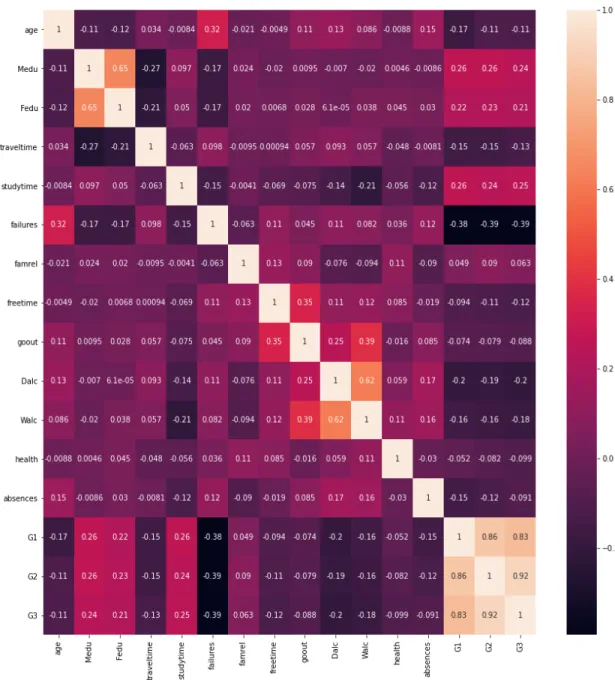
We made a Correlation matrix to visualize the data set and check which are strongly correlated with each other.
©Daffodil International University
Figure 4.4.6: Correlation matrix to visualize the data
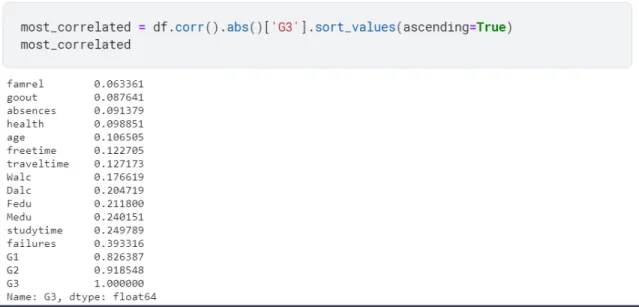
The correlation matrix shows that G1, G2, and G3 are positively and negatively correlated with other attributes. So we want to find which attributes are most correlated with G3.
Figure 4.4.6: Figure of Most correlated with G3
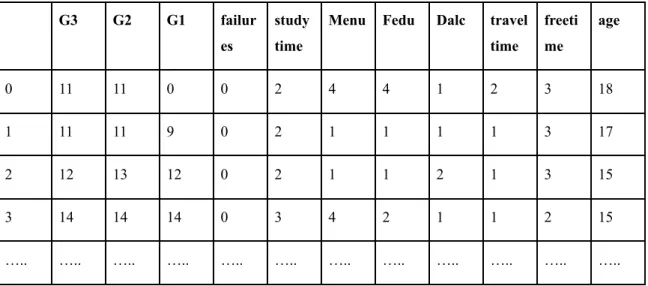
Now we will create three new datasets.
a) Created with the attributes that have greater than 0.10 relation with G3.
The new attributes are
'G3','G2','G1','failures’,’studytime','Medu','Fedu','Dalc','Walc','traveltime','f reetime','age' which are positively and negatively correlated.
b) Created with the attributes
'G3','G2','G1','studytime','Medu','Fedu','freetime','famrel' which is only positively correlated.
c) Created with G1, G2, and G3 attributes.
©Daffodil International University
G3 G2 G1 failur es
study time
Menu Fedu Dalc travel time
freeti me
age
0 11 11 0 0 2 4 4 1 2 3 18
1 11 11 9 0 2 1 1 1 1 3 17
2 12 13 12 0 2 1 1 2 1 3 15
3 14 14 14 0 3 4 2 1 1 2 15
….. ….. ….. ….. ….. ….. ….. ….. ….. ….. ….. …..
Table 4.4.2: New data frame with the attribute which is strongly correlated with G3
G3 G2 G1 study
time
Menu Fedu freetime famrel
0 11 11 0 2 4 4 3 1
1 11 11 9 2 1 1 3 1
2 12 13 12 2 1 1 3 2
3 14 14 14 3 4 2 2 1
….. ….. ….. ….. ….. ….. ….. ….. …..
G3 G2 G1
0 11 11 0
1 11 11 9
2 12 13 12
4.5 Data Cleaning:
Data cleaning is a process to remove incorrect, incomplete, corrupted, duplicate, data in a dataset. We have to check if there is any null or zero value present in the data set, if there are any we will leave those rows because where the student got 0 (Zero) because it looks like he/she didn’t attend the examination.
Figure 4.5.1: Figure of checking null value
©Daffodil International University
Figure 4.5.2: Procedure of cleaning data set
4.6 Data Splitting:
To train the machine learning algorithm we have to prepare the data set so that the machine can understand. We want to predict the student’s final Grade G3 so we divide the data into X as explanatory variables and y as the response variable.
Figure 4.6.1: Split dataset as explanatory variables and response variable
To train and test, it needs to split the data set into a training set and test set where 80%
data will be used as training and 20% data as testing.
Figure 4.6.2: The figure of Splitting the dataset into train and test
©Daffodil International University
Model Selection and Training
5.1 Model selection and Training:
To evaluate the prediction we have used a) Random Forest Regression, b) Linear Regression, then trained the model. After training, we have tested the result, accuracy, and mean squared error.
For training and testing the model, we used “a” dataset once and “b” dataset again and lastly “c” dataset which we created early.
Random Forest Regression:
Figure 5.1.1: Train and Test of Random Forest Regression using c dataset
©Daffodil International University
Linear Regression:
Figure 5.1.1: Train and Test of Linear Regression using c dataset
5.2 Overall Accuracy:
After training, we have a test on the model using the test dataset.
Using three datasets which has different parameter results below,
Table 5.2.1: Comparison of accuracy and mean squared error ‘a’ dataset
Model Accuracy Mean Square Error Accuracy %
Random Forest Regression
0.867 0.9103 86.7%
Linear Regression 0.904 0.655 90.4%
©Daffodil International University
Table 5.2.2: Comparison of accuracy and mean squared error using ‘b’ dataset
Model Accuracy Mean Square Error Accuracy %
Random Forest Regression
0.872 0.878 87.8%
Linear Regression 0.907 0.637 90.7%
Table 5.2.3: Comparison of accuracy and mean squared error using ‘c’ dataset
Model Accuracy Mean Square Error Accuracy %
Random Forest Regression
0.892 0.738 89.2%
Linear Regression 0.906 0.644 90.6%
Conclusion
6.1 Conclusion:
From the data set, we got G1 which is the 1st semester's result, G2 which is the 2nd semester's result, and G3 is the 3rd semester's result or the final result. We also got numerical and categorical values. We used only numerical values for prediction.
It looks like the original result and predicted result are almost the same. There are three different datasets we have created which hold different parameters or attributes. The predicted results of the 3rd semester are quite different from each data set.
It is clear to see that positively correlated parameters affect the prediction.
6.2 Limitation and Future Work:
To do this prediction we got only 600+ data which is a quite small amount of data compared to an institute.
We produce 2.5 quintillion bytes of data per day worldwide including educational data.
So institutions should publish a lot of data for research purposes.
If a lot of institutional data is available with more features then it is possible to increase the prediction accuracy applying various machine learning algorithms should be the future work.
©Daffodil International University
REFERENCE:
[1] Pushpa S.K, Manjunath T.N, “Class result prediction using machine learning”,
InternationalConference On Smart Technologyfor Smart Nation,2017,pp1208-1212. Micheal Bowles, Machine Learning in Python: Essential Techniques for Predictive Analysis. John Wiley & Sons, Inc. 2015.
[2] A. M. Shahiri, W. Husain, and N. A. Rashid, “A Review on Predicting Student’s Performance Using Data Mining Techniques,” in Procedia Computer Science, 2015.
[3] J. Dhilipan1*, N.Vijayalakshmi2 , S.Suriya3 , Arockiya Christopher4, “Prediction of Students Performance using Machine learning ,”IOP Conf. Ser.: Mater. Sci. Eng. 1055 012122
[4] Amirah Mohamed Shahiria,Wahidah Husaina,Nur’aini Abdul Rashida,Nur’aini Abdul Rashida. “ A Review on Predicting Student’s Performance using Data Mining Techniques.”
[5] Dr. Anjali B Raut,Ms. Ankita A Nichat. “Students Performance Prediction Using Decision Tree Technique.” International Journal of Computational Intelligence Research,ISSN 0973-1873 Volume 13, Number 7 (2017), pp. 1735-1741.
[6] C. Anuradha1, T. Velmurugan2. “A Comparative Analysis on the Evaluation of Classification Algorithms in the Prediction of Students' Performance.” Indian Journal of Science and Technology, Vol 8(15), IPL057, July 2015.
[7] Muluken Alemu Yehuala. “Application Of Data Mining Techniques For Student Success And Failure Prediction (The CaseOf Debre_Markos University).” International Journal of Science & Technology Research Volume 4, ISSUE 04,April 2015 .
[8] K. F. Li, D. Rusk, and F. Song, “Predicting student academic performance,” Proc. - 2013 7th Int. Conf.
Complex, Intelligent, Softw. Intensive Syst. CISIS 2013, pp. 27–33, 2013.
Websites:
[9] Dataset, available at <<https://archive.ics.uci.edu/ml/datasets/student+performance>>, last accessed on last accessed on 29-05-2021 at 11:00 PM.
©Daffodil International University
©Daffodil International University