PROJECT REPORT ON
Rice Doctor: Paddy disease detection from leaf image using Machine Learning
DAFFODIL INTERNATIONAL UNIVERSITY DHAKA, BANGLADESH
October 2020
Rice Doctor: Paddy disease detection from leaf image using Machine Learning
BY
MARSHIA BINTH-E MOSHAROF: 161-15-683 AND
MD MEHRAB HOSSAIN: 161-15-656
This Report Presented in Partial Fulfillment of the Requirements for the Degree of Bachelor of Science in Computer Science and Engineering
Supervised By
Md. Nazmul Hoq
Lecturer and Association Head
Department of Computer Science & Engineering Daffodil International University
DAFFODIL INTERNATIONAL UNIVERSITY DHAKA, BANGLADESH
October 2020
APPROVAL
This Project titled “Rice Doctor: Paddy disease detection from leaf image using Machine Learning”, submitted by Md. Mehrab Hossain and Marshia Binth-E Mosharof, to the Department of Computer Science and Engineering, Daffodil International University has been accepted as satisfactory for the partial fulfillment of the requirements for the degree of B.Sc. in Computer Science and Engineering and approved as to its style and contents. The presentation has been held on 8th October 2020.
BOARD OF EXAMINERS
Dr. Syed Akhter Hossain Chairman
Professor and Head
Department of Computer Science and Engineering Faculty of Science & Information Technology Daffodil International University
Mr. Narayan Ranjan Chakraborty Internal Examiner Assistant Professor
Department of Computer Science and Engineering Faculty of Science & Information Technology Daffodil International University
Mr. Md. Nazmul Hoq Internal Examiner
Lecturer and Associate Head
Department of Computer Science and Engineering Faculty of Science & Information Technology Daffodil International University
Dr. Mohammad Shorif Uddin External
Examiner
Assistant Professor
Department of Computer Science and Engineering Jahangirnagar University
DECLARATION
We hereby declare that this project has been done by us under the supervision of Md.
Nazmul Hoq, Lecturer and Association Head, Department of Computer Science &
Engineering, Daffodil International University. We also declare that neither this project nor any part of this project has been submitted elsewhere for the award of any degree or diploma.
Supervised by:
Md. Nazmul Hoq
Lecturer and Association Head
Department of Computer Science & Engineering Daffodil International University
Submitted by:
(MD MEHRAB HOSSAIN) ID: -161-15-656
Department of Computer Science & Engineering Daffodil International University
(MARSHIA BINTH-E MOSHAROF) ID: -161-15-683
Department of Computer Science & Engineering Daffodil International University
ACKNOWLEDGEMENT
First, we express our heartiest thanks and gratefulness to almighty God for His divine blessing makes us possible to complete the final year project successfully.
We are grateful and wish our profound indebtedness to Md. Nazmul Hoq, Lecturer and Association Head, Department of Computer Science & Engineering . The deep Knowledge & keen interest of our supervisor in the field of Machine Learning influenced us to carry out this project. Her endless patience, scholarly guidance, continual encouragement, constant and energetic supervision, constructive criticism, valuable advice, reading many inferior drafts, and correcting them at all stages have made it possible to complete this project.
We would like to express our heartiest gratitude to Professor Dr. Syed Akhter Hossain Head, Department of CSE, for his kind help to finish our project and also to other faculty member and the staff of CSE department of Daffodil International University.
We would like to thank our entire course mate at Daffodil International University, who took part in this discussion while completing the coursework.
Finally, we must acknowledge with due respect the constant support and patience of our parents.
ABSTRACT
Rice is one of the main foods in the Indian Subcontinent especially in Bangladesh. In Bangladesh, about 135 million peoples staple food is rice. At present, Bangladesh is producing about 25 million tons’ rice to feed her 135 million people. The amount could be more if millions of rice is not wasted every year by disease. As Bangladesh is a developing country, the illiteracy rate has not decreased significantly yet. Most of the farmers are not familiar with the different kinds of disease in rice. So this is really interesting research to identify the disease by infected leaves in agricultural fields. This research paper is a prototype of detection and classification of Paddy disease by infected leaves using machine learning algorithms. We consider three rice diseases named Blast disease, Plant Hopper Disease and Leaf Folder disease. Here we have used a deep learning model based on CNN for classification. We have also used some other transfer learning model for classification.
The most important part of this research is to pre-process the image carefully. After processing the data, we trained our model and validated over the dataset. Finally we tested various models but the CNN gives the best result for our dataset, CNN gives an accuracy of about 99.89%.
TABLE OF CONTENTS
CONTENTS
PAGE
Title i
Approval ii
Board of examiners ii
Declaration iii
Acknowledgements iv
Abstract v
List of Figures x-xi
List of Tables xii
CHAPTER 1: INTRODUCTION 1-4
1.1 Introduction 1
1.2 Motivation 1-2
1.3 Rationale of the Study 2
1.4 Research Questions 2
1.5 Expected Output 3
1.6 Project Management and Finance 3
1.7 Report Layout 3-4
CHAPTER 2: BACKGROUND 5-9
2.1 Preliminaries 5
2.2 Related Works 5-7
2.3 Comparative Analysis and Summary 7-8
2.4 Scope of the Problem 8
2.5 Challenges 9
CHAPTER 3: RESEARCH METHODOLOGY 10-23
3.1 Research Subject and Instrumentation 10
3.2 Data Collection Procedure 10-11
3.3 Statistical Analysis 11-12
3.3.1 Sample Images 13-17
3.3.1.1 Magnaporthe Grisia (Blast Disease) 13-14 3.3.1.2 Cnaphalocrocis medinalis (Leafroller Disease) 15-16 3.3.1.3 Fulgoromorpha (Plant Hopper Disease) 17
3.4 Applied Mechanism 18
3.4.1 CNN Model Configuration 18
3.4.1.1 CNN Model 19
3.4.1.2 Architecture of Our Model 20
3.4.2 Transfer Learning Model 20
3.4.2.1 Importing VGG16 20
3.4.2.2 Importing VGG19 20
3.4.2.3 Importing ResNet50 21
3.4.2.4 Importing Exception 21
3.5 Implementation Requirements 22
3.5.1 Image Resizing 22
3.5.2 Normalization 22
3.5.3 Splitting of the dataset 23
3.5.4 Featuring Data and Labeling the class 23
CHAPTER 4: EXPERIMENTAL RESULTS AND DISCUSSION 24-43
4.1 Experimental Setup 24
4.1.1 VGG16 24
4.1.1.1 Architecture of VGG16 24-25
4.1.1.2 Model Summary of VGG16 25
4.1.1.3 Model Performance of VGG16 26
4.1.1.4 Visualization of VGG16 26
4.1.1.5 Model Output of VGG16 27
4.1.2 VGG19 28
4.1.2.1 Architecture of VGG19 28
4.1.2.2 Model Summary of VGG19 29
4.1.2.3 Model Performance of VGG19 29
4.1.2.4 Visualization of VGG19 30
4.1.2.5 Model Output of VGG19 31
4.1.3 ResNet50 32
4.1.3.1 Architecture of ResNet50 32
4.1.3.2 Model Summary of ResNet50 33
4.1.3.3 Model Performance of ResNet50 33
4.1.3.4 Visualization of ResNet50 34
4.1.3.5 Model Output of ResNet50 35
4.1.4 CNN 36
4.1.4.1 Architecture of CNN 36
4.1.4.2 Model Summary of CNN 36
4.1.4.3 Model Performance of CNN 37
4.1.4.4 Visualization of CNN 37
4.1.4.5 Model Output of CNN 38
4.1.5 Xception 39
4.1.5.1 Architecture of Xception 39
4.1.5.2 Model Summary of Xception 40
4.1.5.3 Model Performance of Xception 40
4.1.5.4 Visualization of Xception 41
4.1.5.5 Model Output of Xception 42
4.2 Experimental Results and Analysis 43
4.3 Discussion 43
CHAPTER 5: IMPACT ON SOCIETY, ENVIRONMENT AND
SUSTAINABLITY 44-47
5.1 Impact on Society 44
5.2 Impact on Environment 44
5.3 Ethical Aspects 44
5.4 Sustainability Plan 45
5.4.1 Android Layout 45-46
5.4.2 Android Functionalities 47
CHAPTER 6: SUMMARY, CONCLUSION, RECOMMENDATION AND IMPLICATION FOR FUTURE RESEARCH 48-49
6.1 Summary of study 48
6.2 Conclusion 48
6.3 Implementation for Further Study 49
APPENDIX 50-51
Appendix: A 50
Appendix: B 51
REFERENCES 52-53
Plagiarism Report 54-55
LIST OF FIGURES
FIGURES PAGE NO
Figure 3.3.1: Pie chart of total data. 11
Figure 3.3.2: A Bar chart of total data division 12
Figure 3.3.1.1: Sample Images of Magnaporthe grisea (Blast disease) 14 Figure3.3.1.2: Sample image of Cnaphalocrocis medinalis (Leaf Folder
Disease) 16
Figure3.3.1.3: Sample image of Fulgoromopha (Plant Hoppers) 17
Figure 3.4.1.1.1: CNN Model Configuration File 19
Figure 3.4.1.2.1: Architecture of CNN Model 20
Figure 3.4.2.1: Importing VGG16 Model 20
Figure 3.4.2.2: Importing VGG19 Model 20
Figure 3.4.2.3: Importing ResNet50 Model 21
Figure 3.4.2.4: Importing Xception Model 21
Figure 3.5.2: Image Rescaling 22
Figure 3.5.4: Features and labels of CNN 23
Figure 4.1.1.1: Architecture of VGG16 Model 24
Figure 4.1.1.2: Summary of VGG16 model 25
Figure 4.1.1.3: Performance of VGG16 26
Figure 4.1.1.4.1: Accuracy of VGG16 26
Figure 4.1.1.4.2: Loss of VGG16 26
Figure 4.1.1.5: Some output of VGG16 27
Figure 4.1.2.1: Architecture of VGG119 Model 28
Figure 4.1.2.2: Summary of VGG19 model 29
Figure 4.1.2.3: Performance of VGG19 29
Figure 4.1.2.4.1: Accuracy of VGG19 30
Figure 4.1.2.4.2: Loss of VGG19 30
Figure 4.1.2.5: Some output of VGG19 31
Figure 4.1.3.1: Architecture of ResNet50 Model 32
Figure 4.1.3.2: Summary of ResNet50 model 33
Figure 4.1.3.3: Performance of ResNet50 33
Figure 4.1.3.4.1: Accuracy of ResNet50 34
Figure 4.1.3.4.2: Loss of ResNet50 34
Figure 4.1.3.5: Some output of ResNet50 35
Figure 4.1.4.1: Architecture of CNN Model 36
Figure 4.1.4.2: Summary of CNN model 36
Figure 4.1.4.3: Performance of CNN model 37
Figure 4.1.4.4.1: Accuracy of CNN model 37
Figure 4.1.4.4.2: Loss of CNN model 37
Figure 4.1.4.5: Some output of CNN model 38
Figure 4.1.5.1: Architecture of Xception Model 39
Figure 4.1.5.2: Summary of Xception model 40
Figure 4.1.5.3: Performance of Xception model 40
Figure 4.1.5.4.1: Accuracy of Xception model 41
Figure 4.1.5.4.2: Loss of Xception model 41
Figure 4.1.5.5: Some output of Xception model 42
Figure 5.4.1: Screenshot of Android Application Layout 46
Figure (Appendix-A): Anaconda Navigator 50
Figure (Appendix-B): Android Studio 51
LIST OF TABLES
TABLES PAGE NO
TABLE 2.3: LITERATURE REVIEW OF VARIOUS PAPERS ON
CLASSIFICATION TECHNIQUE AND THEIR ACCURACY 8
TABLE 3.2: COLLECTED DATA 11
TABLE 3.3: DIVISION OF DATASET FOR TRAIN, TEST and
VALIDATION 12
TABLE 4.2.1: DETAILES TABLE OF APPLIED MODEL 43
TABLE 4.2.2: COMPARISON TABLE OF APPLIED MODEL 43
CHAPTER 1 INTRODUCTION
1.1 Introduction
Bangladesh is mainly an agricultural country. That means a huge number of people in the country are involved with agriculture. About 75% of our agricultural land is used to produce rice [1]. Because rise is the dominant food for Bangladesh. In 1980, Bangladesh was the fourth largest rice producer country. At present, Bangladesh is the Sixth Largest Rice producer country in the world [2]. However, almost Bangladesh has attained self- sufficiency in producing rice, there are some difficulties for the root level farmers to produce rice. Some of them are heavy Rainfall, drought, aridity, flood, disease etc. Besides these environmental problems, disease is the major problem in rice cultivation. On the other hand, root level farmers are not much educated to cultivate rice or to face the disease scientifically. As we are living in a micro modern era, we decided to solve the problem using machine learning techniques.
1.2 Motivation
Bangladesh is a developing country of the third world. As a developing country, she has to face many problems in step by step of her progress. As still the main occupation of this country is related to cultivation, so the side of development depends on its agriculture. But an irony of fact that we are still depending on the manual cultivation system which is a very slow process of detecting disease if there is any. As this is not possible for humans to identify very critical things or signs, there should be a quick and easy process to identify the problems. Everything is being digitized day by day. But still our agricultural side is lagging behind on it. Lack of proper agricultural knowledge of our root level farmers, we have to face a huge loss every year. Keeping this thing in mind, we thought to do something for our agriculture by using our Computer science knowledge. Then we decided to apply the knowledge in the Rice section. Because every year, without natural disaster, just because of some harmful disease, we have to make a huge loss in our Rice crops. That’s why we built a machine learning model which can predict disease of rice leaves. Purpose
of this research is to detect diseases faster and quickly. In our research, we used three diseases. These are:
Magnaporthe Grisea or Blast Disease
Cnaphalocrocis Medinalis or Leaf Folder Disease
Fulgoromorpha or Plant Hopper Disease
1.3 Rational of the Study
At present smartphones are available in rural areas. Though the basic educational knowledge is not so much, technological knowledge has enough to many of our rural population. That's why we have built an android application to conduct the application process. This mobile application will use a camera to capture leaf images or from gallery, people can also select leaf images which they want to identify. They can also know whether the plant is healthy or not. After the identification of the disease, they can also have the remedy and future resistance of the disease.
Another interesting feature of the project is; farmers can also have any enquiry from nearby Agricultural Directorates at any time via phone call or by chatting. There will be at least two basic languages in our android application that is English and Bangla to make it more user friendly.
1.4 Research Questions
During the research period, we have to face many questions. The first question we have to face about our data collection. This not easy to collect a large dataset on different disease.
Because, all kinds of diseases were not presented on a single place. Then any how we have collected them. Then the second question was what type of neural network should we use.
This was completely a new chapter to us. But by our supervisor’s help we gather knowledge on it. Then there was another problem appear that in which way, we should follow to do it.
Then our supervisor guided us to know Python language first. Then we gather knowledge about Numpy and Scipy, Anaconda and go through 10 or 12 research paper.
1.5 Expected Outcomes
Most of the farmers in our country are living under the poverty line. So our task will be to be free to all. Most of them have a very little knowledge about rice farming. The outcome of our research is to identify the paddy disease by using the paddy leaf and give the step by step solution to them. Our research can also find the leaves whether they are healthy or not. We have created an android application to make a very user friendly interface to identify the problem.
1.6 Project Management and Finance
The whole project was managed by our respected supervisor Md. Nazmul Hoq. He guided us on the whole project till end. On the other hand, we had some cost which is not a big deal. As we’ve collected our Data from Bangladesh Rice Research Institute(BRRI) [1], we visited there after getting their schedule. There was a little cost to visit there. Besides, our working machine (Laptop) was not highly configured to do this heavy task. So, we’ve re placed our hard drive with 120gb SSD which was cost about 2100/= and a new DDR3 RAM of 8GB which was about 1600/=. Around 4000/= Taka was spent during the whole time. All the cost was bear by us.
1.7 Report Layout
In Chapter 1, we tried to give a clear concept about our research of “Detection of disease on Paddy leaves using Machine Learnings”. We also discussed what is the motivation of our research, the objectives of our research and the expected outcome of our research.
In Chapter 2, we will discuss about Background of our research. We will focus on the related works, the brief overview on summary, the terminologies of our research, the scope of the problems and the challenges of doing this research.
In Chapter 3, we will discuss the methodology of our research. That means what type of instruments we have used, how we have collected our data and utilized them, some statistical analysis of our collected data, what type of algorithm we have used and what are the requirements to implement our proposed model will be discussed briefly here.
In Chapter 4, we will discuss the details of the experimental result of our research. We will also analysis our output result.
In Chapter 5, main discussion topics will be the impact of our work on our society and environment. If there are any ethical aspects of our research, that will be discussed here.
In Chapter 6, we will conclude our evolutional result and add some extra features that can be included in future works.
At the end of this report, some references that we have got from various previous papers and internet will be attached.
CHAPTER 2 BACKGROUND
2.1 Preliminaries
In our research, we mainly used Convolutional Neural Network(CNN). Here we used python as a programming language. We used Tensor flow 2.0 to train our model. We have collected the dataset from Bangladesh Rice Research Institute (BRRI). A senior scientific officer named Dr. Samiul Haque Sir helped us a lot. He gave us permission to capture images from their research laboratory. From there, we collected about 12,000 real images.
For preprocessing purposes like labeling, noise reducing, resizing, giving some effects, we used some open source tools. In our research, we used a supervised learning algorithm where names of the diseases are used to label the class.
2.2 Related Works
As far as we got information from BRRI, the first similar project was done by a BUET student in 2017 but he had some performance issues for which the application was not published. Another research on paddy disease detection was done by a daffodil student Numerous inquiries about our work have been drained for a long time which are related to my investigation. Few of them are given below: -
In paper [1] Paddy Leaf Disease Detection System Using Image Processing and Machine Learning are done by Dr. Neha Mangla, Pryanka B Raj, Soumya G Hegde, Pooja R. With the assistance of exactness and review, the framework was assessed and found that the framework was 94.16% precise in classifying the 3 rice infections. Neha et al. (2019) have displayed a ponder on discovery of paddy leaf disease detection with picture handling and machine learning. The study of this research are on Rice impact, Sheath scourge, and brown spot.
In paper [19] Harshadkumar B. Prajapati, Jitesh P. crowned head and Vipul K. Dabhi [20]
projected an epitome system for detection and classification of rice diseases supported the pictures of infected rice plants. This epitome system is developed once elaborated
experimental analysis of assorted techniques utilized in image process operations. They utilized SVM to classify the disease and they got 93.33% training accuracy and 73.33%
testing accuracy. They moreover performed k-fold cross approval fork=5 and k=10. They also created easy-to-use GUI for understanding all intermediate steps performed from picture input to disease classification.
In paper [3] A Survey on Rice Plant Disease Identification Using Image Processing and Data Mining Techniques by Tanmoy Bera, Ankur Das, Jaya Sil and Asit K. Das.
Recognizable proof of the diseases is the key to anticipate qualitative and quantitative misfortune of agricultural yields. They utilized two classifiers, k-NN and MDC, and the exactness’s accomplished with these classifiers are 87.02 and 89.23%, respectively.
Automated infection classification of leaf brown spot and leaf blast was proposed in [17]
by Phadikar et al. The exactness’s of Bayes’ and SVM classifiers had been measured on 1000 infected rice leaf images. They proposed a strategy utilizing C4.5 choice tree calculation to find classification rules for Egyptian rice diseases. They had considered it as seven agronomic traits for test reason. Entropy and data pick up were utilized as trait determination measures. The execution of the neural network and C4.5 decision tree algorithm was observed as 96.4 and 97.25%, individually.
In paper [4] Automated Blast Disease Detection from Paddy Plant Leaf - A Color Slicing Approach prepared by Amandeep Singh, Maninder Lal Singh. In this paper a novel approach for the discovery of blast disease of paddy crop has been proposed. After comparison with the comes from [15] and [16], it has been concluded that the proposed calculation has appeared in progress accuracy of 96.6%. At a look comes about displays that:
Color Slicing could be a promising strategy for the detection of a chosen range of colors.
Although there's a little disparity within the discovery but a precision of 96.6% is best in its class.
A novel approach for edge location appearing superior comes about than conventional edge discovery technologies.
Checking approximately future perspectives, after authentication of the result in assorted environment circumstances, these algorithms can be executed in genuine time live ventures alongside the histogram based approaches as examined in and for color discovery utilizing
hereditary algorithms or neuro-fuzzy optimization procedures their capacities can further be upgraded.
In paper [5] Monitoring and Controlling Rice Diseases Using Image Processing Techniques researched by Amrita A. Joshi and B.D. Jadhav. A framework for observing rice bacterial scourge, rice impact, rice sheath spoil and brown spot diseases has been created in this study. Picture preparing methods like segmentation, feature extraction, and two classifiers were utilized to set up the classification algorithm. In the highlight extraction, color and zone wise shape features have been extricated and utilized as an input to the classifier. For each infection, an isolated database has been utilized for training and testing. Proposed strategies have been tried for four mentioned rice diseases utilizing two classifiers, k-NN and MDC and the precision accomplished with two classifiers is 87.02%
,89.23% individually. The proposed method is compared with the few existing strategies which are related to the rice diseases discovery and found that the proposed strategy is predominant in terms of time complexity, precision, number of diseases secured.
2.3 Comparative Analysis and Summary
From the very beginning, many machine learning technique has been applied on different dataset to detect disease on paddy leaves.
In paper [2], SVM model was applied on a dataset of 1500 samples of 4 class. In this case, the accuracy was 79%.
In paper [3], here a total of 1000 image was used from 11 different classes. Though there was a little dataset, the accuracy was 87%.
In paper [4], here a very little data set was used of 120 from 3 classes. The algorithm was K-NN and the accuracy was 93%.
In paper [5], 4 different class Tungo, Blast, Brown spot and Bacterial leaf was used. The accuracy was 83%.
In paper [6], a portable planet application was added to identify the diseases. In that case, the exactant of paddy sickness is proof to be 91%.
In Our project we have got about 98% accuracy which was quite good.
Here a table of applied algorithm and accuracy is given from different papers:
TABLE 2.3: LITERATURE REVIEW OF VARIOUS PAPERS ON CLASSIFICATION TECHNIQUE AND THEIR ACCURACY
Papers Classification
techniques
Parameters of
classification Accuracy Recognition of diseases in paddy
leaves using knn classifier [7]
(k-NN) classifier
major axis, minor axis,
and perimeter 76.59%
A Survey on Rice Plant Disease Identification Using Image Processing and Data Mining Techniques [8]
Decision tree algorithm
Relative magnitude between color elements
and deviation
97.83%
Automatic lesion segmentation from rice leaf blast field images based on random forest [9]
Random forest classifier
Color, shape and
texture features 97%
Early Detection and Classification of Paddy Diseases with Neural Networks and Fuzzy Logic[10]
Backpropagation neural network
Three layers: input layers, hidden layers,
and output layers
70–80%
Vegetation indices based segmentation for automatic classification of brown spot and blast diseases of rice [11]
Vegetation index-based
method
Texture values calculated from VI
index
84%
“Monitoring and controlling rice diseases using Image processing techniques [12]
MDC and k-NN classifier
Color and zone-wise shape features
89.23%
87.02%
Rice diseases classification using feature selection and rule
generation techniques [13]
Rule generation IF-THEN
classifier
1. (feature, value) pair 2. minimal feature
subset
More than 90%
Our Work CNN
Color, shape and texture features of each
image
98.33%
2.4 Scope of the Problem
The working procedure will be helpful for our farmers as they can identify the disease of paddy leaves. But there are some steps that have to be followed. Such as taking pictures as input, saving it, doing some task and following some steps to match the image with our dataset. This all procedures are technical but the farmers in our country don’t have so much technical knowledge. As this whole research procedure will be available in android mobile application platform. So, if they have some knowledge about android application they can easily do the task and identify the exact disease.
2.5 Challenges
In this task we collected images from Bangladesh Rice Research Institute (BRRI). We collected almost 10,000 infected images from their Green House. In this research we basically work for three types of diseases. Blast disease, Rice Leaf folder disease, Leaf fly disease. Farmers are trying to cope up with this problem of paddy leaf diseases. Huge amounts of crops are wasted in our country because of these issues. So, we are trying to resolve this problem by identifying accurately the exact disease according to technical methods.
To complete the task, our main challenging platform was collecting the dataset. Without managing a huge amount of data it was quite impossible to complete the task. As all our data is raw data and we didn’t collect a single image from the internet. Another challenging moment was to get an appointment with Dr. Samiul Haque Sir at (BRRI). He is the senior scientific officer of Bangladesh Rice Research Institute (BRRI). Without his permission we didn’t capture pictures from (BRRI) green house. Then our PC was not highly configured. We have to face many problems for training the images. If we had a high configuration PC, then completing the task would be more suitable for us.
CHAPTER 03
RESEARCH METHODOLOGY
3.1 Research Subject and Instrumentation
Here we use a deep Convolutional Neural Network to fit our dataset that we have collected by our self. This is the main model of our research. We have also used some other models to compare the output accuracy with our existing model. The complete architecture and the features of these models will be described in the following section. As we have already maintained that the main focus of our research is to classify 3 different diseases of paddy leaves containing 10,000 images. In our main CNN model, we used 6300 images to train the model. Then 2700image in validation purposes. Then 100 images are used for testing.
In our transfer learning models (VGG16, VGG19 and ResNet50) we have used 9000 images for training purposes and 900 images for validation purposes. Rest of the 100 images were used to test.
3.2 Data Collection Procedure
From the very beginning of the research, the main challenge for us was collecting the data.
We have collected the image by yourself. We get the raw data from Bangladesh Rice Research Institute(BRRI). We visited there with the reference of our supervisor and after getting the permission, we captured the image from their laboratory. They archived the paddy plant for their research purpose. We captured the image by an android device named Samsung A50 with different effects, ISO, Focal length, Exposure, aperture and different frame size.
Table 3.2 Describe my dataset details:
TABLE 3.2: COLLECTED DATA
Class Name (English)
Class Name ( In Scientific method)
Class label Total Image
Blast Magnaporthe grisea 0 3300
Leaf folder Cnaphalocrocis medinalis 1 3300
Plant Hoppers
Fulgoromorpha 2 3400
3.3 Statistical Analysis:
Figure 3.3.1: Pie chart of total data.
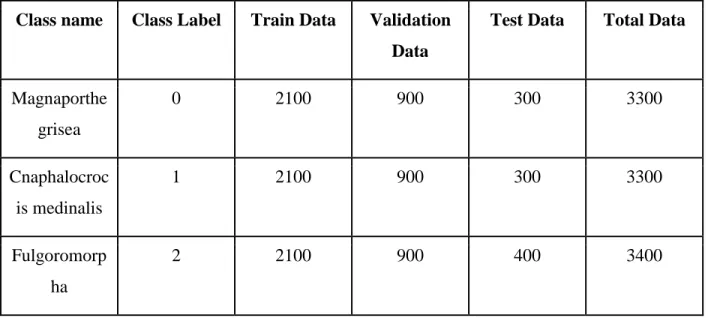
Table 3.3 describes the Dataset Division of our research.
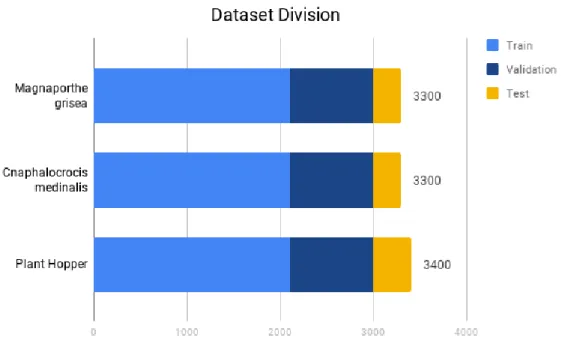
TABLE 3.3: DIVISION OF DATASET FOR TRAIN, TEST and VALIDATION
Class name Class Label Train Data Validation Data
Test Data Total Data
Magnaporthe grisea
0 2100 900 300 3300
Cnaphalocroc is medinalis
1 2100 900 300 3300
Fulgoromorp ha
2 2100 900 400 3400
A bar chart of data division is given below:
Figure 3.3.2: A Bar chart of total data division
3.3.1 Sample Image:
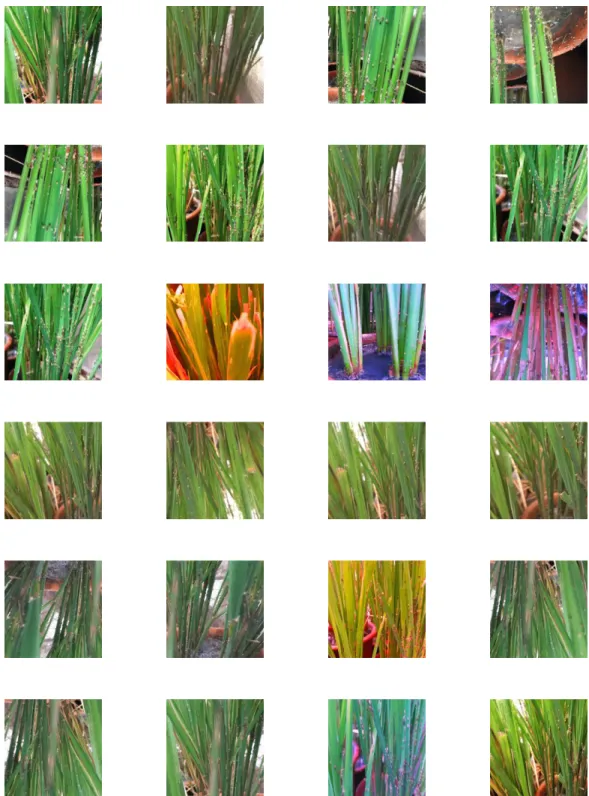
3.3.1.1 Magnaporthe Grisia (Blast Disease):
Magnaporthe grisea, also known as rice blast fungus, rice rotten neck, rice seedling blight, blast of rice, oval leaf spot of graminea, pitting disease, ryegrass blast, and Johnson spot, is a plant-pathogenic fungus that causes a serious disease affecting rice. It is now known that M. grisea consists of a cryptic species complex containing at least two biological species that have clear genetic differences and do not interbreed.[8] Complex members isolated from Digitaria have been more narrowly defined as M. grisea. The remaining members of the complex isolated from rice and a variety of other hosts have been renamed Magnaporthe oryzae. Confusion on which of these two names to use for the rice blast pathogen remains, as both are now used by different authors. Members of the Magnaporthe grisea complex can also infect other agriculturally important cereals including wheat, rye, barley, and pearl millet causing diseases called blast disease or blight disease. Rice blast causes economically significant crop losses annually. Each year it is estimated to destroy enough rice to feed more than 60 million people. The fungus is known to occur in 85 countries worldwide. Initial symptoms are white to gray-green lesions or spots with darker borders produced on all parts of the shoot, while older lesions are elliptical or spindle-shaped and whitish to gray with necrotic borders. Lesions may enlarge and coalesce to kill the entire leaf. Symptoms are observed on all above-ground parts of the plant. Nodal infection causes the culm to break at the infected node (rotten neck). It also affects reproduction by causing the host to produce fewer seeds. This is caused by the disease preventing maturation of the actual grain.
Some Sample image of this disease is given below:
Figure 3.3.1.1: Sample Images of Magnaporthe grisea (Blast disease)
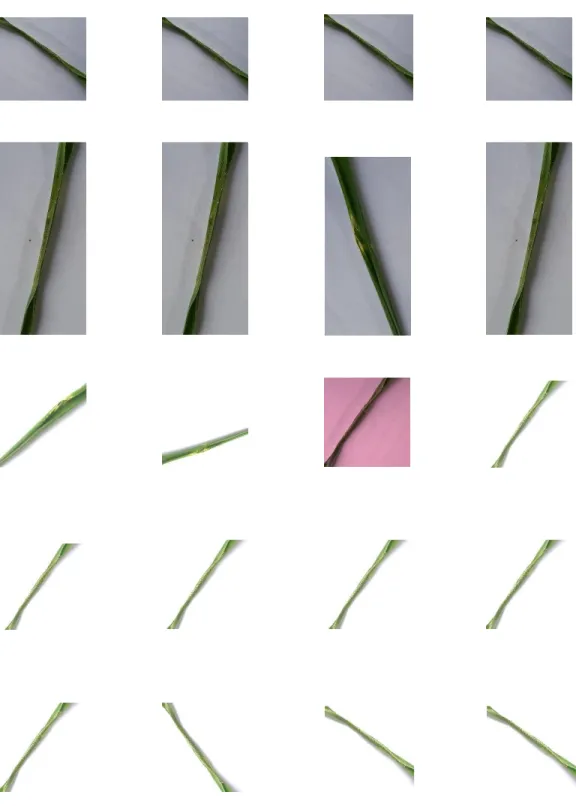
3.3.1.2 Cnaphalocrocis medinalis (Rice Leafroller Disease):
Cnaphalocrocis medinalis, the rice leafroller, is a species of moth of the family Crambidae.
It is found in south-east Asia, including Hong Kong, Sri Lanka, Taiwan, Thailand and most of Australia. The wingspan is about 16 mm. The larvae are considered a pest on Zea mays, Oryza sativa and Triticum, Saccharum and Sorghum species. The moth is very active, bright yellow or straw in colour with two distinct wavy lines in the fore wing and one wavy distinct line in the hind wing. It has a wing span of 15mm. Eggs are laid singly or in groups arranged in longitudinal rows on the undersurface of the leaves which are scaly white in color. Fecundity is about 56 eggs. Incubation period is 4–8 days. We find 5–6 larval instars; larval period is about 22–23 days. It pupates with in the infested leaf fold for a period of 6–7 days. The fully grown caterpillar is green in color and is 16.5mm long. The total life cycle completed in about 5 weeks. All the stages of the crop are attacked by this pest. On hatching the newly hatched caterpillar cut the leaf edges and folds the leaf. When young seedlings are attacked it folds 3–4 adjacent plant leaves and scrapes the green matter so that the infested leaves appear white. A single caterpillar damages several leaves. The attacked plants dry up and it reduces the vigour of the plant. Ultimately the yield gets reduced. The yield loss may vary up to 10–50 per cent. It is more problematic at boot leaf stage.
Some Sample image are given below:
Figure 3.3.1.2: Sample image of Cnaphalocrocis medinalis (Leaf Folder Disease)
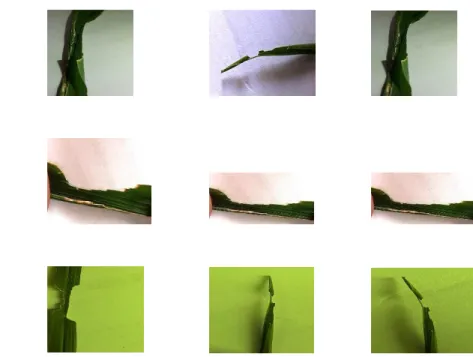
3.3.1.3 Fulgoromorpha (Plant Hopper Disease):
A plant hopper is any insect in the infraorder Fulgoromorpha, in the suborder Auchenorrhyncha and exceeding 12,500 described species worldwide. The name comes from their remarkable resemblance to leaves and other plants of their environment and from the fact that they often “HOP” for quick transportation in a similar way to that of grasshoppers. However, plant hoppers generally walk very slowly so as not to attract attention. Distributed worldwide, all members of this group are plant-feeders, though surprisingly few are considered pests. The infraorder contains only a single superfamily, Fulgorodia. Fulgoroidas are most reliably distinguished from the other Acuhenorrhyncha by two features; the bifurcate anal vein in the forewing and the thickened.
Some sample image is given below:
Figure 3.3.1.3: Sample image of Fulgoromopha (Plant Hoppers)
3.4 Applied Mechanism
We applied some models in this research. Our main model that we have worked with is Convolutional Neural Network. The other models are applied to compare the accuracy of output. The applied models are:
CNN
VGG16
VGG19
Resnet50
Xception
3.4.1 CNN Model Configuration:
In this part, we will discuss about the model that we have implemented. We have 2 convolution layers, 2 maximum pooling layers of 2*2 size. Two hidden layers and 3 dense layers as we have total 3 class. Finally, we have an activation layers and here we have used “Soft ax” function as an activation function. We used Softmax because, we may have many kinds of different input value like positive, negative or zero. But we need value between 0 to 1. This function turns a F real value of vector into a K vector of real value that sum to 1.
The formula of Softmax Function is:
𝜎(𝐹⃗) = 𝑒
𝐹𝑖∑
𝐾𝑗=1𝑒
𝐹𝑗Here, the input vector is denoted by F. e is the standard exponential function and number of class is denoted by K.
On the other hand, in our hidden layers, we used “ReLU” which means Rectified linear activation function. This function will return the input as an output directly if the input is positive. Otherwise, it will output 0 if the input is negative.
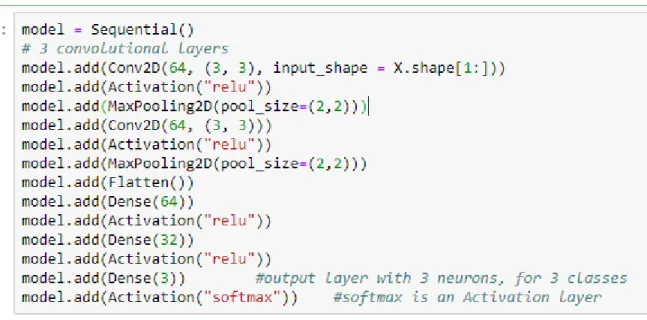
3.4.1.1 CNN Model:
The model that we have created is:
Figure 3.4.1.1.1: CNN model Configuration File
Here we have two convolutional layers first. Then we have an Activation function “ReLu”.
An input tensor is returned by this Activation function “ReLu”. ReLu applies the rectified linear unit activation function. Then we have a maximum poling of size 2 by 2.
Then we have two convolutional neural layers and again “ReLU” as an activation function.
Then again we have a maximum pooling layers of size 2 by 2.
Then we have 3 fully connected layers as our classes are three. On the last fully connected layers, we have an activation function of Softmax. The Softmax function converts a real vector to a vector of categorical probabilities. Softmax is often used as the activation for the last layers of a classification network because the result could be interpreted as a probability distribution.
3.4.1.2 Architecture of Our Model:
Figure 3.4.1.2.1: Architecture of CNN Model
3.4.2 Transfer Learning Models:
There are many transfer learning models. As we have used four transfer learning models (VGG16, VGG19, Resnet50, Xception), we will have a brief discussion on them in the next part.
3.4.2.1 Importing VGG16:
Figure 3.4.2.1: Importing VGG16 Model
3.4.2.2 Importing VGG19:
Figure 3.4.2.2: Importing VGG19 Model
3.4.2.3 Importing Resnet50:
Figure 3.4.2.3: Importing ResNet50 Model
3.4.2.4 Importing Xception:
Figure 3.4.2.4: Importing Xception Model
3.5 Implementation Requirements
Data preprocessing is an important part of this research. Also after data collection, this is the very first step in machine learning algorithms. The preprocessed technique that we have used for our research is described in the following sections.
3.5.1 Image Resizing
We have captured the data on different pixel sizes. All the image that the machine recognizes is by its matrix value. So this is not a good practice to use different sizes of image in machine learning algorithms.
We resize the image 3.5.2 Normalization
Data normalization is also an important task before training the data set. Normalization process ensures that every parameter (in that case Pixel) gets the similar data division.
Normalization is compiled by subtracting the mean value of each pixel and then dividing it by the standard deviation. We need the pixel input to be positive for image input. So we must choose the scale in the range of 0 to 1. A colored image has three channels that is RGB (R=Red, Green, B=Blue). Still it has a range of 0-255. In our case, after creating the Pickle file that contains the image pixel, we divided it by 255 to normalize the data.
Figure 3.5.2: Image rescaling
3.5.3 Splitting of the dataset
Datasets are used to train the machine so that machine can recognize it. Model sees the dataset and learns from it. Then we have to check how good the machine has learned from the dataset. Then we have to validate what machine has learned from the model. So we need to validate the learnings of the model. Then we have to test what the machine has learnt. That's why we have to split the data set into three. Training set, Validation Set and the Testing set.
3.5.4 Featuring Data and labeling the class:
In our main CNN model that we have created by ourselves, we need to make an array of the image features. Then we need to label the features with their class. We did it so by using the simple line of code below:
Figure 3.5.4: Features and labels of CNN model.
CHAPTER 4
EXPERIMENTAL RESULTS AND DISCUSSION
4.1 Experimental Setup:
To compare our model, we have to build some other models also. Actually, this sector is not new in computer field. Already we have discussed that some previous work has also done on it. There are some pre trained model that should need to implement in our research.
4.1.1 VGG16:
Vgg16 stands for Vertex Geometric Group which has 16 Layers. The first 13 layers are Convolutional layers and the last 3 are fully connected layers. This a very well-known pre trains model used for transfer learning. It was proposed by Karen Simonyan and Andrew Zisserman in 2014 on a competition of ImageNet. It stood for the first and second position that year. The original model took 2-3 weeks to compile on a very high configured machine.
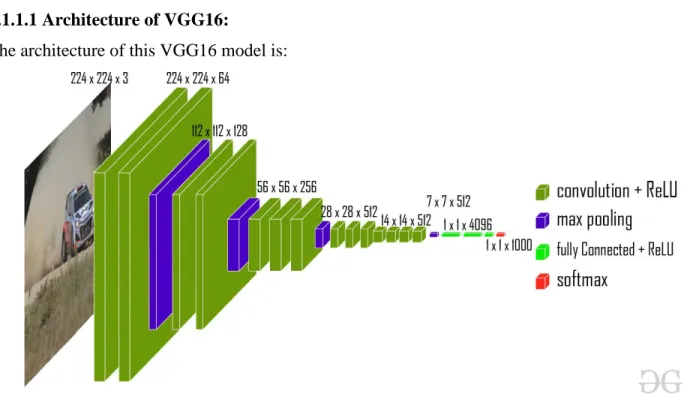
4.1.1.1 Architecture of VGG16:
The architecture of this VGG16 model is:
Figure 4.1.1.1: Architecture of VGG16 Model:
Here the model has 13 convolutional models with Activation function ReLu and 3 Fully connected layers. Total 16 layers.
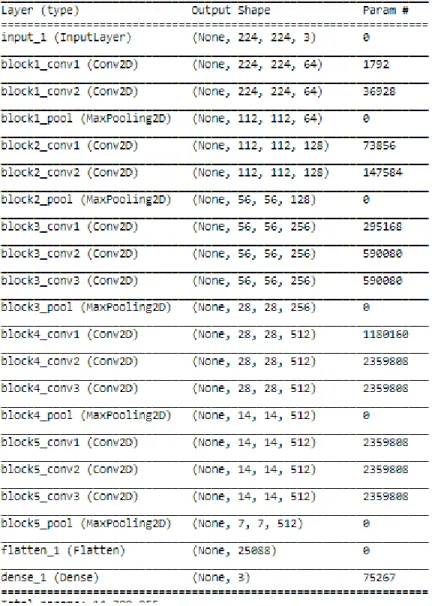
4.1.1.2 Model Summary of VGG16:
Figure 4.1.1.2: Summary of VGG16 model
4.1.1.3 Performance of VGG16
Figure 4.1.1.3: Performance of VGG16
4.1.1.4 Visualization Graph of Accuracy and Loss:
Figure 4.1.1.4.1: Accuracy of VGG16
Figure 4.1.1.4.2: Loss of VGG16
4.1.1.5 Output of VGG16:
Some Output by this model is given below:
Figure 4.1.1.5: Output of VGG16
4.1.2 VGG19:
This is also from VGG neural network. The architecture was proposed by “Simonyan” and
“Zisserman” in the paper of “Very Deep Convolutional Networks for Large Scale Image Reorganization” in 2014. But the main difference of VGG 16 vs VGG19 is that VGG16 has 16 layers while VGG19 has 19 convolutional layers. And They are different in size.
4.1.2.1 Architecture of VGG19:
Figure 4.1.2.1: Architecture of VGG119 Model
The model has total has a total of 19 convolutional layers.
4.1.2.2 Model Summary of VGG19:
Figure 4.1.2.2: Summary of VGG19 model
4.1.2.3 Model Performance of VGG19:
Figure 4.1.2.3: Performance of VGG19
4.1.2.4 Visualization Graph of Accuracy and Loss of VGG19:
Figure 4.1.2.4.1: Accuracy of VGG19
Figure 4.1.2.4.2: Accuracy of VGG19
4.1.2.5 Model Output of VGG19:
Some Output by this model is given below:
Figure 4.1.2.5: Output of VGG19
4.1.3 ResNet50:
This is a convolutional neural network which have 50 layers deep. It is widely used to solve classification problems.
Here, ResNet50 has a convolutional layers of 7*7 and 64 different kernels. It Strides 2 in I layers. Max Pooling also has 2 strides. The next is 1*1, 64 kernel and 3*3, 64 kernels.
These are using 3 times that means total 9 layers.
Next there is 1*1,128 kernels 2 times and 1*1, 512 kernels repeated 4 times so there are total 12 layers.
Then 1*1, 256 l=kernel, 3*3, 256 kernel and 1*1,1024 kernels all are repeated 6 times means 18 layers. At the end, 1*1,512 kernel with 2 3*3, 512 and 1*1,2048 repeated 3 times means 9 layers.
There total 50 layers.
4.1.3.1 Architecture of ResNet50:
Figure 4.1.3.1: Architecture of ResNet50 Model
4.1.3.2 Model Summary of ResNet50:
Figure 4.1.3.2: Summary of ResNet50 model
4.1.3.3 Model Performance of ResNet50:
Figure 4.1.3.3: Performance of ResNet50
4.1.3.4 Visualization Graph of Accuracy and Loss of ResNet50:
Figure 4.1.3.4.1: Accuracy of ResNet50
Figure 4.1.3.4.2: Loss of ResNet50
4.1.3.5 Model Output of ResNet50:
Some Output by this model is given below:
Figure 4.1.3.5: Output of ResNet50
4.1.4 CNN:
CNN is a convolutional linear network. In our research, we created our CNN model by our self with two convolutional network, two max pooling and 3 fully connected layers.
As our datasets are from 3 classes.
4.1.4.1 Architecture of CNN:
Figure 4.1.4.1: Architecture of CNN Model
4.1.4.2Model Summary of CNN:
Figure 4. 1.4.2: Summary of CNN model
4.1.4.3 Model Performance of CNN:
Figure 4. 1.4.3: Performance of CNN model
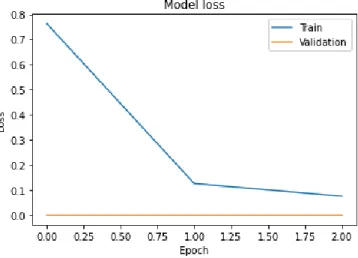
4.1.4.4 Visualization Graph of Accuracy and Loss of CNN:
Figure 4. 1.4.4.1: Accuracy of CNN model
Figure 4. 1.4.4.2: Accuracy of CNN model
4.1.4.5 Model Output of CNN:
Some Output by this model is given below:
Figure 4. 1.4.5: Some output of CNN model
4.1.5 Xception:
Actually this is the extended version of inception version 3. This model uses a depth wise separable convolution layers while which is modified from inception v-3.
4.1.5.1 Architecture of Xception
Figure 4.1.5.1: Architecture of Xception Model
4.1.5.2 Summary of Xception:
Figure 4.1.5.2: Summary of Xception Model
4.1.5.3 Performance of Xception:
Figure 4.1.5.3: Performance of Xception Model
4.1.5.4 Visualization of Xception:
Figure 4.1.5.4.1: Accuracy of Xception model
Figure 4.1.5.4.2: Loss of Xception model
4.1.5.5 Output of Xception:
Figure 4.1.5.5: Output of Xception model
4.2 Experimental Results & Analysis
Table 4.2.1 describes the number of features and train features, size of our model and time to training the model.
TABLE 4.2.1 DETAILES TABEL of APPLIED MODELS
Model name Total Features Trainable Features
Size (MB)
Train Time (Hours)
CNN 4,789,187 4,789,187 54 2-3
VGG16 14,789,955 75,267 58 3
VGG19 20,099,651 75,267 79 4
Resnet50 23,888,771 301,059 96 5.30
Xception 22,962,731 2,101,251 106 7
Table 4.2.2 compares the accuracy and loss of our different models.
TABLE 4.2.2 COMPARISON TABEL of APPLIED MODELS
Model Name Accuracy Loss Validation Accuracy
Validation Loss
CNN 99% 0.0002 99.89% 0.0120
VGG16 99.53% 0.0753 99.40% 1.192e-07
VGG19 99.89% 0.0090 99.86% 1.22e-07
Resnet50 99.88% 0.1075 98.46% 0.2149
Xception 99.86% 0.0054 33.33% 10.75
4.3 Discussion:
Here we can see, in VGG19, we have got an accuracy of 99.40% while we have got the accuracy of 99.86% and 98.46% in VGG19 and Resnet50. In Xecption, the accuracy is very poor because we have to use a large dataset to train the model. Also we need a large validation set to validate over the trained model. But our own build model gives an accuracy of 99.89%. Here the accuracy could vary if we use different epoch. Epoch is the number of training.
CHAPTER 5
IMPACT on SOCIETY, ENVIRONMENT and SUSTAINABILITY
5.1 Impact on Society:
A survey was conducted during 1979–81 in Bangladesh revealed 20 rice diseases, including 2 viral, 2 bacterial, 13 fungal, 2 nematodes and 1 micronutrient deficiency problem. Of these diseases. 16 appeared as major during the period under report [16].
Every year a huge amount of crops is wasted in Bangladesh because of this infectious disease. Governments are trying her best to cope up with this situation. But as a highly density country, the rate of population growth is very high here. So we need more sustainability to feed the nation. This research will definitely help the cultivator to toke immediate decisions by detecting the disease. Also a proper guideline as an export will be provided by the application by which the farmer can take initiatives to reduce the risk.
5.2 Impact on Environment:
On our environment, there are no major negative impacts. Because our main moto was to help the society, to help the farmer. So a positive impact will reflect on the environment that the rate of lost in rice cultivation will definitely decreased.
5.3 Ethical Aspects:
After completing the final android application, we are going to make it free for our farmers.
We believe, they are another backbone of our country. This application will always be free for them. Another thing is, our thinking is to make some service totally free of cost. For example: Farmers can talk to the nearest Cultural office at any time by free of cost. They can get experts solution and field visit by using the application. This service will be free for the application user. No add will be shown during the app use. In one word, the user will not get any hassle to use the application.
5.4 Sustainability Plan:
We just worked on only 3 diseases in this research. Though these are the major disease for the environment of our country, there are some more diseases which make a huge prejudice in rice cultivation. We have implemented a user friendly android interface. But we gave our best on the research side. So we don’t had time to connect the application with the server. An API key is needed to build to connect the app. Our future plane is to make a local host on our own machine and connect the application with the server. Our future plan is to work on them and make the application more user friendly.
5.4.1 Android Layout:
Figure 5.4.1: Screenshot of Android Application Layout
5.4.2 Android Functionalities:
From our android application, people will get the following features:
They can capture image by using phone camera.
They can upload image from phone gallery.
They can talk and talk necessary knowledge from nearest Agriculture office.
They can have two languages. Bangla and English. English will be in the next update of the application.
Some other extra features are they can see the solution from and take necessary steps.
CHAPTER 6
SUMMARY, CONCLUSION, RECOMMENDATION AND IMPLICATION FOR FUTURE RESEARCH
6.1 Summary of the Study
In this research paper, we have applied a machine learning algorithm to detect the infected leaf of paddy. The whole process during the research is: -
I. First Stage
Data collection
Pre processing II. Second Stage
Split the data
Apply Deep neural networks.
III. Third stage
Compare on different model
Find the best Model IV. Last and Final Stage
Implementation of an android application/Interface
6.2 Conclusions
In this research we have applied CNN on infected paddy leaves to make an automatic disease detection. We applied on several models using transfer learning. This is just a prototype. We gathered data as much as we could but this was not enough. Our supervisor helped us to understand the machine learning concepts and guide as on every step what to do. We are hopeful to work with this research further in the future with a huge amount of data as there is very little similar work has been done on this type of project in Bangladesh.
We are thinking about publishing this application on google play store and making it free for our farmers.
6.3 Implementation for Further Study
For the future work of this research, we are thinking to publish a paper by the help of our supervisor. This is not the end of this research. We will soon connect the models with the android application by creating API. As our main focus was to machine learning algorithm, we could not pay time on other sectors like android, server creating or API building. Our next target on this research is to build an api and create a server. So that we can connect the application with this model.
APPENDIX
Appendix A:
We have used anaconda navigator for this research and Jupyter notebook as a code editor which is included with anaconda navigator. We used Python as a programming language.
We created an environment as per it was needed.
Figure (Appendix-A): Anaconda Navigator
During this research, our machine configuration was:
processor - Intel core i5 2.60GHz Ram - 8gb DDR3 Bus Speed-1600MHz SSD - 120GB
For android application implementation we have used android studio as a code editor.
Figure (Appendix-B): Android Studio
References:
[1] Learn about the present scenery of rice cultivation in Bangladesh available at
<< http://www.knowledgebank-brri.org/riceinban.php>>, last access on 28-09-2020 at 7:00pm
[2] Learn about the present scenery of rice cultivation in Bangladesh available at
<< http://www.knowledgebank-brri.org/riceinban.php>>, last access on 28-09-2020 at 7:00pm
[3] Bera T., Das A., Sil J., Das A.K. (2019) A Survey on Rice Plant Disease Identification Using Image Processing and Data Mining Techniques. In: Abraham A., Dutta P., Mandal J., Bhattacharya A., Dutta S. (eds) Emerging Technologies in Data Mining and Information Security. Advances in Intelligent Systems and Computing, vol 814. Springer, Singapore. https://doi.org/10.1007/978-981-13-1501-5_31 [4] S. Palanivel, M. Balasubramanian, K. Jagan Mohan “Detection and Recognition of Diseases from Paddy Plant Leaf Images”- International Journal of Computer Applications (0975 – 8887)
Volume 144 – No.12, June 2016.
[5] Auzi Asfarian, Yeni Herdiyeni, Aunu Rauf, Kikin Hamzah Mutaqin, “Paddy Diseases Identification with Texture Analysis Using Fractal Descriptors Based On Fourier Spectrum”, International Conference On Computer, Control, Informatics and Its Applications,2013.
[6] Kholis Majid, Yeni Herdiyeni, Annu Rauf, “I-Pedia: Mobile Application for Paddy Disease Identification Using Fuzzy Entropy and Probabilistic Neural Network”, ICACSIS, 2013.
[7] M Suresha ; K N Shreekanth ; B V Thirumalesh “Recognition of diseases in paddy leaves using knn classifier”- 2017 2nd International Conference for Convergence in Technology (I2CT)
[8] “A Survey on Rice Plant Disease Identification Using Image Processing and Data Mining Techniques’ - Tanmoy Bera( Advances in Intelligent Systems and Computing book series (AISC, volume 814))
[9] “Automatic lesion segmentation from rice leaf blast field images based on random forest”- Xiaochun Mai ; Max Q.-H. Meng(2016 IEEE International Conference on Real-time Computing and Robotics (RCAR))
[10] “Early Detection and Classification of Paddy Diseases with Neural Networks and Fuzzy Logic”- Mohd Adzhar Abdul Kahar, Sofianita Mutalib, Shuzlina Abdul-Rahman(Proceedings of the 17th International Conference on Mathematical and Computational Methods in Science and Engineering (MACMESE '15))
[11] “Vegetation indices based segmentation for automatic classification of brown spot and blast diseases of rice”-Santanu Phadikar ; Jyotirmoy Goswami(2016 3rd International Conference on Recent Advances in Information Technology (RAIT))
[12] “Monitoring and controlling rice diseases using Image processing techniques”- Amrita A. Joshi ; B.D.
Jadhav(2016 International Conference on Computing, Analytics and Security Trends (CAST))
[13] “Rice diseases classification using feature selection and rule generation techniques”- Author links open overlay panelSantanuPhadikar(https://www.sciencedirect.com/science/article/abs/pii/S016816991200258X) [14] Learn about the present scenery of rice cultivation in Bangladesh available at
<< https://en.wikipedia.org/wiki/Rice_production_in_Bangladesh>>, last access on 28-09-2020 at 9:30pm [15] Learn about the present scenery of rice cultivation in Bangladesh available at
<< https://en.wikipedia.org/wiki/Rice_production_in_Bangladesh>>, last access on 28-09-2020 at 9:30pm
[16] S. A. Miah,A. K. M. Shahjahan,M. A. Hossain &N. R. Sharma 2008. A survey of rice diseases in Bangladesh, Pages 208-213, Volume 31, 1985 - Issue 3