BY
Mahmudul Hassan ID: 152-15-5809
Mahmudul Alam ID: 152-15-5563
Sabbir Ahmed ID: 152-15-5564
Reshmi Akter Rima ID: 152-15-5528
This Report Presented in Partial Fulfillment of the Requirements for the Degree of Bachelor of Science in Computer Science and Engineering.
Supervised By
Prof. Dr. Syed Akhter Hossain Head
Department of CSE
Daffodil International University
DAFFODIL INTERNATIONAL UNIVERSITY DHAKA, BANGLADESH
May 2019
First, we express our heartiest thanks and gratefulness to almighty God for His divine blessing makes us possible to complete the final year thesis successfully.
We really grateful and wish our profound our indebtedness to Prof. Dr. Syed Akhter Hossain, Head of the department of CSE, Daffodil International University, Dhaka. Deep Knowledge & keen interest of our supervisor in the field of “Data Mining and Machine learning” to carry out this thesis. Her endless patience, scholarly guidance, continual encouragement, constant and energetic supervision, constructive criticism, valuable advice, reading many inferior drafts and correcting them at all stage have made it possible to complete this thesis.
We would like to express our heartiest gratitude to Honorable Teachers Nusrat Jahan, Mohammad Masudur Rahman, Montasir Dipto for their kind help to finish our thesis and also to other faculty members of computer science and engineering department of Daffodil International University.
We would like to thank our entire course mate in Daffodil International University, who took part in this discussion while completing the course work.
Finally, we must acknowledge with due respect the constant support and patients of our parents.
Cardiovascular disease is a leading cause of death in this period. The number of deaths among both males and females increases each day due to heart disease. For example, researchers used machine learning and data mining techniques to support the prognosis of heart disease in healthcare. However, using these techniques there may be a smart system of Heart Disease prediction that is quicker and more proficient than the usual system of diagnosis. The objective of this paper is to use data mining strategies and numerous machine learning algorithms such as Naïve Bayes, Support Vector Machine (SVM), Decision Tree, Logistic Regression, Random Forest, and Various Ensemble Method to gain a more accurate measure. We also suggested two of our own models in this paper. In this paper, a UCI repository Cleveland dataset is used. The sole aim of this paper is to use Data Mining and Machine Learning Techniques to find hidden patterns.
CONTENTS
PAGESBoard of examiners i
Declaration ii
Acknowledgements iii
Abstract iv
CHAPTER
CHAPTER 1: INTRODUCTION
1-31.1 Introduction 1
1.2 Motivation 2
1.3 Rationale of Study 2
1.4 Research Question 2
1.5 Expected Output 3
1.6 Report Layout 3
CHAPTER 2: BACKGROUND STUDY 4-9
2.1 Introduction 4
2.2 Heart Disease 4-7
2.2.1 Heart Disease Definition
2.2.2 Causes & Risk Factors of Heart Disease
2.3 Related Works 8
2.4 Research Summary 9
2.5 Scope of the Problem 9
2.6 Challenges 9
3.1 Introduction 10
3.2 Dataset 11
3.3 Dataset Description & Preprocessing 11-13
3.5 Classification Algorithms 14-17
3.5.1 Naïve Bayes
3.5.2 Support Vector Machine 3.5.3 Decision Tree
3.5.4 Logistic Regression
3.5.5 Random Forest (Ensemble)
3.5.6 Ensemble Method (AdaBoost, Bagging)
3.5.7 Gradient Boosting & Extreme Gradient Boosting 3.5.8 Effective Heart Disease Prediction 1
3.5.9 Effective Heart Disease Prediction 2
CHAPTER 4: EXPERIMENTAL RESULTS AND DISCUSSION 18-40
4.1 Introduction 18
4.2 Experimental Results 18-40
4.2.1 Naïve Bayes (Gaussian NB) 4.2.2 Naïve Bayes (Bernoulli NB) 4.2.3 Support Vector Machine 4.2.4 Linear SVM
4.2.5 Polynomial SVM 4.2.6 RBF SVM
4.2.7 SVM Grid Search CV 4.2.8 Decision Tree
4.2.9 Grid Search CV Decision Tree 4.2.10 Logistic Regression
4.2.11 Logistic Regression Grid Search CV 4.2.12 Random Forest
4.2.13 Grid search CV Random Forest 4.2.14 Extremely Randomized Tree
4.2.16 AdaBoost With Random Forest 4.2.17 Bagging
4.2.18 Gradient Boosting Machine 4.2.19 Extreme Gradient Boosting
4.2.20 Effective Heart Disease Prediction 1 4.2.21 Effective Heart Disease Prediction 2
4.3 Potential Future Improvement 40
4.4 Summary 40
CHAPTER 5: CONCLUSION & FUTURE IMPLICATION
41-435.1 Summary of the study 41
5.2 Conclusion 41
5.3 Recommendation 41
5.4 Implication for further study 41
References 42-43
Figure 2.1 Development of atherosclerosis 6 Figure 3.1 Working procedure of Machine Learning (ML) [Source: [6]] 10
Figure 3.2 Heatmap Of Our Dataset 12
Figure 3.3 Target class 12
Figure 3.4 Comparison Between Target Class Using sex 12
Figure 3.5 Co-Relations of Dataset 13
Figure 3.6 Support Vector Machine. 14
Figure 3.7 Decision Tree 15
Figure 3.8 Logistic Regression 15
Figure 3.9 Random Forest 16
Figure 4.1 ROC Curve of Naïve Bayes (Gaussian NB) 19
Figure 4.2 ROC Curve of Naïve Bayes (Bernoulli NB) 20
Figure 4.3 ROC Curve of Support Vector Machine 21
Figure 4.4 ROC Curve Linear Support Vector Machine (Linear SVM) 22 Figure 4.5 ROC Curve Polynomial Support Vector Machine 23 Figure 4.6 ROC Curve Radial Basis Function Support Vector Machine 24 Figure 4.7 ROC Curve Grid Search CV On Support Vector Machine 25
Figure 4.8 ROC Curve Decision Tree 26
Figure 4.9 ROC Curve GridSearch CV On Decision Tree 27
Figure 4.10 ROC Curve Logistic Regression 28
Figure 4.11 ROC Curve Grid Search CV On Logistic Regression 29
Figure 4.12 ROC Curve Random Forest 30
Figure 4.13 ROC Curve Grid Search CV On Random Forest 31
Figure 4.14 ROC Curve Extra-Trees (Extremely Randomized Tree) 32
Figure 4.15 ROC Curve AdaBoost 33
Figure 4.16 ROC Curve AdaBoost With Random Forest 34
Figure 4.17 ROC Curve Bagging 35
Figure 4.18 ROC Curve Gradient Boosting Machine 36
Figure 4.19 ROC Curve of Extreme Gradient Boosting Machine 37
Figure 5.1 Accuracy of all classifiers 40
Table 2.1 Risk Factors of Heart Disease 7
Table 3.1 Selected Heart Disease Attributes 12
Table 4.1 Classification Report of Naïve Bayes (Gaussian NB) 19
Table 4.2 Confusion Matrix of Naïve Bayes (GaussianNB) 19
Table 4.3 Classification Report of Naïve Bayes (Bernoulli NB) 20
Table 4.4 Confusion Matrix of Naïve Bayes (Bernoulli NB) 20
Table 4.5 Classification Report of Support Vector Machine 21
Table 4.6 Confusion Matrix of Support Vector Machine 21
Table 4.7 Classification Report of Linear Support Vector Machine (Linear SVM) 22 Table 4.8 Confusion Matrix of Linear Support Vector Machine (Linear SVM) 22 Table 4.9 Classification Report of Polynomial Support Vector Machine 23 Table 4.10 Confusion Matrix of Polynomial Support Vector Machine 23 Table 4.11 Classification Report of Radial Basis Function Support Vector Machine 24 Table 4.12 Confusion Matrix of Radial Basis Function Support Vector Machine 24 Table 4.13 Classification Report of Grid Search CV On Support Vector Machine 25 Table 4.14 Confusion Matrix of Grid Search CV On Support Vector Machine 25
Table 4.15 Classification Report of Decision Tree 26
Table 4.16 Confusion Matrix of Decision Tree 26
Table 4.17 Classification Report of Grid Search CV On Decision Tree 27 Table 4.18 Confusion Matrix of Grid Search CV On Decision Tree 27
Table 4.19 Classification Report of Logistic Regression 28
Table 4.20 Confusion Matrix of Logistic Regression 28
Table 4.21 Classification Report of Grid Search CV On Logistic Regression 29 Table 4.22 Confusion Matrix of Grid Search CV On Logistic Regression 29
Table 4.23 Classification Report of Random Forest 30
Table 4.24 Confusion Matrix of Random Forest 30
Table 4.25 Classification Report of Grid Search CV On Random Forest 31 Table 4.26 Confusion Matrix of Grid Search CV On Random Forest 31 Table 4.27 Classification Report of Extra-Trees (Extremely Randomized Tree) 32
Table 4.29 Classification Report of AdaBoost (Adaptive Boosting) 33 Table 4.30 Confusion Matrix of AdaBoost (Adaptive Boosting) 33 Table 4.31 Classification Report of AdaBoost With Random Forest 34 Table 4.32 Confusion Matrix of AdaBoost With Random Forest 34 Table 4.33 Classification Report of Bagging (Bootstrap Aggregating) 35 Table 4.34 Confusion Matrix of Bagging (Bootstrap Aggregating) 35 Table 4.35 Classification Report of Gradient Boosting Machine 36
Table 4.36 Confusion Matrix of Gradient Boosting Machine 36
Table 4.37 Classification Report of Extreme Gradient Boosting 37
Table 4.38 Confusion Matrix of Extreme Gradient Boosting 37
Table 4.39 Classification Report of Effective Heart Disease Prediction 1 38 Table 4.40 Confusion Matrix of Effective Heart Disease Prediction 1 38 Table 4.41 Classification Report of Effective Heart Disease Prediction 2 39 Table 4.42 Confusion Matrix of Effective Heart Disease Prediction 2 39
CHAPTER 1 INTRODUCTION
1.1 Introduction
In the human body, the heart plays a pivotal role. The heart is a pump circulating blood across the whole body. It beats 60-70 times in one minute on average. If the heart stops functioning normally, our body's other organs will stop working. Heart disease is one of the world's most common diseases.
Heart disease is one of the globe's most deadly diseases. As per the latest WHO data released in 2017, deaths from heart disease in Bangladesh entered 14.31 percent of total deaths, and every year cardiovascular disease kills 17.9 million people, 31 percent of global deaths [1]. Heart disease is the major cause of death in the United Kingdom, USA, Canada & Australia, according to CDC (Centrals for Disease Control).
There are several types of heart disease that attack various parts of the body [2].
1. Coronary heart disease 2. Cardiomyopathy 3. Cardiovascular disease 4. Ischaemic heart disease 5. Hypertensive heart disease 6. Heart failure
7. Inflammatory heart disease 8. Valvular heart disease
Common risk factors of heart disease:
1. Age
2. Blood Pressure 3. Total Cholesterol 4. Diabetes
5. Hyper Tension
6. Family History of heart disease 7. Lack of physical exercise 8. Fasting blood sugar
Countries around the world, medical institutions collect vast amounts of cardiovascular disease data.
These collected data can be used to explore heart disease problem in varying data mining & machine learning techniques [3]. But these datasets are very noisy. If we use this raw data, a machine learning algorithm cannot give the most accurate result. Before applying this actual data to the machine learning algorithm, it is essential to pre-process this raw data. Data mining is the examination of large data sets to find out hidden & unknown patterns, knowledge, relationships that are difficult to find out without pre-processing these data (Lee, Liao et al. 2000). Machine Learning techniques are used in various disease diagnostic problem & it is very helpful for doctor to predict disease correctly.
1.2 Motivation
The provision of quality services at inexpensive costs is a significant challenge for healthcare institutions (hospitals, medical centers). Decent service requires correct diagnosis of patients and potential treatments. Poor clinical decisions can lead to disastrous unacceptable consequences.
Hospitals also need to mitigate laboratory testing costs. By using optimal computer-based information and decision support systems, they can accomplish these results. Typically, these systems generate enormous amounts of data in the form of numbers, text, charts, and images.
Typically, these platforms yield massive amounts of data in the form of numbers, text, charts, and images.
Sadly, this information is infrequently used to help clinical basic leadership. There is an abundance of shrouded information in these data that is to a great extent undiscovered. This brings up a vital issue: "How might we transform information into helpful data that can empower medicinal services specialists to settle on clever clinical choices?" This is the principal inspiration for this examination.
It also helps to reduce the cost of treatment by providing effective treatments. It illustrates the outcomes in both tabular and graphical forms to enhance visualization and ease of interpretation.
1.3 Rationale of the Study
We know, world of technology is moving towards artificial intelligence and machine learning techniques, huge amount of raw data is being produced in real time. This data gives us with the opportunity to analyze this huge amount of data using data mining and machine learning techniques.
So far, the medical data is concerned more and more computerized technology and preservation of patient’s data is becoming common in application. Analyzing those data with conventional statistics may give us the answer to HOW questions using machine learning. It can demonstrate the potential solution of those problems. Classification using machine learning and deep learning is being practiced increasingly. These techniques can also reveal hidden patterns or trends.
For using data mining and machine learning techniques, we can classify heart disease patient and non-heart disease patient.
1.4 Research Questions
As of the research project focuses on feature selection and classification of heart disease and non- heart disease patient using machine learning techniques, the followings questions are the things we tried to accomplish in this project.
Can the Heart Disease Symptoms be classified with convincing level of accuracy?
Do all the features are influential which are supposed to be dominated?
Which techniques of ML approaches would be good for classification?
1.5 Expected Output
We are planned to design the research according to the research questions using machine learning algorithms. We expected a benchmark to achieve our goal to reach the following outcomes:
Analyze the dataset Heart Disease of patient should be classified with good accuracy.
Find out the correlation of different attributes in the dataset in developing Heart Disease.
Selection of important features to detect heart disease disorder.
Compare different machine learning classification methods.
1.6 Report Layout
In the first section of the project report, we have examined the review, motivation of the project, we have discussed our objective and what are the results.
The second section deals intensively with our background study on heart disease and literature survey. We have also enrolled many of the studies in this field.
The third section is about the research methodology we have applied. We also covered shortly the classifier algorithms used in this study.
The fourth chapter consists of a lengthy description of our findings and comparative classifier accuracy studies.
At last, the fifth section examines the rundown, future extent of the examination and talks about further territories for concentrate in the comparable field.
CHAPTER 2 BACKGROUND
2.1 Introduction
In the next few parts we will discuss about heart disease. We will also explore the risks and effects of the heart disease. We discussed about the literature survey in similar field.
2.2 Heart Disease
Coronary illness (Heart Disease) is the main source of death in the U.S. Sooner or later in your life, possibly you or one of your friends and family will be compelled to settle on choices about some part of coronary illness [5]. Coronary illness can strike all of a sudden and expect you to settle on choices rapidly.
Around 610,000 Americans bite the dust from the coronary illness every year—that is 1 in every 4 passing [6]. Coronary illness is the most widely recognized kind of coronary illness, slaughtering in excess of 370,000 individuals every year.
As indicated by the most recent WHO information distributed in 2017 Coronary Heart Disease Deaths in Bangladesh achieved 112,791 or 14.31% of all-out passing. The age balanced Death Rate is 108.99 per 100,000 of populace positions Bangladesh #104 on the planet [7].
Hypertension is the main source of cardiovascular and kidney maladies and over 1.5 billion are relied upon to be influenced by hypertension by 2025; the case being particularly unfavorable in South Asia given that the predominance of hypertension is now at 40 percent [8].
As per the World Health Organization (WHO), one out of three grown-ups more than 35 years has hypertension, however, 50% of them don't know about it, as indicated by a message got from the International Center for Diarrheal Diseases Research, Bangladesh (icddr,b) [9].
Heart disease symptoms depend on types of heart disease [10].
The most well-known Signs of coronary course malady is angina or chest torment. Angina can be portrayed as distress, largeness, weight, throbbing, copying, totality, pressing, or excruciating inclination in your chest. Angina may likewise be felt in the shoulders, arms, neck, throat, jaw, or back.
Different symptoms of coronary artery disease include:
Shortness of breath
Palpitations (sporadic heart pulsates, or a "flip-flop" feeling in your chest)
A quicker heartbeat
Shortcoming or tipsiness
Queasiness
Perspiring
Signs of a Heart Attack
Uneasiness, weight, greatness, or agony in the chest, arm, or beneath the breastbone
Uneasiness emanating to the back, jaw, throat, or arm
Totality, acid reflux, or stifling inclination.
Perspiring, sickness, spewing, or wooziness.
Extraordinary shortcoming, tension, or shortness of breath.
Quick or sporadic pulses
2.2.1 Heart Disease Definition
Any disorder that influences the heart. Now and then the expression "heart disease" is utilized barely and erroneously as an equivalent word for coronary supply route sickness. Coronary illness is synonymous with heart ailment however not with the cardiovascular infection which is any malady of the heart or veins. Among the numerous sorts of heart disease, see, for instance: Angina;
Arrhythmia; Congenital coronary illness; Coronary artery disease (CAD); Dilated cardiomyopathy;
Heart assault (myocardial localized necrosis); Heart disappointment; Hypertrophic cardiomyopathy;
Mitral spewing forth; Mitral valve prolapse; and Pulmonary stenosis [11].
2.2.2 Causes and Risk Factors of Heart Disease Heart disease causes depend on the types of heart disease.
Causes
Heart defects you are born with (congenital heart defects)
Coronary artery illness
High force per unit area
Diabetes
Smoking
Excessive use of alcohol or caffeine
Drug abuse
Stress
Some over-the-counter medications, prescription medications, dietary supplements and favorer remedies
Valvular cardiopathy
Dilated heart condition
Hypertrophic heart condition
Restrictive heart condition
Bacteria, Viruses and Parasites
Rheumatic fever
Infections (infectious endocarditis)
Connective tissue disorders
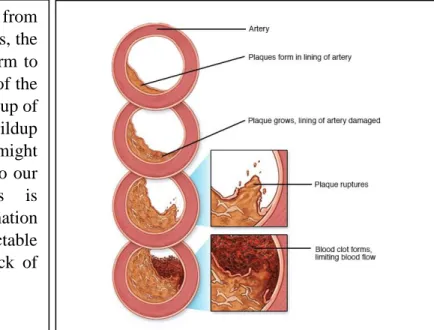
While disorder will seek advice from completely different heart or vessel issues, the term is commonly accustomed mean harm to our heart or blood vessels by hardening of the arteries (ath-ur-o-skluh-ROE-sis), a buildup of fatty plaques in our arteries. Plaque buildup thickens and stiffens artery walls, which might inhibit blood flow through our arteries to our organs and tissues. Atherosclerosis is additionally the foremost common explanation for disorder. It are often caused by correctable issues, like associate unhealthy diet, lack of exercise, being overweight and smoking.
Figure 2.1 Development of atherosclerosis
Risk factors:
Table 2.1 Risk Factors of Heart Disease
Factors Description
Age Aging increases our risk of damaged and narrowed arteries and weakened or thickened heart muscle
Sex Men are generally at greater risk of heart disease. However, women's risk increases after menopause.
Family history A family history of heart disease increases your risk of coronary artery disease,
especially if a parent developed it at an early age (before age 55 for a male relative, such as your brother or father, and 65 for a female relative, such as your mother or sister).
Smoking Nicotine constricts your blood vessels, and carbon monoxide can damage their inner lining, making them more susceptible to atherosclerosis. Heart attacks are more common in smokers than in nonsmokers.
Certain chemotherapy drugs and radiation
therapy for cancer
Some chemotherapy drugs and radiation therapies may increase the risk of cardiovascular disease.
Poor diet A diet that's high in fat, salt, sugar and cholesterol can contribute to the development of heart disease.
High blood pressure Uncontrolled high blood pressure can result in hardening and thickening of your arteries, narrowing the vessels through which blood flows.
High blood cholesterol levels
High levels of cholesterol in your blood can increase the risk of formation of plaques and atherosclerosis.
Diabetes Diabetes increases your risk of heart disease. Both conditions share similar risk factors, such as obesity and high blood pressure.
Obesity Excess weight typically worsens other risk factors.
Physical inactivity Lack of exercise also is associated with many forms of heart disease and some of its other risk factors, as well.
Stress Unrelieved stress may damage your arteries and worsen other risk factors for heart disease.
Poor hygiene Not regularly washing your hands and not establishing other habits that can help prevent viral or bacterial infections can put you at risk of heart infections, especially if you already have an underlying heart condition. Poor dental health also may contribute to heart disease.
2.3 Related Works
Presently days, heart disease is a standout amongst the riskiest disease of everywhere throughout the world. Data mining & machine learning procedures are utilizing comprehensively for heart disease prediction. The most utilizing machine learning mining methods are Decision Tree, Naïve Bayes, Neural Network, KNN calculation, Artificial Neural Network (ANN), Automatically defined groups bagging algorithm, Support Vector Machine Algorithm have been executed for distributing past previous papers and giving a decent precision level. These Research has been assumed an imperative job in the advanced therapeutic framework. Various works have been done identified with heart disease prediction system by utilizing different data mining techniques and machine learning algorithms by numerous authors. The point of all is to accomplish better precision and to make the system progressively effective with the goal that it can predict the odds of heart assault.
In 2015, Jaymin Patel and Prof. Tejal Upadhyay, Dr. Samir Patel introduced an effective methodology for heart disease prediction utilizing machine learning and Data Mining systems. They utilized Cleveland Dataset from UCI archive. They utilized different Machine Learning Algorithm Like Decision Tree, Logistic Model, Random Forest and got the best outcome in Decision Tree with most minimal test blunder (0.16666667) among these three calculations [12].
In 2017, Asst. Educator Sanjay Kumar Sen exhibited a viable Heart Disease prediction paper utilizing machine learning. They have utilized Naïve Bayes, SVM, Decision Tree, K-Nearest Neighbor Machine Learning calculation. Support Vector Machine Provided the Highest exactness (84.1584) [13].
Ashok Kumar Dwivedi et al represented to various algorithms like Naive Bayes, Classification Tree, KNN, Logistic Regression, SVM and ANN. Among them, Logistic Regression calculation gives better exactness [14].
Sujata Joshi and Mydhili They utilize three classification algorithms to be specific decision tree, Naïve Bayes, and K-NN and presents the performance among them. It has discovered the best prediction algorithm regarding its accuracy and error rate on specific dataset [15].
Sellappan Palaniappan et al A proficient heart disease prediction system is created by utilizing data mining and machine learning algorithm like Naive Bayes, Neural Network, and Decision Trees was put together by Sellappan Palaniappan et al. Every algorithm has its very own resource for getting the best outcomes. It is web-based, easy to understand and expandable [16].
Shadab Adam Pattekari Shadab Adam Pattekari and Asma Parveen introduced a proficient system utilizing data mining modeling method, like Naive Bayes. It is actualized as a web-based application.
in this user responds to the predefined questions. It recovers concealed information from put away the database and contrasts the user esteems and prepared informational data [17].
2.4 Research Summary
According to previous literature research and study indicates there has been a modest number of studies in this field. The studies has-been fairly successful in their own way. This type of computerized classification problem has been researched on many other diseases. From studying different algorithms to make re-optimization to the existing algorithm to find better results, researchers have gone through many different ways. The observable factor is that although the accuracy has been quite good, yet we have not seen any real implementation of these processes.
Probably the idea of consulting a computerized diagnosis system for a disease isn’t as convincing as consulting a doctor for the public. But with more accuracy and some experimental periods, a fully automated diagnosis probably would be as normal as consulting a doctor.
2.5 Scope of the Problem
We used different machine learning algorithms and here includes training and testing dataset of the model. We try to search the link between the dataset attributes to find out which attributes are very effective for causing heart disease.
In our country, we see that an automated diagnosis system is a lengthy process in health care. With an improved-symptoms analyzing algorithm, the system can suggest a diagnostic test to the users hence reducing time and cost in big hospitals.
2.6 Challenges
We are very new in the machine learning section. It was difficult for us to cope with it. In this thesis, we used many machine learning algorithms and technique. So, evaluating correctly all the machine learning algorithms was a little difficult. we also faced problems to improve our model using grid search cv, and many techniques. In Ensemble of Ensemble section, we proposed our two models and it was hard for us.
CHAPTER 3
RESEARCH METHODOLOGY
3.1 Introduction
Machine learning, abbreviated as ML, is an area of computer science, especially artificial intelligence that practices statistical methods to provide computers the ability to learn with data, without being explicitly programmed (programmed once only) [18].
Machine Learning (ML) is defined as a technique where large volume data in the database is processed and analyzed to reveal useful patterns/trends and new relations among attributes for achieving various intended goals. Machine learning algorithms are two types [19]:
1. Supervised learning 2. Unsupervised learning
Supervised learning infers outputs from labeled training data consisting of a set of training examples while unsupervised learning surmises unlabeled training data to determine the output. Supervised learning deals with classification problem and unsupervised learning treats with clustering problem.
Another type of machine learning approach is reinforcement learning which refers to take decisions based on an environment.
Machine learning algorithms consist of two phases [20]:
1. Training phase 2. Test phase
In the training phase, a machine learning algorithm is applied to train up the system using the given data and in the test phase, new data is given as input in the already built system for output. The system takes the new data and models accordingly. In addition, before the training phase, the data are preprocessed and after the test phase, it may require to post-process the output. Figure 3.1 depicts a comprehensive view of the machine learning procedure.
Figure 3.1. Working procedure of Machine Learning (ML) [Image Source: [20]]
Machine Traditional data analysis techniques through a statistical approach have been used. This approach has been very useful and no doubt it will be still be used in the foreseeable future as the storage capacity of modern computers increased, accumulating and preserving various transactional and other types of data became more convenient. Inevitably the size and diversity of the data grew larger and traditional data analysis techniques began to be less effective and inefficient for such a large amount of data warehouses. So, machine learning techniques gained popularity among large companies and researchers.
The latest explosion of Medical data through machine automation and use of computerized technology in the diagnosis and treatment of disease. It has made the machine learning to discover and extracting new patterns and useful knowledge in medical advancement. Although the acceptance of automated classification of disease is still not popular and desirable among the medical community, it is still a research area of the enormous potential for data scientist and researchers around the globe. So, we attempt to explore this concept of machine learning to build a machine- learned system to analyze the heart disease.
3.2 Dataset
For our work we have used data set has been already prepared or collected. The claimer of the dataset benignantly made the dataset available in the UCI Repository from which we obtained access to the dataset [21]. Followings are the information of the creative personal of this dataset.
3.3 Dataset Description & Preprocessing
The dataset has 76 attributes and 303 records. However, only 13 attributes are used for this study &
testing.
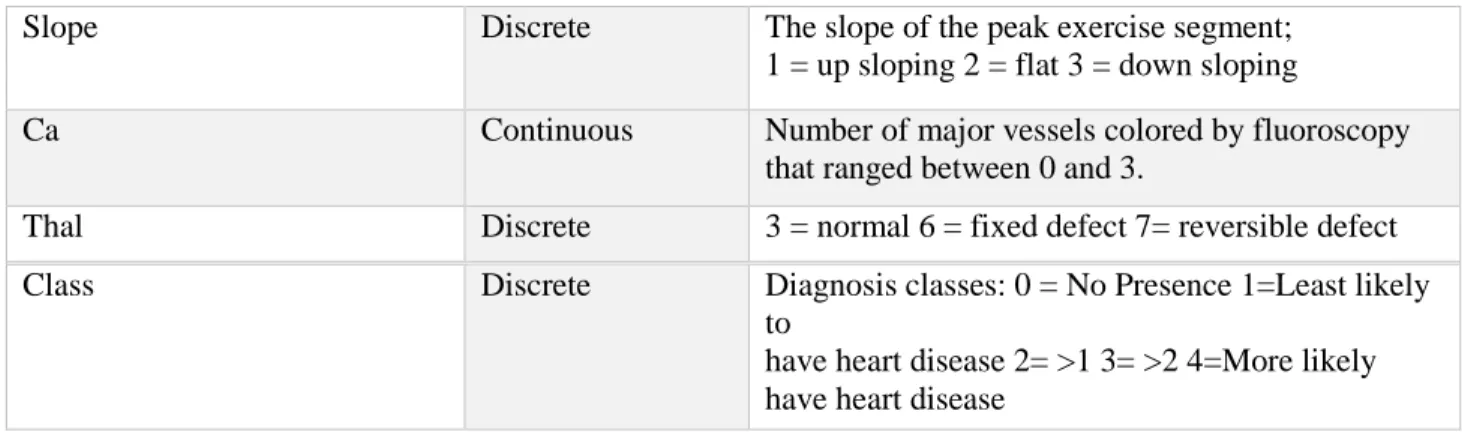
Table 3.1 Selected Heart Disease Attributes
Name Type Description
Age Continuous Age in years
Sex Discrete 0 = female 1 = male
Cp Discrete Chest pain type: 1 = typical angina, 2 = atypical
angina, 3 = non-anginal pain 4 = asymptom
Trestbps Continuous Resting blood pressure (in mm Hg)
Chol Continuous Serum cholesterol in mg/dl
Fbs Discrete Fasting blood sugar>120 mg/dl: 1-true 0=False
Exang Continuous Maximum heart rate achieved
Discrete Exercise induced angina: 1 = Yes 0 = No
Thalach Continuous Maximum heart rate achieved
Old peak ST Continuous Depression induced by exercise relative to rest
Slope Discrete The slope of the peak exercise segment;
1 = up sloping 2 = flat 3 = down sloping
Ca Continuous Number of major vessels colored by fluoroscopy
that ranged between 0 and 3.
Thal Discrete 3 = normal 6 = fixed defect 7= reversible defect
Class Discrete Diagnosis classes: 0 = No Presence 1=Least likely
to
have heart disease 2= >1 3= >2 4=More likely have heart disease
Figure 3.2 Heatmap Of Our Dataset
Figure 3.4 Comparison Between Target Class Using Sex
Figure 3.2 shows that there is no missing data in our dataset and figure 3.3 indicates the number of heart disease in our target class and the number of non-heart disease. Figure 3.4 illustrates the comparison between male and female data.
Figure 3.3 Target class
Co-Relations between features:
Figure 3.5 Co-Relations of Dataset
Feature Scaling:
Before applying machine learning algorithms, we normalized our dataset by feature scaling.
3.5 Classification Algorithms
3.5.1 Naïve Bayes
Naïve Bayes is a Bayes Theorem based classification algorithm, which figures a likelihood by tallying the recurrence of qualities and mix of qualities n verifiable data. Bayes hypothesis finds the likelihood of an occasion happening given the likelihood of another occasion that has just happened.
P(B given A) = P(A and B)/P(A)
Naïve Bayes algorithm advantage is, it requires little amount of preparing data for evaluating the parameters fundamental for classification.
3.5.2 Support Vector Machines
Support vector machine is the most prevalent supervised machine learning technique having a pre- characterized target variable which can be utilized for classifier and indicator. For classification, it finds a hyperplane in the component space that separates the classes. The learning data points are described by an SVM model as points in the feature space, mapped in such a way that points belonging to separate classes are segregated as widely as possible. The test data points are then mapped into the same space and classified according to which side of the margin is closest to each other.
Figure 3.6 Support Vector Machine 3.5.3 Decision Tree
A Decision Tree is a choice help apparatus that utilizes a tree-like diagram or model of choices and their conceivable results including chance occasion results and utility. It is one of the approaches to show a calculation. Choice trees are normally utilized in activities examine, explicitly in a choice investigation to help and recognize a technique that will in all likelihood achieve the objective. It is likewise a well-known instrument in AI. A Decision tree can without much of a stretch be changed to a lot of tenets by mapping from the root hub to the leaf hubs one by one. At long last, by following these tenets, suitable ends can become to.
Figure 3.7 Decision Tree
3.5.4 Logistic Regression
Logistic regression is a Boolean classification algorithm. For a given set of independent variables, it is the classification algorithm used to predict binary results. The outcome of the dependent variable is discrete. Logistic regression is named for the function utilized, the Logistic function, at the center of the strategy. Statisticians developed the logistical function, also called the Sigmoid function, to describe the characteristics of population growth in ecology, rising rapidly and maxing out at the environmental carrying capacity. It is an S-shaped curve capable of taking any real-valued number and mapping it to a value between 0 and 1, but never exactly at those limits.
1/1+e−x
e is the basis of the natural logarithms and x is the transforming value through the logistic function.
Figure 3.8 Logistic Regression
3.5.5 Random Forest (Ensemble)
Random Forests is an ensemble learning technique for classification and regression techniques. At training time, it develops a number of Decision trees and outputs the class which is the mode of the result classes by individual trees. It also attempts to reduce the problems of high variance and high bias by discovering a natural balance between the two extremes on average.
Figure 3.9 Random Forest
3.5.6 Ensemble Model
Ensemble methodologies is a strategy of machine learning which connects numerous basic models to manufacture an appropriate predictive model.
Ada-boost: It concentrates on classification issues and seeks to turn a set of poor classifiers into a powerful one. Comparable to human learning, the algorithm gets to know from past errors by concentrating more on complex issues that previous learning did not get correct.
Bagging: Bootstrap aggregating, otherwise called bagging, is a meta-algorithm for machine learning ensemble designed to improve the soundness and accuracy of the algorithms utilized in statistical classification and regression. It also decreases variance and helps to prevent overfitting.
3.5.7 Gradient Boosting Machine & Extreme Gradient Boosting (GBM & XGB)
It’s operates for both classification and regression. Sequentially adding predictors, each of which fits new predictors for residual errors when correcting its predecessor.
Contrast this with AdaBoost: Deflect instance weights at each emphasis.
There are three elements to gradient boosting:
Loss function to be optimized
Weak learner to make predictions
Additive model to add weak learners to minimize the loss function
XG-Boost: One of Kaggle's most loved machine learning algorithms is XG-Boost (Xtreme Gradient Boosting). It can be used for tasks of supervised learning like regression, classification, and ranking.
It is built on gradient boosting framework principles and designed to "push the extreme limits of machine computing to provide a scalable, portable and accurate library."
Objective Function: Training Loss + Regularization
3.5.8 Effective Heart Disease Prediction 1
We used Random Forest, Decision Tree, and Logistic Regression in this ensemble model. We combined Decision Tree with Random Forest where Logistic Regression is used as a meta classifier.
3.5.9 Effective Heart Disease Prediction 2
In this ensemble model, first we made Random Forest Model then we fitted the Random Forest model with AdaBoost after that we fitted this combine model into Bagging Classifier.
CHAPTER 4
EXPERIMENTAL RESULTS AND DISCUSSION
4.1 Introduction
In the following chapters we will discuss about the results of the guided experiment. We will research and compare the different classifier accuracy and performance. We will show the results in graph and also in tables.
4.2 Experimental Results
Our experiment includes many machine learning algorithms- (Random Forest Classifier. Logistic regression. Naïve Bayes classifier, Decision tree, Support vector machine, Ensemble methods, KNN). The input of our system is the dataset described in Section 3.2 and 3.3. As our work is supervised, the dataset is divided into two set using Hold out method spitting data set:
1. Training Set (80% of data) – 242 data.
2. Test Set (20% of data) – 61 data.
The models are trained using training set and after building model, it is tested on test set.
We obtained the output in terms of confusion matrix as a standard machine learning algorithm.
We measured accuracy, precision, recall with respect to class predictions. The accuracy is measured using the formula in Eq. (9), precision using Eq. (10) and recall using Eq. (11)
The following sections from 4.2.1 to 4.2.4 extensively discusses the results from our study.
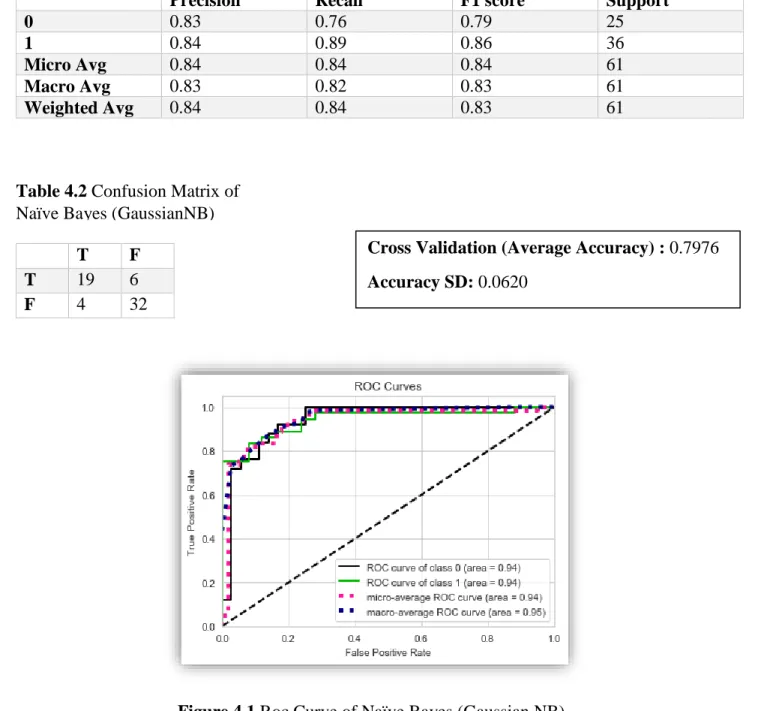
4.2.1 Naïve Bayes (Gaussian NB)
After Applying Naïve Bayes (GaussianNB) in the dataset We got the Following Test Accuracy Score, Classification Report, Confusion Matrix, Cross Validation (Average Accuracy) and Standard Deviation.
Accuracy score: 0.8361
Precision Recall F1 score Support
0 0.83 0.76 0.79 25
1 0.84 0.89 0.86 36
Micro Avg 0.84 0.84 0.84 61
Macro Avg 0.83 0.82 0.83 61
Weighted Avg 0.84 0.84 0.83 61
T F
T 19 6
F 4 32
Figure 4.1 Roc Curve of Naïve Bayes (Gaussian NB)
Cross Validation (Average Accuracy) : 0.7976 Accuracy SD: 0.0620
Table 4.1 Classification Report of Naïve Bayes (GaussianNB)
Table 4.2 Confusion Matrix of Naïve Bayes (GaussianNB)
4.2.2 Naïve Bayes (Bernoulli NB)
After Applying Naïve Bayes (Bernoulli NB) in the dataset we got the Following Test Accuracy Score, Classification Report, Confusion Matrix, Cross Validation (Average Accuracy) and Standard Deviation.
Accuracy score: 0.8689
Precision Recall F1 score support
0 0.81 0.88 0.85 25
1 0.91 0.86 0.89 36
Micro Avg 0.87 0.87 0.87 61
Macro Avg 0.86 0.87 0.87 61
Weighted Avg 0.87 0.87 0.87 61
T F
T 22 3
F 5 31
Figure 4.2 Roc Curve of Naïve Bayes (Bernoulli NB)
Cross Validation (Average Accuracy): 0.8210 Accuracy SD: 0.0532
Table 4.3 Classification Report of Naïve Bayes (Bernoulli NB)
Table 4.4 Confusion Matrix of Naïve Bayes (Bernoulli NB)
4.2.3 Support Vector Machine
After Applying Support Vector Machine in the dataset, we got the Following Test Accuracy Score, Classification Report, Confusion Matrix, Cross Validation (Average Accuracy) and Standard Deviation.
Accuracy score: 0.8689
Precision Recall F1 score support
0 0.77 0.96 0.86 25
1 0.97 0.81 0.88 36
Micro Avg 0.87 0.87 0.87 61
Macro Avg 0.87 0.88 0.87 61
Weighted Avg 0.89 0.87 0.87 61
T F
T 24 1
F 7 29
Figure 4.3 ROC Curve of Support Vector Machine
Cross Validation (Average Accuracy): 0.5510 Accuracy SD: 0.0165
Table 4.5 Classification Report of Support Vector Machine
Table 4.6 Confusion Matrix of Support Vector Machine
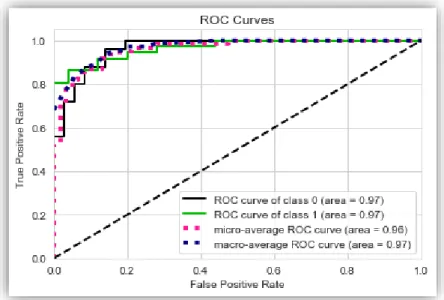
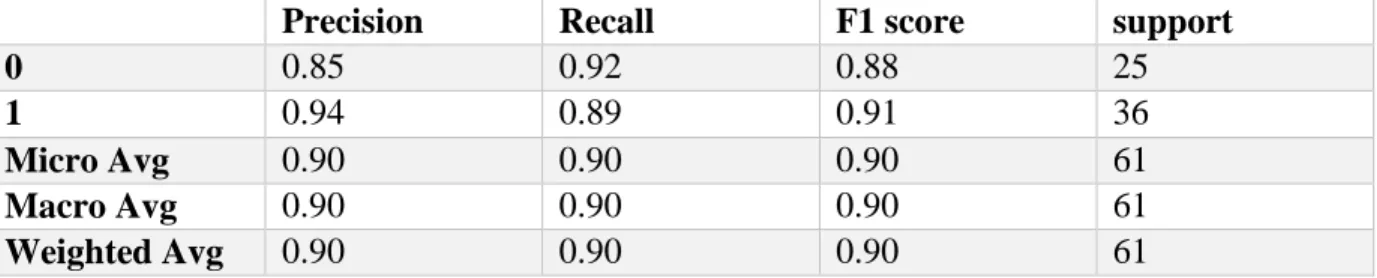
4.2.4 Linear Support Vector Machine (Linear SVM)
After Applying Linear SVM in the dataset, we got the Following Test Accuracy Score, Classification Report, Confusion Matrix, Cross Validation (Average Accuracy) and Standard Deviation.
Accuracy score: 0.9016
Precision Recall F1 score support
0 0.85 0.92 0.88 25
1 0.94 0.89 0.91 36
Micro Avg 0.90 0.90 0.90 61
Macro Avg 0.90 0.90 0.90 61
Weighted Avg 0.90 0.90 0.90 61
T F
T 23 2
F 4 32
Figure 4.4 ROC Curve Linear Support Vector Machine (Linear SVM)
Cross Validation (Average Accuracy): 0.8370 Accuracy SD: 0.00661
Table 4.7 Classification Report of Linear Support Vector Machine (Linear SVM)
Table 4.8 Confusion Matrix of Linear Support Vector Machine (Linear SVM)
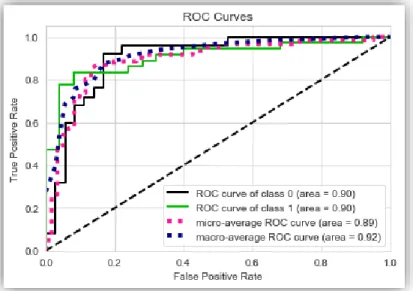
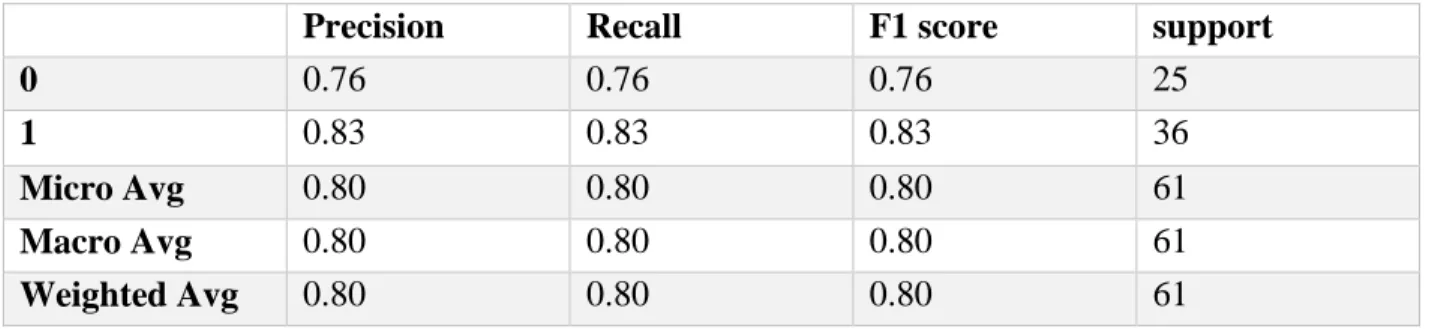
4.2.5 Polynomial Support Vector Machine (Polynomial SVM)
After Applying Polynomial SVM in the dataset, we got the Following Test Accuracy Score, Classification Report, Confusion Matrix, Cross Validation (Average Accuracy) and Standard Deviation.
Accuracy score: 0.8033
Precision Recall F1 score support
0 0.76 0.76 0.76 25
1 0.83 0.83 0.83 36
Micro Avg 0.80 0.80 0.80 61
Macro Avg 0.80 0.80 0.80 61
Weighted Avg 0.80 0.80 0.80 61
T F
T 19 6
F 6 30
Figure 4.5 ROC Curve Polynomial Support Vector Machine
Cross Validation (Average Accuracy): 0.7159 Accuracy SD: 0.0660
Table 4.9 Classification Report of Polynomial Support Vector Machine (Polynomial SVM)
Table 4.10 Confusion Matrix of Polynomial Support Vector Machine (Polynomial SVM)
4.2.6 Radial Basis Function Support Vector Machine (RBF SVM)
After Applying RBF SVM in the dataset, we got the Following Test Accuracy Score, Classification Report, Confusion Matrix, Cross Validation (Average Accuracy) and Standard Deviation.
Accuracy score: 0.8689
Precision Recall F1 score support
0 0.77 0.96 0.86 25
1 0.97 0.81 0.88 36
Micro Avg 0.87 0.87 0.87 61
Macro Avg 0.87 0.88 0.87 61
Weighted Avg 0.89 0.87 0.87 61
T F
T 24 1
F 7 9
Figure 4.6 ROC Curve Radial Basis Function Support Vector Machine
Cross Validation (Average Accuracy): 0.5510 Accuracy SD: 0.0165
Table 4.11 Classification Report of Radial Basis Function Support Vector Machine (RBF SVM)
Table 4.12 Confusion Matrix of Radial Basis Function Support Vector Machine (RBF SVM)
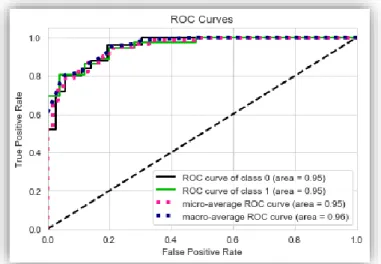
4.2.7 Grid Search CV On Support Vector Machine
After Applying Grid Search CV on Support Vector Machine in the dataset, we got the Following Test Accuracy Score, Classification Report, Confusion Matrix, Cross Validation (Average Accuracy) and Standard Deviation.
Best Parameter: {'C': 10, 'gamma': 0.01, 'kernel': 'rbf'}
Accuracy score: 0.9016
Precision Recall F1 score support
0 0.85 0.92 0.88 25
1 0.94 0.89 0.91 36
Micro Avg 0.90 0.90 0.90 61
Macro Avg 0.90 0.90 0.90 61
Weighted Avg 0.90 0.90 0.90 61
T F
T 23 2
F 4 32
Figure 4.7 ROC Curve Grid Search CV On Support Vector Machine
Cross Validation (Average Accuracy): 0.7878 Accuracy SD: 0.0577
Table 4.13 Classification Report of Grid Search CV On Support Vector Machine
Table 4.14 Confusion Matrix of Grid Search CV On Support Vector Machine
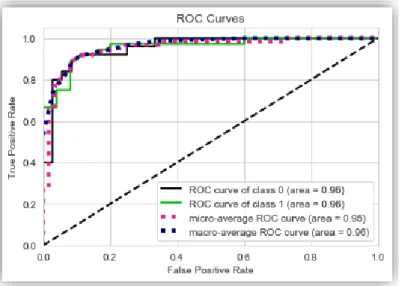
4.2.8 Decision Tree
After Applying Decision Tree in the dataset, we got the Following Test Accuracy Score, Classification Report, Confusion Matrix, Cross Validation (Average Accuracy) and Standard Deviation.
Accuracy score: 0.8689
Precision Recall F1 score support
0 0.84 0.84 0.84 25
1 0.89 0.89 0.89 36
Micro Avg 0.87 0.87 0.87 61
Macro Avg 0.86 0.86 0.86 61
Weighted Avg 0.87 0.87 0.87 61
T F
T 21 4
F 4 32
Cross Validation (Average Accuracy): 0.7682 Accuracy SD: 0.0678
Table 4.15 Classification Report of Decision Tree
Table 4.16 Confusion Matrix of Decision Tree
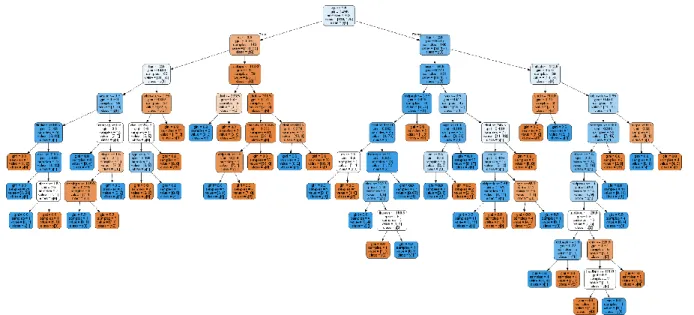
Figure 4.8 ROC Curve Decision Tree 4.2.9 Grid Search CV On Decision Tree
After Applying GridSearch CV on Decision Tree in the dataset we got the Following Test Accuracy Score, Classification Report, Confusion Matrix, Cross Validation (Average Accuracy) and Standard Deviation.
Best Params: {'min_samples_leaf': 9}
Accuracy score: 0.8197
Precision Recall F1 score support
0 0.79 0.76 0.78 25
1 0.84 0.86 0.85 36
Micro Avg 0.82 0.82 0.82 61
Macro Avg 0.81 0.81 0.81 61
Weighted Avg 0.82 0.82 0.82 61
T F
T 19 6
F 5 31
Figure 4.9 ROC Curve Grid Search CV On Decision Tree
Cross Validation (Average Accuracy): 0.7975 Accuracy SD: 0.0603
Table 4.17 Classification Report of Grid Search CV On Decision Tree
Table 4.18 Confusion Matrix of Grid Search CV On Decision Tree
4.2.10 Logistic Regression
After Applying Logistic Regression in the dataset, we got the Following Test Accuracy Score, Classification Report, Confusion Matrix, Cross Validation (Average Accuracy) and Standard Deviation.
Accuracy score: 0.8689
Precision Recall F1 score support
0 0.81 0.88 0.85 25
1 0.91 0.86 0.89 36
Micro Avg 0.87 0.87 0.87 61
Macro Avg 0.86 0.87 0.87 61
Weighted Avg 0.87 0.87 0.87 61
T F
T 22 3
F 5 31
Figure 4.10 ROC Curve Logistic Regression
Cross Validation (Average Accuracy): 0.8237 Accuracy SD: 0.0676
Table 4.19 Classification Report of Logistic Regression
Table 4.20 Confusion Matrix of Logistic Regression
4.2.11 Grid Search CV On Logistic Regression
After Applying Grid Search CV on Logistic Regression in the dataset, we got the Following Test Accuracy Score, Classification Report, Confusion Matrix, Cross Validation (Average Accuracy) and Standard Deviation.
Best Params: {'C': 0.10001}
Accuracy score: 0.9016
Precision Recall F1 score support
0 0.91 0.84 0.87 25
1 0.89 0.94 0.92 36
Micro Avg 0.90 0.90 0.90 61
Macro Avg 0.90 0.89 0.90 61
Weighted Avg 0.90 0.90 0.90 61
T F T 21 4
F 2 34
Figure 4.11 ROC Curve Grid Search CV On Logistic Regression
Cross Validation (Average Accuracy): 0.8303 Accuracy SD: 0.0699
Table 4.21 Classification Report of Grid Search CV On Logistic Regression
Table 4.22 Confusion Matrix of Grid Search CV On Logistic Regression
4.2.12 Random Forest
After Applying Random Forest in the dataset, we got the Following Test Accuracy Score, Classification Report, Confusion Matrix, Cross Validation (Average Accuracy) and Standard Deviation.
Accuracy score: 0.8083
Precision Recall F1 score support
0 0.72 0.84 0.78 25
1 0.88 0.78 0.82 36
Micro Avg 0.80 0.80 0.80 61
Macro Avg 0.80 0.81 0.80 61
Weighted Avg 0.81 0.80 0.80 61
T F T 21 4
F 8 28
Figure 4.12 ROC Curve Random Forest
Cross Validation (Average Accuracy): 0.8045 Accuracy SD: 0.0832
Table 4.23 Classification Report of Random Forest
Table 4.24 Confusion Matrix of Random Forest
4.2.13 Grid Search CV On Random Forest
After Applying Grid Search CV on Random Forest in the dataset we got the Following Test Accuracy Score, Classification Report, Confusion Matrix, Cross Validation (Average Accuracy) and Standard Deviation.
Best Params: {'bootstrap': True, 'criterion': 'gini', 'max_depth': 3,'min_samples_leaf': 1, 'min_samples_split': 10}
Accuracy score: 0.9180
Precision Recall F1 score support
0 0.92 0.88 0.90 25
1 0.92 0.94 0.93 36
Micro Avg 0.92 0.92 0.92 61
Macro Avg 0.92 0.92 0.91 61
Weighted Avg 0.92 0.92 0.92 61
T F
T 22 3
F 2 34
Figure 4.13 ROC Curve Grid Search CV On Random Forest
Cross Validation (Average Accuracy): 0.8282 Accuracy SD: 0.0366
Table 4.25 Classification Report of Grid Search CV On Random Forest
Table 4.26 Confusion Matrix of Grid Search CV On Random Forest
4.2.14 Extra-Trees (Extremely Randomized Tree)
After Applying Extremely Randomized Tree in the dataset, we got the Following Test Accuracy Score, Classification Report, Confusion Matrix, Cross Validation (Average Accuracy) and Standard Deviation.
Accuracy score: 0.8033
Precision Recall F1 score support
0 0.71 0.88 0.79 25
1 0.90 0.75 0.82 36
Micro Avg 0.80 0.80 0.80 61
Macro Avg 0.80 0.81 0.80 61
Weighted Avg 0.82 0.80 0.80 61
T F
T 22 3
F 9 27
Figure 4.14 ROC Curve Extra-Trees (Extremely Randomized Tree)
Cross Validation (Average Accuracy): 0.8013 Accuracy SD: 0.0759
Table 4.27 Classification Report of Extra-Trees (Extremely Randomized Tree)
Table 4.28 Confusion Matrix of Extra- Trees (Extremely Randomized Tree)
4.2.15 AdaBoost (Adaptive Boosting)
After Applying AdaBoost in the dataset, we got the Following Test Accuracy Score, Classification Report, Confusion Matrix, Cross Validation (Average Accuracy) and Standard Deviation.
Accuracy score: 0.8361
Precision Recall F1 score support
0 0.83 0.76 0.79 25
1 0.84 0.89 0.86 36
Micro Avg 0.84 0.84 0.84 61
Macro Avg 0.83 0.82 0.83 61
Weighted Avg 0.84 0.84 0.83 61
T F
T 19 6
F 4 32
Figure 4.15 ROC Curve AdaBoost
Cross Validation (Average Accuracy): 0.8100 Accuracy SD: 0.0855
Table 4.29 Classification Report of AdaBoost (Adaptive Boosting)
Table 4.30 Confusion Matrix of AdaBoost (Adaptive Boosting)
4.2.16 AdaBoost With Random Forest
After Applying AdaBoost with Random Forest in the dataset, we got the Following Test Accuracy Score, Classification Report, Confusion Matrix, Cross Validation (Average Accuracy) and Standard Deviation.
Accuracy score: 0.8689
Precision Recall F1 score support
0 0.81 0.88 0.85 25
1 0.91 0.86 0.89 36
Micro Avg 0.87 0.87 0.87 61
Macro Avg 0.86 0.87 0.87 61
Weighted Avg 0.87 0.87 0.87 61
T F
T 22 3
F 5 31
Figure 4.16 ROC Curve AdaBoost With Random Forest
Cross Validation (Average Accuracy): 0.8076 Accuracy SD: 0.0585
Table 4.31 Classification Report of AdaBoost With Random Forest
Table 4.32 Confusion Matrix of AdaBoost with Random Forest
4.2.17 Bagging (Bootstrap Aggregating)
After Applying Bootstrap Aggregating in the dataset, we got the Following Test Accuracy Score, Classification Report, Confusion Matrix, Cross Validation (Average Accuracy) and Standard Deviation.
Accuracy score: 0.8689
Precision Recall F1 score support
0 0.84 0.84 0.84 25
1 0.89 0.89 0.89 36
Micro Avg 0.87 0.87 0.87 61
Macro Avg 0.86 0.86 0.86 61
Weighted Avg 0.87 0.87 0.87 61
T F
T 21 4
F 4 32
Figure 4.17 ROC Curve Bagging
Cross Validation (Average Accuracy): 0.8037 Accuracy SD: 0.0746
Table 4.33 Classification Report of Bagging (Bootstrap Aggregating)
Table 4.34 Confusion Matrix of Bagging (Bootstrap Aggregating)
4.2.18 Gradient Boosting Machine
After Applying Gradient Boosting Machine in the dataset, we got the Following Test Accuracy Score, Classification Report, Confusion Matrix, Cross Validation (Average Accuracy) and Standard Deviation.
Accuracy score: 0.8852
Precision Recall F1 score support
0 0.85 0.88 0.86 25
1 0.91 0.89 0.90 36
Micro Avg 0.89 0.89 0.89 61
Macro Avg 0.88 0.88 0.88 61
Weighted Avg 0.89 0.89 0.89 61
T F
T 22 3
F 4 32
Figure 4.18 ROC Curve Gradient Boosting Machine
Cross Validation (Average Accuracy): 0.8137 Accuracy SD: 0.0781
Table 4.35 Classification Report of Gradient Boosting Machine
Table 4.36 Confusion Matrix of Gradient Boosting Machine
4.2.19 Extreme Gradient Boosting
After Applying Extreme Gradient Boosting in the dataset, we got the Following Test Accuracy Score, Classification Report, Confusion Matrix, Cross Validation (Average Accuracy) and Standard Deviation.
Accuracy score: 0.8525
Precision Recall F1 score support
0 0.83 0.80 0.82 25
1 0.86 0.89 0.88 36
Micro Avg 0.85 0.85 0.85 61
Macro Avg 0.85 0.84 0.85 61
Weighted Avg 0.85 0.85 0.85 61
T F
T 20 5
F 4 32
Figure 4.19 ROC Curve of Extreme Gradient Boosting Machine
Cross Validation (Average Accuracy): 0.7874 Accuracy SD: 0.0775
Table 4.37 Classification Report of Extreme Gradient Boosting
Table 4.38 Confusion Matrix of Extreme Gradient Boosting
4.2.20 Ensemble of Ensemble (Effective Heart Disease Prediction 1)
This is our proposed model 1 for Effective heart disease prediction using machine learning. In This Ensemble of Ensemble Model first we create two model using Random Forest and Decision Tree.
Then We Combine Both Model and create combined model. Here we use Logistic Regression as a meta classifier and we fitted this meta classifier with the combined model we first created.
Accuracy score: 0.836
Precision Recall F1 score support
0 0.78 0.84 0.81 25
1 0.88 0.83 0.86 36
Micro Avg 0.84 0.84 0.84 61
Macro Avg 0.83 0.84 0.83 61
Weighted Avg 0.84 0.84 0.84 61
T F
T 21 4
F 6 30
Logistic Regression
Random Forest Decision Tree
Table 4.39 Classification Report of Ensemble of Ensemble (Effective Heart Disease Prediction 1)
Table 4.40 Confusion Matrix of Ensemble of Ensemble (Effective Heart Disease Prediction 1)
4.2.21 Single Classifier (Effective Heart Disease Prediction 2)
This is our proposed model 2 for Effective heart disease prediction using machine learning. In this ensemble model first, we created Random Forest Model then we fitted the Random Forest model with AdaBoost after that we fitted this combined model into Bagging Classifier.
Accuracy score: 0.9344
Precision Recall F1 score support
0 0.92 0.92 0.92 25
1 0.94 0.94 0.94 36
Micro Avg 0.93 0.93 0.93 61
Macro Avg 0.93 0.93 0.93 61
Weighted Avg 0.93 0.93 0.93 61
T F
T 23 2
F 2 34
Bagging Classifier
Adaboost
Random Forest
Cross Validation (Average Accuracy): 0.8270 Accuracy SD: 0.0664
Table 4.41 Classification Report of Single Classifier (Effective Heart Disease Prediction 2)
Table 4.42 Confusion Matrix of Single Classifier (Effective Heart Disease Prediction 2)
Figure 4.20 ROC Curve Effective Heart Disease Prediction 2
Figure 5.1 Accuracy of all classifiers
4.3 Potential Future Improvement
The study shows that an automated system can be implemented in the clinical diagnosis of Heart Disease Prediction. With more training data and more efficient algorithm this can be a real-life implementation for clinical diagnosis in Bangladesh. Bangladesh medical system can accumulate more clinical data in an organized and structured way where each patient’s medical data can be secured which can be later be used in many different studies for other diseases and also incorporate with the existing system for automated classification and detection of those diseases.
4.4 Summary
It tends to be inferred that, AI and information mining system can assume an essential job in anticipating Cardiovascular sickness or Heart related malady. In this exploration work, among every one of the calculations a few calculations performed amazingly well like Naïve Bayes, Linear SVM, Logistic Regression, Random Forest utilizing Grid Search CV and troupes show like Bagging, Boosting and our very own two group demonstrate (Effective Heart Disease Prediction System 1, Effective Heart Disease Prediction System 2). There is still a great deal of extension to improve the general execution.
84%
87% 87%
90%
80%
87%
90%
87%
82%
87%
90%
81%
92%
80%
83%
85%
87%
89%
85%
81%
93%
70%
75%
80%
85%
90%
95%
CHAPTER 5
CONCLUSION AND FUTURE IMPLICATION
5.1 Summary of the Study
This section summarizes the results of our study. Figure 5.1 shows the accuracy obtained from the different models. It can be concluded that our proposed model 2(Effective heart disease prediction 1) gives the most desirable accuracy of 93.44%.
5.2 Conclusions
We observed that, we have used 21 different machine learning algorithms among which our proposed model 2 (Effective heart disease prediction 2) had the highest level of accuracy. Although the other algorithms provided very close and accurate result compared to our proposed model 2((Effective heart disease prediction 2)
5.3 Recommendations
Considering the study, it will give us more accuracy if we find more clinical data which are perfectly organized.
5.4 Implication for Further Study
For various other diseases we can use similar techniques and more data on other clinical health problems should be accumulated in order for similar studies. Further studies in the field required for achieving clinical accuracy and reliability.
Web based or android based application can be developed with permission and supervision from appropriate authorities for public usage of the platform
[1] World Health Organization Article at https://www.who.int/cardiovascular_diseases/en/
[2] B. L Deekshatulua Priti Chandra “Classification of Heart Disease Using K- Nearest Neighbor and Genetic Algorithm “M.Akhil jabbar* International Conference on Computational Intelligence: Modeling Techniques and Applications (CIMTA) 2013.
[3] Heart Disease prediction using Machine learning and Data Mining Technique By Jaymin Patel, Prof TejalUpadhyay, Dr. Samir Patel.
[4] Brac University Institutional Repository (Effectiveness of data mining in predicting heart diseases at http://dspace.bracu.ac.bd/xmlui/handle/10361/8915
[5] https://health.howstuffworks.com/diseases-conditions/cardiovascular/heart/heart- attack.htm
[6] Heart Disease Facts https://www.cdc.gov/heartdisease/facts.htm
[7] Bangladesh : Coronary Heart Disease https://www.worldlifeexpectancy.com/bangladesh- coronary-heart-disease
[8] According to a survey on Dhaka tribune at
https://www.dhakatribune.com/health/2018/10/02/3-out-of-4-bd-individuals-run-the-risk- of-developing-cardiac-diseases
[9] According to The Financial Express News at
https://thefinancialexpress.com.bd/health/three-out-of-four-bangladeshis-at-risk-of-heart- disease-1538398045
[10] Mayo Clinic https://www.mayoclinic.org/diseases-conditions/heart-disease/symptoms- causes/syc-20353118
[11] Medicine Net Article on heart disease definition at
https://www.medicinenet.com/script/main/art.asp?articlekey=31193
[12] Heart Disease prediction using Machine learning and Data Mining Technique by Jaymin Patel, Prof TejalUpadhyay, Dr. Samir Patel.
[13] Predicting and Diagnosing of Heart Disease Using Machine Learning Algorithms by Asst. Professor, Computer Science & Eng. Orissa Engineering College, Bhubaneswar, Odisha – India.
[14] Ashok Kumar Dwivedi, “Evaluate the performance of different machine learning techniques for prediction of heart disease using ten-fold cross-validation”, Springer, 17 September 2016
[15] Sujata Joshi and Mydhili K.Nair,”Prediction of Heart Disease Using Classification Based Data Mining Techniques”, Springer India 2015, volume2.
[16] Sellappan Palaniappan, RafiahAwang, "Intelligent Heart Disease Prediction System Using Data Mining Techniques", IJCSNS International Journal of Computer Science and Network Security, Vol.8 No.8, August 2008
[17] Shadab Adam Pattekari and Asma Parveen,” PREDICTION SYSTEM FOR HEART DISEASE USING NAIVE BAYES”,International Journal of Advanced Computer and Mathematical SciencesISSN 2230-9624. Vol 3, Issue 3, 2012, pp 290-294
April, 2019.
[19] Coursera, https://www.coursera.org/learn/machine-learning. [Online]. Last Accessed:
129 April, 2019.
[20] Introduction to machine learning, http://www.zarantech.com/blog/an-introduction-to- machine-learningwhy-it-matters.[Online] Last Accessed: 1 April 2019.
[21] UCI Machine Learning Repository, Available at http://archive.ics.uci.edu/ml/datasets/Heart+Disease