Submitted to Department of Civil Engineering, Bangladesh University of Engineering and Technology (BUET), Dhaka in partial fulfillment of requirements. Ach = Cross-sectional area of member measured up to transverse reinforcement.
Background
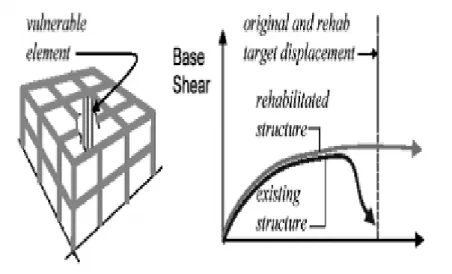
Structural failure should not occur at the columns as failure in this area makes the stability of the entire structure vulnerable and can lead to catastrophic failure of the structure. The ductility of the components with insufficient capacity is increased to meet their specific limit states in member-level retrofit.
Justification of the Study
Mukharjee and Joshi 2005 used FRP sheets to increase the shear and flexural strength of the beam. The result of the study will reveal the behavior of the reinforced RC interior beam-column joints and compare the behavior with the joints lacking shear reinforcement.
Objectives of the Study
Methodology
Scope of the Study
Organization of the Thesis
General
Ductility of the Structure
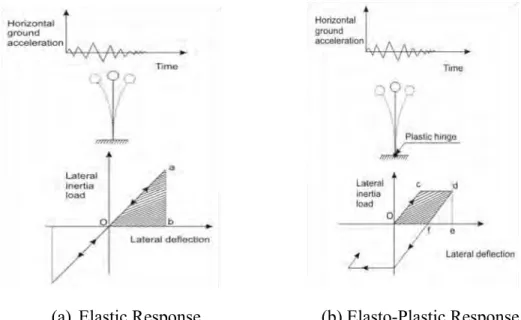
The displacement ductility factor μ, a measure of structural ductility, is defined as the ratio of Δu to Δy, where Δu and Δy are the corresponding lateral deflections at the end of the elastic region and when yielding is first achieved. In a similar way, the rotational ductility factor μ is defined as the ratio between θu and θy, where θu and θy are the corresponding rotations at the end of the elastic region and at the first yield point of the tensile steel.
Beam Column Joints
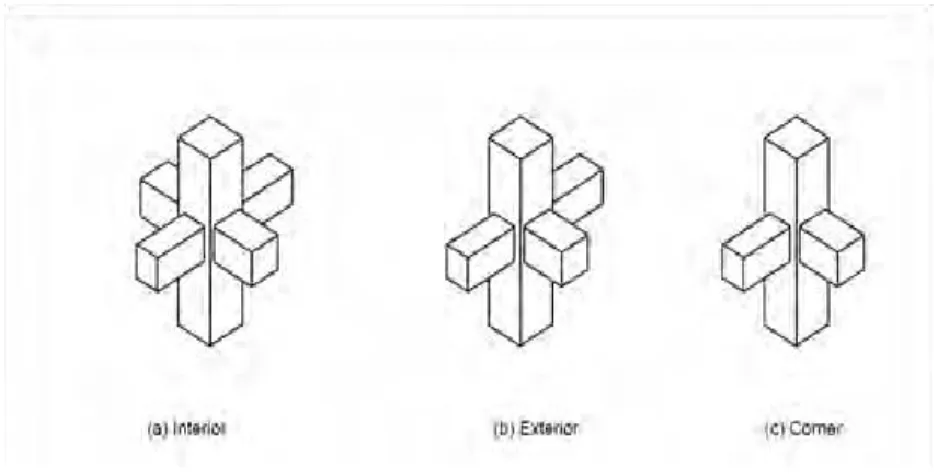
Classification of joints
The joints must be able to withstand the forces caused by the earthquake or cyclic loading. Since this research deals with the behavior of internal joints, the behavior of internal joints under cyclic loading is discussed.
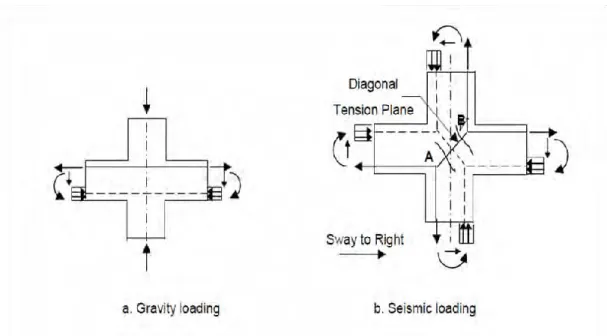
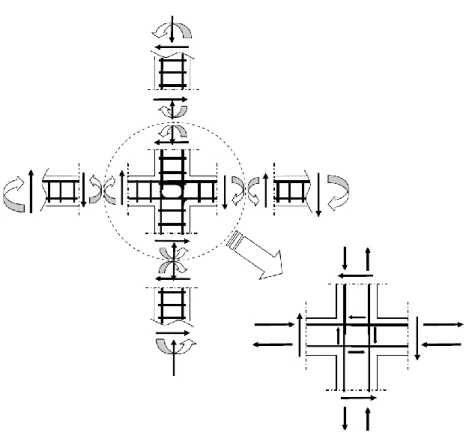
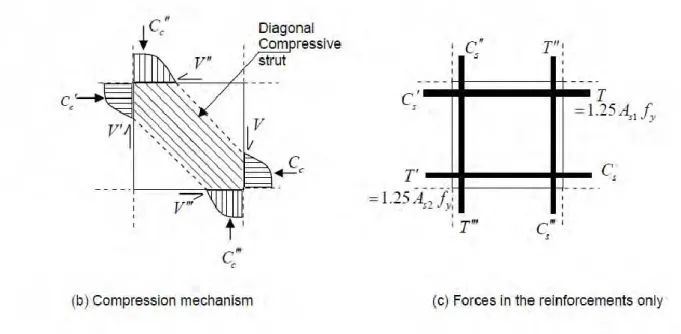
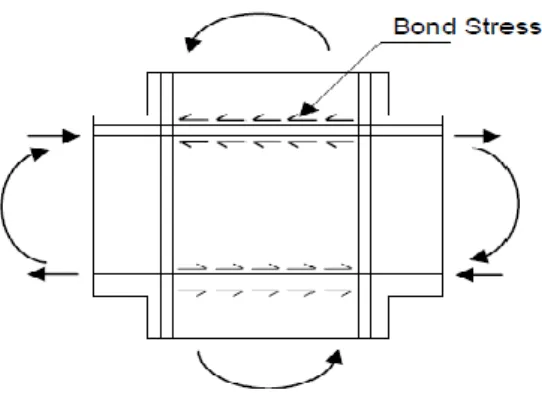
Forces acting on interior joints
A steep gradient of the moment causes large shear force within the beam compared to the adjacent columns. The effective shear area is specified based on the dimension of the beam and column (Nelson 1997, Uma and Prasad 2005).
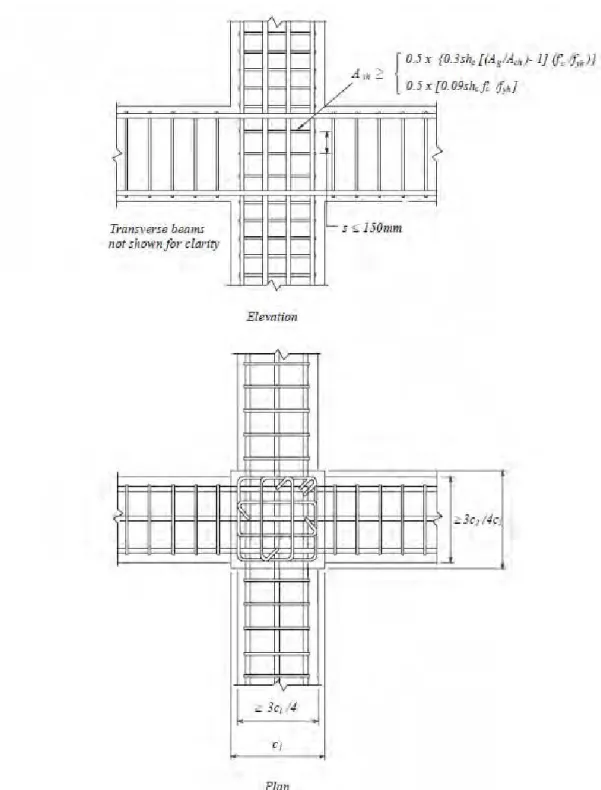
Requirement of Transverse Reinforcement for Joint
Horizontal hoop reinforcement should be designed for 40% of the total horizontal shear force as a minimum requirement (NZS 3101:1995). A joint is considered constrained if such constraining members frame in all planes of the joint.
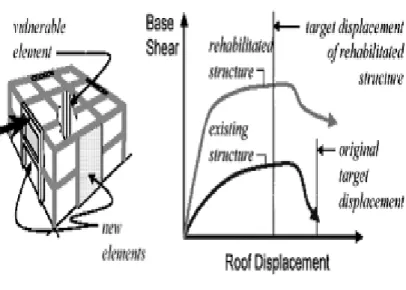
Retrofitting Strategy
Material Properties
Micro-Concrete
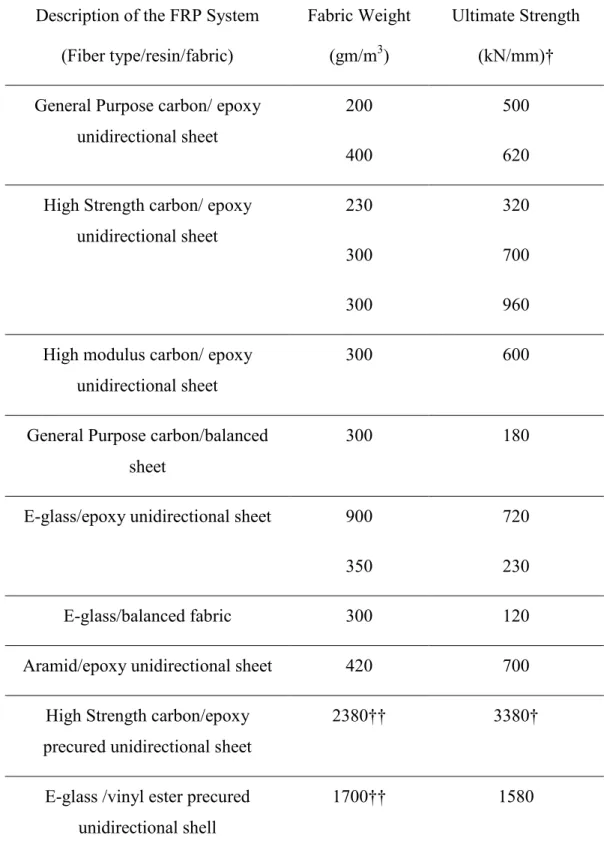
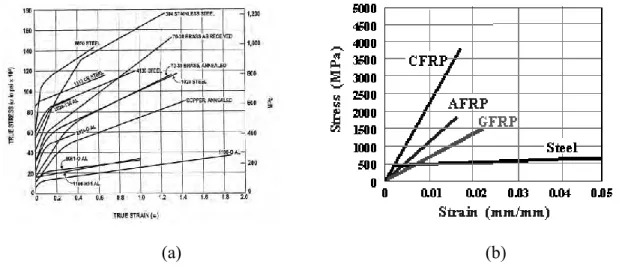
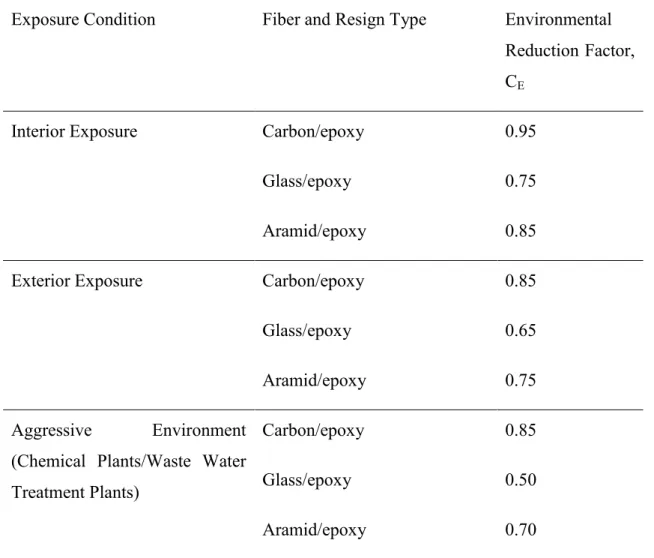
FRPs
Because of the primary role of the fibers and application methods, the properties of an FRP repair system are sometimes reported based on the mesh fiber area. Properties reported based on mesh fiber area are not bare fiber properties.
Guidelines for Use and Design of FRP Systems
Use of FRP system
The maximum service temperature of an FRP system must not exceed the Tg of the FRP system. Concrete distress, deterioration and corrosion of existing reinforcing steel must be evaluated and addressed prior to application of the FRP system. Design stresses in the FRP system are developed by deformation or dilation of the concrete section in contact critical applications.
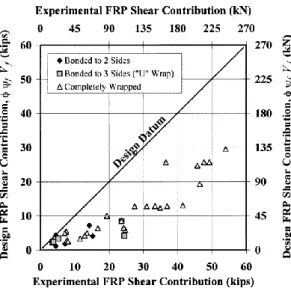
Design of FRP System for shear strengthening
The nominal shear strength of the FRP reinforced concrete element can be determined by adding the contribution of the reinforcing steel (stirrups, sleepers, spiral) and the concrete. The contribution of the FRP system to the shear strength of a member depends on the fiber orientation and the assumed crack pattern (khalifa et al. 1998). The effective strain is the maximum strain that can be achieved in the FRP system at the ultimate loading stage and is determined by the failure mode of the FRP system and of the reinforced reinforced concrete element.
Detailing of FRP system
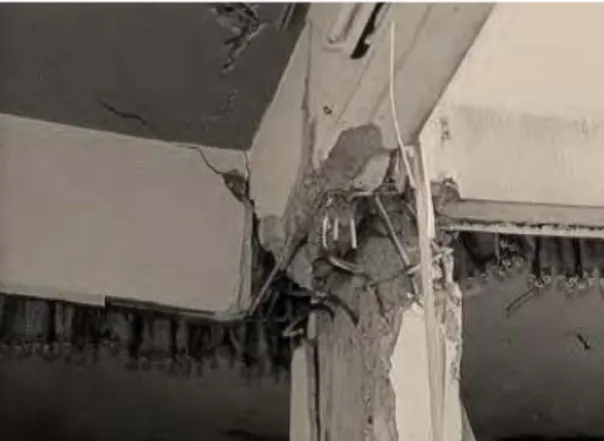
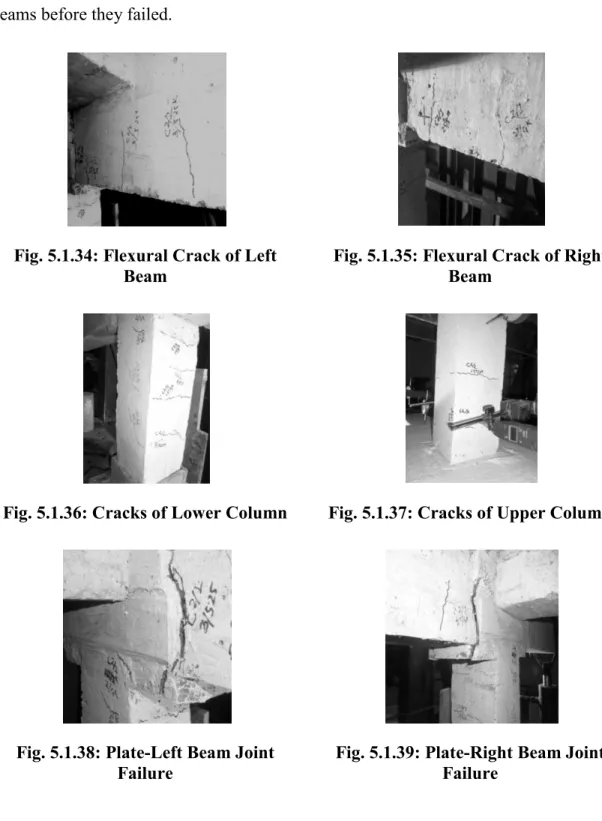
The right beam disintegrated at the front of the CFRP plate as shown in figure. The column shear was calculated based on the load applied to the tip of the beam. The rotational capacity of the connections can be increased by reinforcing the beam-column connections with CFRP plates.
Literature Review on Earlier Research
Pampanin et al. (2002)
Shiohara (2008)
Shiohara et al. (2010)
Joh et al. (2000)
Xiaobing et al. (2013)
Al-Salloum et al. (2007a)
Al-Salloum et al. (2007b)
The beam web in the joint core is deposited substantially at joint failure regardless of the amount of FRP. But the magnitude of the peak stress decreases with increasing FRP as shown in Fig. It caused increased stress and therefore the stresses of the column bars as column bars are not given.
Ilki et al. (2011)
It was clearly seen that the FRP application alone was not sufficient to prevent sliding of the longitudinal bars of the beam. However, after 4% drift, the shear damage in the joint caused a sharp decrease in the strength of the specimen. A simple procedure was used to calculate the contributions of concrete and FRP plates to the shear capacity of the joint using the truss analogy and Mohr's stress circle.
Mukharjee et al. (2002)
After exceeding the lateral loading capacity of the samples, the FRP strains increased with increasing drift ratios, and the strains on FRP plates in diagonal directions reached approximately 1.5%. The reduction in shear capacities of concrete and FRP as a function of the achieved drift ratio was taken into account, taking into account the damage of concrete and FRP in the joint. The main reason for the superior performance of reinforced FRP is the confinement of concrete by FRP wraps.
Pantelidies et al. (2000)
The damaged specimen was strengthened with FRP wraps and exhibited better performances in terms of ultimate load capacity, displacement under ultimate load, and energy dissipation energy. Non-ductile joints strengthened by FRP also showed better performance and their performance depends on the number of FRP wrapping layers.
Li Bing et al. (2011)
The repaired samples were tested again and their performance was compared with that of the control sample. The result showed that repairing damaged RC beam-wide column joints with FRP can restore the performance of the damaged joints.
Murshed and Ahmed (2011)
Summary of Literature Review
Many researchers have worked on strengthening the existing RC beam-column connections by FRPs of different types. The joint capacity can also be increased by FRPs as it increases the confinement and containment of the concrete.
General
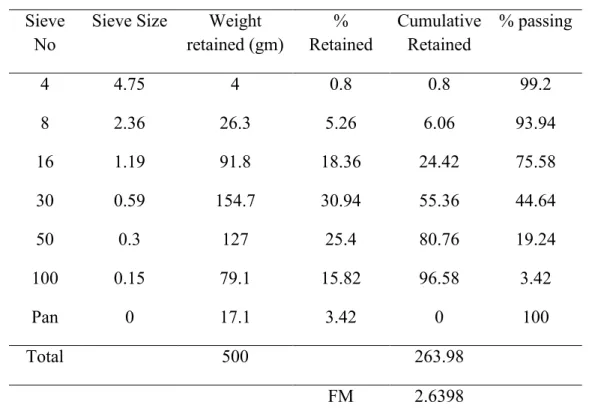
Sand
Sylhet Sand and local river sand were mixed in the ratio of 3:1 as is done in most construction works in Bangladesh. The absorptive capacity of the sand was 4%, but the moisture content varies greatly due to monsoon rains. The moisture content of the aggregates was measured before each batch and the water content of the fresh concrete was adjusted.
Coarse Aggregate
The FM of the two mixed sand batches was found to be 2.64 and 2.71, respectively, from their analysis. Coarse aggregates (brick chips) were made by crushing the first class bricks by hand and 10 mm bottom brick chips were collected for model preparation. Absorption capacity and moisture content of coarse aggregate affect the property of fresh concrete by changing the w/c ratio of cement.
Cement
First grade bricks with an average compressive strength of 26.29 MPa or 3810 psi were used to make brick chips.
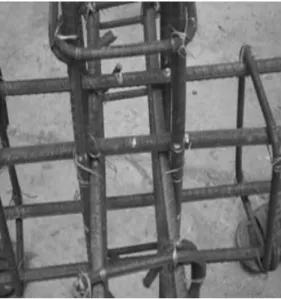
Reinforcement
FRP Fiber System
- CFRP Fabrics
- CFRP Fabric Primer
- CFRP Fabric Saturant
- Methods of Application of CFRP Fabrics
Concrete substrate must be free of oil residues, release agents, curing agents, grout holes and protrusions. If the substrate shows any damage due to corrosion, the substrate must be repaired before application of CFRP. Epoxy primer is applied with a brush over the prepared and cleaned surface and should be allowed to dry for approximately 24 hours before application of saturant.
CFRP Plate system
CFRP Plate
Thixotropic epoxy adhesive
Methods of Application of CFRP Plate
Micro-Concrete
General
Model Selection and Preparation
Details of Control and Test Models
The dimensions of the longitudinal beams were 150x225 mm, and the transverse ones 150x150 mm. The plate thickness was 75 mm with one layer of reinforcement in both X and Y directions. The cylinder test results are shown in Table 4.1.2. The concrete strength of the samples is shown in table 4.1.4. W/C ratio no. series. W/C ratio no.
Strengthening the Joints
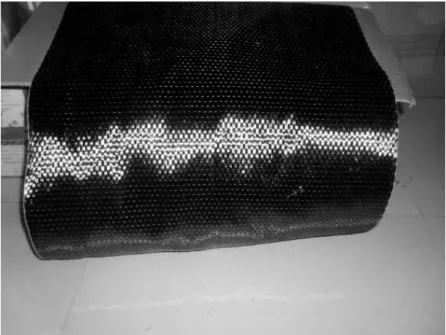
First Scheme: Strengthening joints by CFRP fabrics
The surface of the beams and columns was smoothed with a grinder and thoroughly cleaned with a brush before applying Primer. The beams had to be wrapped with CFRP fabrics in a U-shape up to 150 mm from the joint. The hardener and base (1:2 ratio) of saturator were mixed and applied over the primed surface.

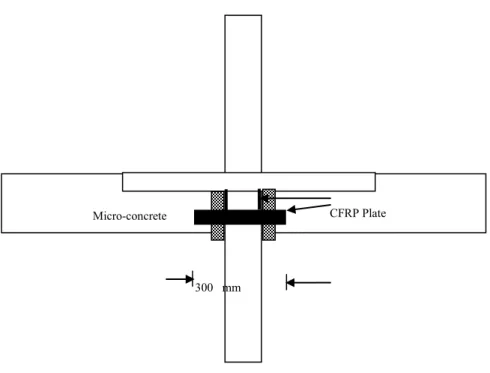
Second Scheme: Strengthening joints by CFRP Plates
The mixed adhesive was applied to the CFRP plates and pressed over the joint area to squeeze out the mixed adhesive. The joint concrete was replaced with micro concrete after three days of laying the slabs (Fig. 4.1.22). Two more CFRP slabs were placed after seven days of microconcrete casting (Fig. 4.1.23).
Third Scheme: Strengthening by Tie Bar and Micro-Concrete
Experimental Set Up
Load Selection
The samples were made from different batches of concrete as the strength of the concrete was different. To understand the behavior of all joints under identical conditions, 10% of the column capacity (0.1fc´Ag) is given as axial load. However, since the jacks were operated manually, the loading and unloading could not be kept at the same rate, which may affect the result due to the visco-elastic effect.
General
Test Set Up
Failure Pattern of Samples
Behavior of Con 1
Behavior of Plate 1
Behavior of MCS 1
Behavior of Fabrics 1
Behavior of Con 2
Behavior of Plate 2
Both the left and right beams were detached from the face of the CFRP slab and beams and eventually failed to transfer the load to the column. The cracks were deflected from the face of the CFRP plates towards the microconcrete joint as shown in Fig.
Behavior of Fabrics 2
Behavior of Fabrics 3
Diagonal cracking was noted in forward fourth cycle when the applied moment was 56 kN-m.
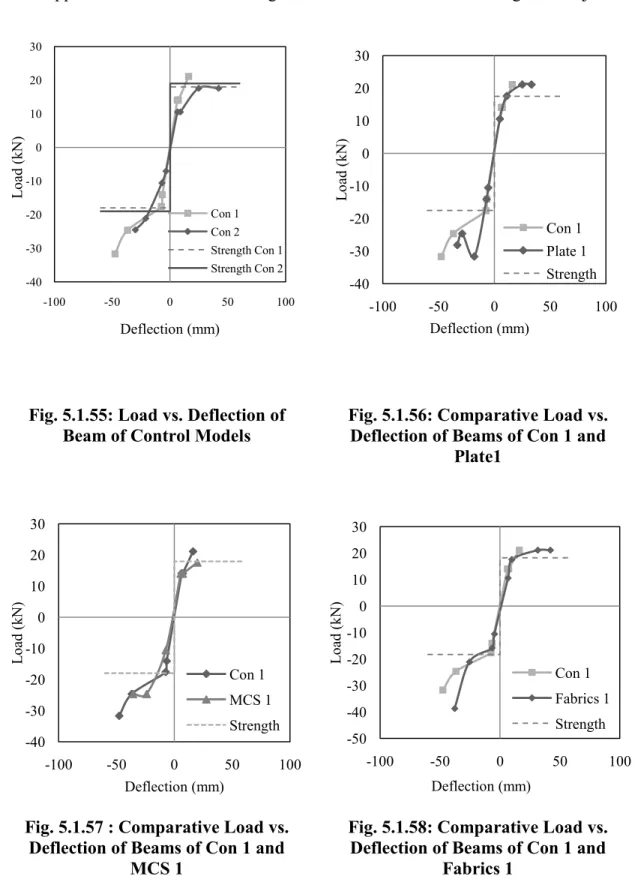
Load Deflection Response
Load deflection behavior of beam
In Group B, Panel Beam 2 deflected 73% with 86% load Con Beam 2 under forward loading, while it deflected 4% higher than the control beam with 80% excess. Fabric beam 2 deflected 96% with a 25% higher load than beam Con 2 when loaded forward and deflected the same amount with a 40% higher load when loaded backward. To estimate the stiffness of the beams, the slope of the forward load cycles is measured from the load-deflection curve of each cycle.
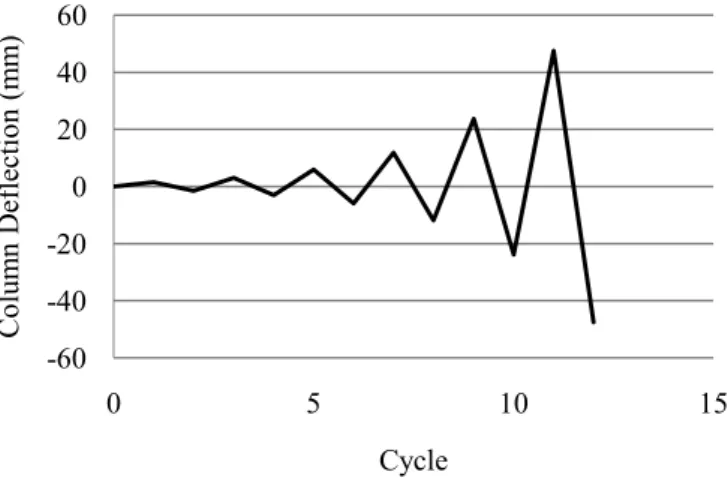
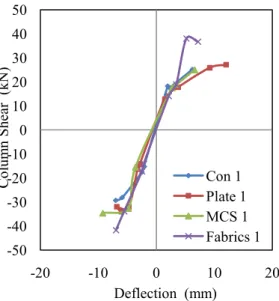
Load deflection behavior of column
Column of Tissues 1 experienced high column shear at the same deflection compared to the column of Con 1. Column of Plate 2 deflected 87% with 84 % loading of the column of Con 2 in forward loading cycle. It experienced 19% higher column shear force than that of Con 2 while deflecting only 48.6% of the Column of Con 2 in reverse loading.
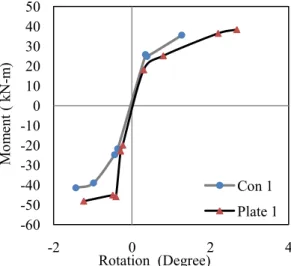
Load deflection behavior of joint
Joining fabric 2 rotated the same against 52.5% overload of the control joint in reverse cycle. The rotational stiffness of the joint of MCS 1 was less compared to the stiffness of the joint of Con 1. The rotational stiffness of the joint of Fabrics 3 is higher than the control joint considering the concrete strength for all cycles.
General
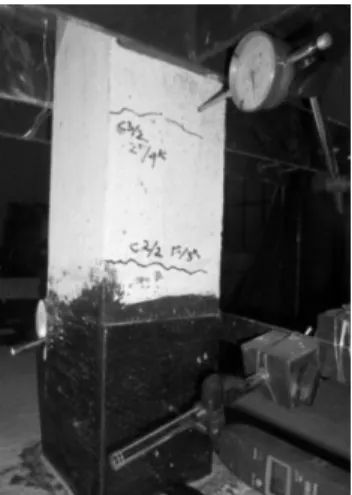
Joint rotations of the models were recorded by the computer with video extenso-meter against time. Load-deflection curves for beam and columns and M-Φ curves for columns and joints are plotted to study their behavior under cyclic loading. Each cycle of the load deflection and the M-Φ curve is analyzed to justify the behavior of the beams and columns in general and the internal joints in particular.
Conclusions
The moment capacity of the joints can be increased with additional connecting tape in the joint and microconcrete depending on the initial strength of the concrete. The reconstructed joint with microconcrete and additional tie bars underwent large deformations before failure exhibiting ductile joint behavior. The moment capacities of the joints strengthened by CFRP Fabrics were higher against the same rotations compared to the control specimens.
Recommendations for Further Study
Recommendations for the Design of Beam-Column Connections in Monolithic Reinforced Concrete Structures." ACI 352R-02, Farmington Hills, MI. Evaluation and Design Procedure for Seismic Retrofit of Reinforced Concrete Beam-Column Joints Using FRP Composite Materials. ASCE, Journal of Composites for Construction, Vol. Repair and strengthening of joints of reinforced concrete beams with fiber-reinforced polymer composites." Journal of Composites for Construction, ASCE, vol.
Plastic Yield Moment of Beam and Columns