In the current study, the soil-structure interaction is included in a previously developed Finite Element Model of the bridge. Time history analyzes using the Finite Element model of a single module of the bridge were performed considering the effect of soil-structure interaction and not considering it.
LIST OF TABLES
LIST OF NOTATION
LIST OF ABBREVIATIONS
CHAPTER!
INTRODUCTION
Objectives ofthe Study
This study covers the seismic response of Jamuna Bridge considering the effect of soil-structure interaction. A time history analysis is performed considering the same ground motion along the length of the bridge module.
LITERATURE REVIEW
- Structural Health Monitoring
- Soil-Structure Interaction
- Analysis of pile-soil-pile interaction
- Analysis of bridges considering soil-structure interaction
- Dynamic Analysis
- Mode superposition method
- Previous studies ou dynamic aualysis of bridges
- Effect of Scour Depth
- Summary
The response of the bridge model is then compared to the actual recorded response of the bridge. The aim was also to predict the response of the multi-purpose Jamuna Bridge to various earthquakes.
Chapter Three
BRIDGE PARAMETERS AND INSTRUMENTATION PLAN
Pile configuration
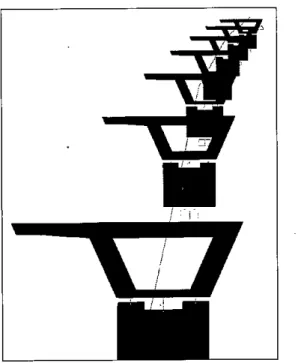
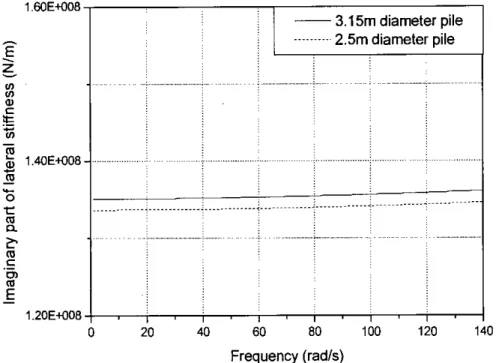
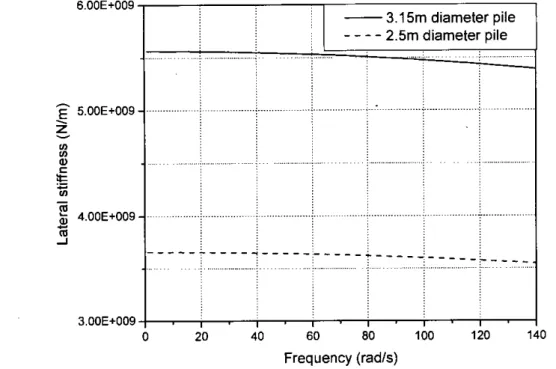
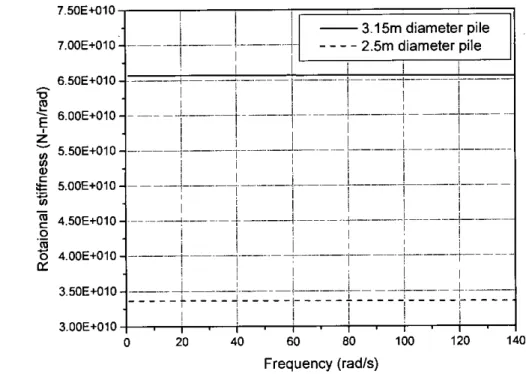
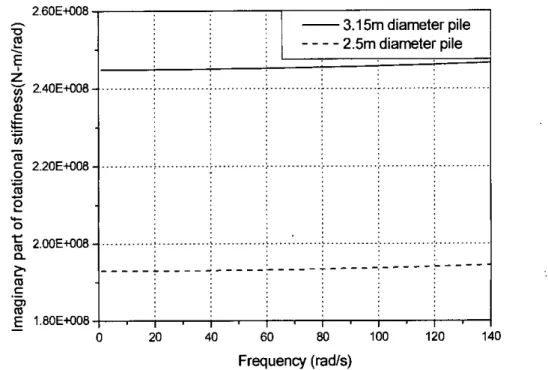
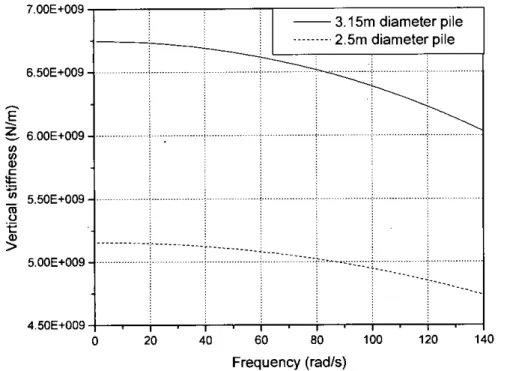
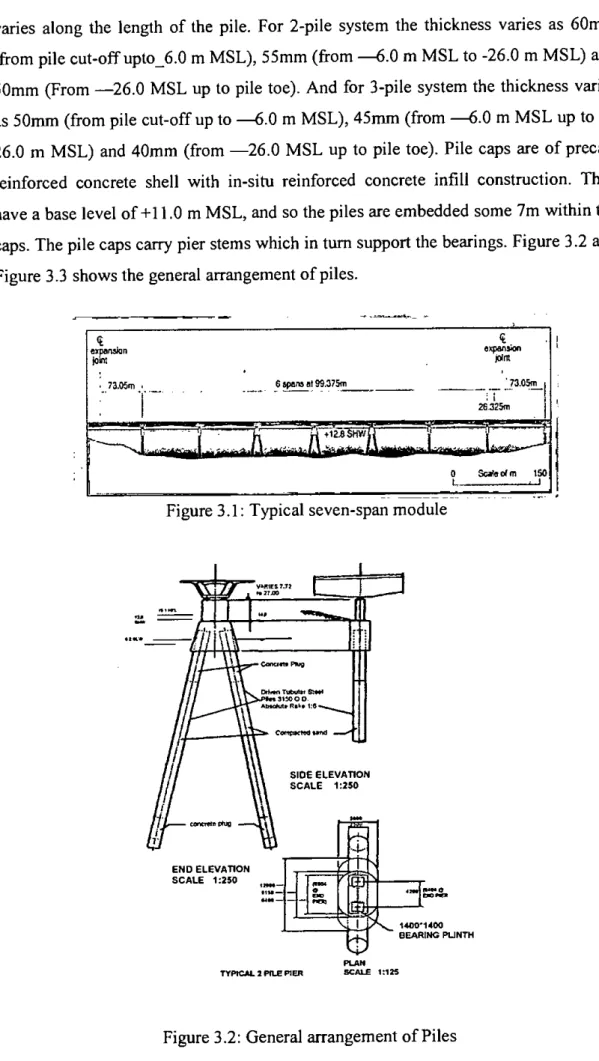
Each module of the bridge is supported on four pillars supported on 2-3.15 meter diameter piles and three pillars on 3-2.5 meter diameter piles, which are shown in Figure 3.1. The hollow part of the pier trunk is filled with concrete up to 3 m of its height.
I &.DD m
Isolation System
The middle part of each module has the fixed type, i.e. in these locations (at the 3-pile piers), there are multipin elastoplastic devices in which all horizontal movements except those occurring in very short duration are accommodated by the elastic deformation of the pin elements. The distribution of the loads is achieved because the shock absorber locks in the mobile locations and transfers the loads to the pin elements.
Seismicity of the Bridge Site
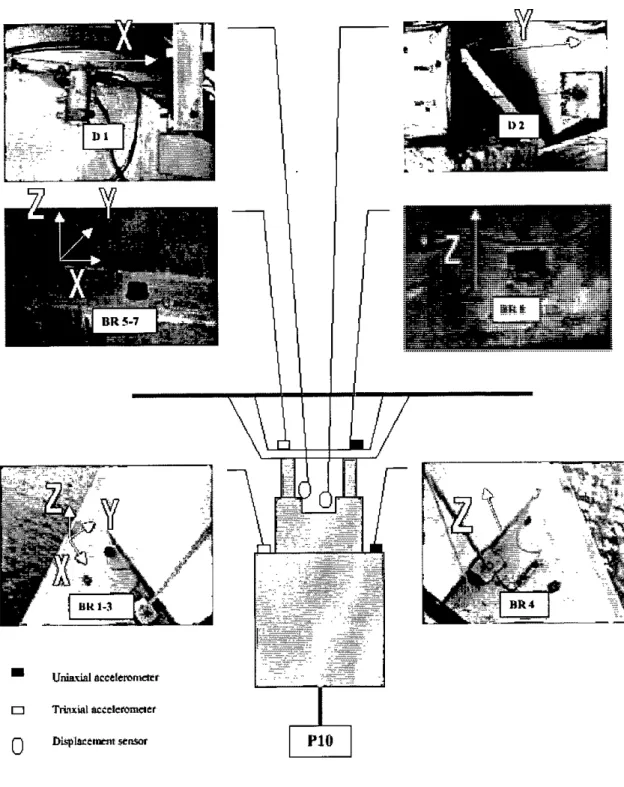
- Instrumentation plan
- Free-field stations
- Sensors
- Data transmission facilities
Note: X means orientation across the bridge (transverse direction) Y orientation parallel to the bridge (longitudinal direction) Z means vertical direction. Dedicated telephone line in the data control center required for transfer of data from the bridge.
Chapter Four
REVIEW OF SUPERSTRUCTURE MODELLING OF THE BRIDGE
- Bridge layout line
- Deck section
- Pier, diaphragm, exterior rail girder
- Bearing and restraint
- Lateral prestressing in the deck
- Different Models
The variation in the depth of the deck along its length was considered parabolic according to the actual condition. The variation in the width of the box girder along its length was considered parabolic according to the actual condition. The modules of the bridge have curvature in both horizontal and vertical directions, shown in Figure 4.2.
The studied part of the bridge is the second module from the west side, which is located on the vertical slope. One is located in the center of the pier and the other two are located on the edges, as shown in Figure 4.6. The pillar system is modeled with shell elements. Hollow parts at the top of the pillars are not taken into account.
Chapter Five
SOIL-STRUCTURE INTERACTION OF BRIDGE
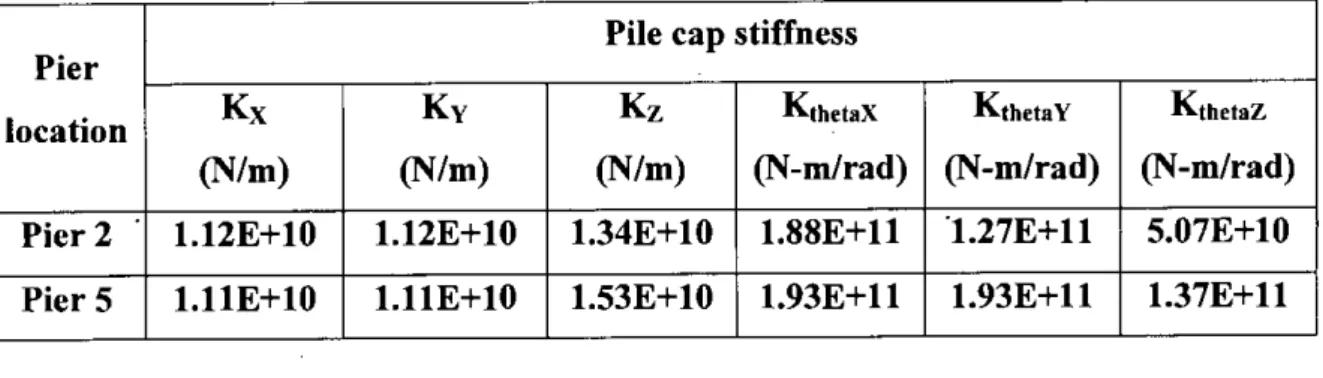
Pile cap stiffness
All the mode shapes of the fixed supported models are present in the models considering soil-structure interaction. The modal periods incorporated by soil-structure interaction in Model III are almost half of those in other models. Thus, incorporation of soil-structure interaction in dynamic analysis requires rigorous modeling as simplified models may change the dominant periods.
The first four modes are for the soil-structure interaction effect with higher modal periods, because SSI makes the whole structure less stiff. Thus, the modes corresponding to the effect of soil-structure interaction will be vulnerable in response to ground waves with higher modal periods. Therefore, the effect of soil-structure interaction can be significant due to distant earthquakes of larger magnitude (Kramer, . 1996).
Summary
Chapter Six
RESPONSE OF JAMUNA BRIDGE TO DIFFERENT SEISMIC EXCITATIONS
General
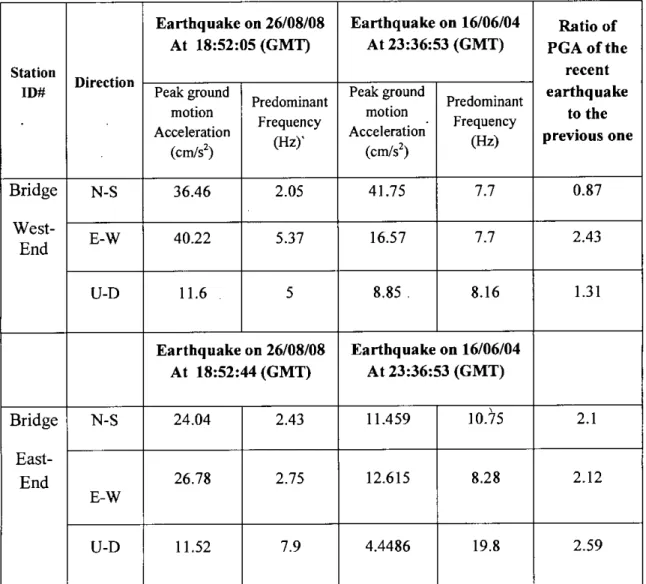
Earthquake Data
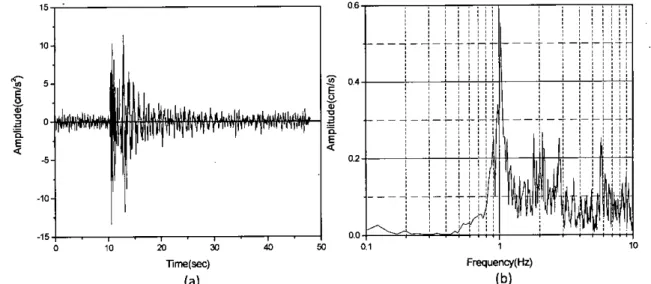
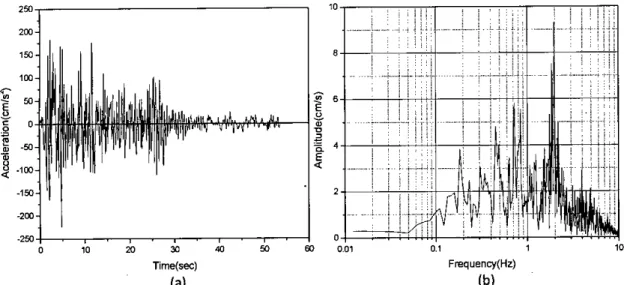
Figure 6_5: Ground motion on the west side of the bridge in the upward and downward directions of the 2008 Mymensingh earthquake, (a) acceleration, (b) FFT.
I III!
The peak acceleration (PA) is 13.37 cm/s2 and the dominant frequency of the excitation is 1.025 Hz. Figures 6.14 and 6.15 show the response of the bridge deck to the west side ground motion of the 2008 earthquake for considering and not considering soil-structure interaction respectively stimulated by time history analyses. Consideration of SSI produced the peak of 31.36 cm/s2, while consideration of fixed support produced 25.94 cm/s2 peak acceleration.
The fixed-supported model amplifies the signal more at lower frequencies compared to the SSI-based model. Figures 6.16 and 6.17 show the response of the bridge slab along the longitudinal direction to the ground motion at the eastern end of the 2008 earthquake considering and not considering the soil-structure interaction induced by the time history. 2008, which has a PA of 25.12 cm/s2• The FFT of the pilot cap motion has a clear peak at 1 Hz, which is similar to the motion recorded on board.
Discussion on the time-history analyses
The FEM response to the 2008 and 2004 earthquakes has been calculated using time-history analysis. The frequency content of the stimulated response in the transverse direction has been shown to correspond to the input movement. The corresponding frequency of mode 11 is 1.7 Hz, which is close to the dominant frequency derived from the responses of the FEM.
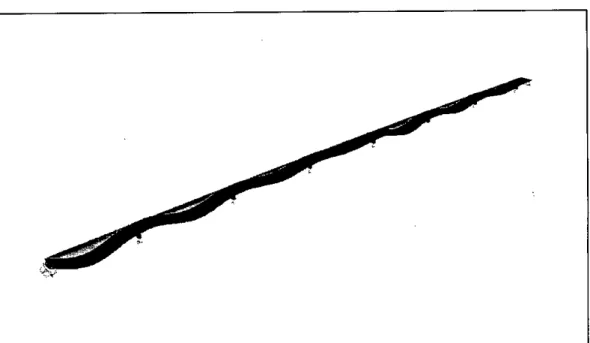
However, Piers start to move sequentially in the present case, as ground excitation propagates from one end to the other end of the bridge. Therefore, the sag and crest occur at alternate superstructure spacings, as shown in Figure 6.62, which is actually similar to the shape of mode 7 with modal frequency 1.001. This is why the FEM response is found to be different from the actual response.
Prediction of Bridge Response to the EI Centro Earthquake
- Comparison of the acceleration data of deck at PIO along longitudinal direction
- Comparison of the acceleration data of deck at PIO along up-down direction
Figures 6.67 and 6.68 show the response of the bridge deck in the transverse direction to the EI Centro earthquake taking into account and not taking into account soil-structure interaction respectively. Consideration of SSI causes peak acceleration of 341.5 cm/s2 with the dominant frequency of 7.13 Hz, while fixed support caused PGA of 342.5 cm/s2 with the same dominant frequency. Figures 6.70 and 6.71 show the response of the bridge deck along up-down direction to the EI Centro earthquake for the consideration and non-consideration of soil-structure interaction, respectively.
Considering SSI resulted in a peak acceleration of 175 cm/s2 with a dominant frequency of 2 Hz, while considering fixed support resulted in PGA.
Summary
In this study, the motion occurs on all girders at the same time, resulting in a bridge motion almost similar to the Form II mode with a dominant frequency of 2 Hz. Since the modal amplitudes of mode 7 are smaller compared to mode 11, the recorded PGA is smaller than the simulated one. Thus, consideration of non-simultaneous loads along with rigorous modeling of the superstructure and support condition is important to correctly simulate the seismic response of a bridge.
THE EFFECT OF DIFFERENT SCOUR DEPTHS ON DYNAMIC PROPERTIES OF THE BRIDGE
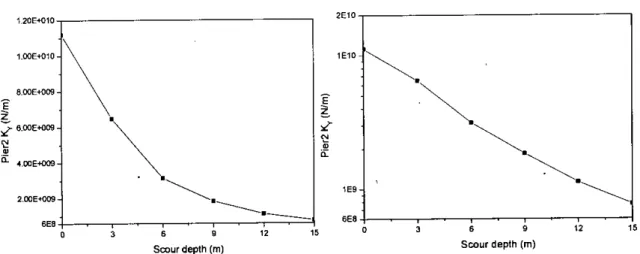
- Pattern of variation ofthe lateral stiffness of the pile cap with scour depth
- Effect in transverse direction
The vertical stiffness decreases and the rate of change of stiffness decreases with the increase of the abrasion depth. A significant change in pile stiffness was observed due to the scouring of the river bed, which causes change in the overall change in pile cap stiffness. The peak is reduced with the increase of the scour depth in the east-west direction (longitudinal direction of the bridge).
Acceleration peaks along the up-down direction of the simulated response of the FEM to the 2008 earthquake occur near I Hz, 2 Hz, 5 Hz and 8. The deviation in the dynamic behavior of the other modules due to the difference in scour depth is in this study observed. Peaks of acceleration of the responses in longitudinal and up-down direction are reduced due to increase in abrasion depth.
Chapter Eight
CONCLUSIONS AND RECOMMENDATIONS
Future Recommendation
The ends of the module have been considered as fixed vertically, which in real state is fixed with respect to the adjacent module. System Identification and Performance Evaluation of Two Base Isolated Bridges Using Seismic Data Vibration-Based Structural Health Monitoring of Highway Bridges, PhD Thesis, University of California, San Diego. Mullen, C.L, and Swann, C.T. Seismic Response Interaction of Subsurface Geology and Selected Facilities at the University of Mississippi."
University of Mississippi and Mississippi Mineral Resources Institute, http://www.sciencedirect.comlscience. 2008a), “Study on Dynamic Parameters of the Jamuna Multipurpose Bridge” M.Sc.thesis, Department of Civil Engineering, Bangladesh University of Engineering and Technology, Dhaka. 2008b), A study on the dynamic behavior of Jamuna multi-purpose bridge under different seismic and vehicular loads, M. Thesis, Department of Civil Engineering, Bangladesh University of Engineering and Technology. Fourth International Conference on Advances in Steel Structures, Proceedings of the Fourth International Conference on Advances in Steel Structures June 13-15, 2005, Shanghai, China 2005, pages 1241-1246.
APPENDIX A
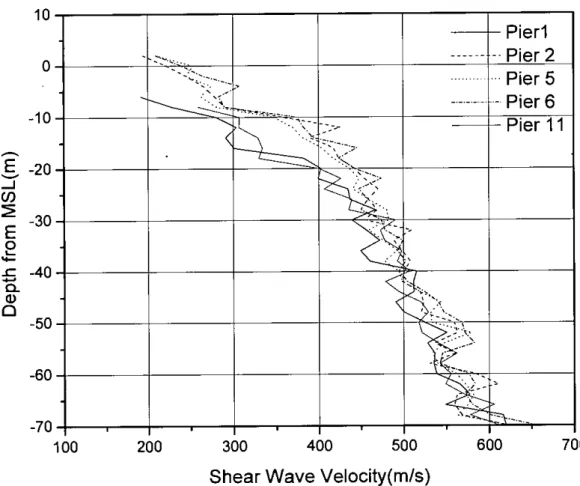
GEOTECHNICAL FIELD DATA
APPENDIXB
THIN LAYERED ELEMENT METHOD
The above equations are solved in the manner of an eigenvalue problem, and it is noted that Eq. 8.23), whose eigenvalues are denoted by /3, is completely independent of the mutually related Eqs. Thus, the force-displacement relationship must be obtained at the wall of the cylindrical cavity. Since the components of the displacement at the wall are proportional to the cosine or sine, the displacements are described in terms of (v, VB v,).
These displacement vectors are expressed in terms of the eigenvectors of the stratified soil as: where {X}a and {z}a are the interconnected eigenvectors corresponding to an eigenvalue a, and the eigenvector {f}p corresponds to an eigenvalue fJ. It is assumed that the cross-section of the cylindrical cavity is kept completely circular. Tractions (p, PeP J on the wall of the cylindrical cavity are expressed as: B.l3), one can describe the tractions in terms of the transformed displacements ~-If , ~+If and Was:.
The sublayer boundary forces are then obtained by multiplying Eqs. B.42)-(B.44) with the prescribed shape of displacement Nj and it is integrated over the entire thickness of the sublayer. The resulting force transformed displacement ratio is written in the following element matrix form as:. Assuming that the pile group behaves as a single vertical beam, the global stiffness matrix of the equivalent single beam is finally expressed as:.
The global equations of motion for the entire upright single beam are thus obtained as:. Finally, the equations of motion for the entire soil-foundation system are obtained by combining Eqs. According to the vertical column motions from Eq. B.53), movements at an arbitrary point. r, e) in the surrounding soil is obtained by solving the following equation: