Mahammad Abdul Baset, Assistant Professor, Department of Textile Engineering, Faculty of Engineering at Daffodil International University. We feel grateful to thank our respectable academic supervisor Mohammad Abdul Baset (Assistant Professor), Department of Textile Engineering, Daffodil International University. And also express gratitude to the Honorable Head of Department, Faculty Members and Staff of Textile Engineering Department of Daffodil International University.
We would also like to thank our entire coursemate at Daffodil International University who participated in this discussion while completing the course. In this article, we discussed a procedure about time, capacity, target, SMV and production study and analysis of various methods, and also discussed breaking down the operation and other tools and techniques, which consisted of various experimental discussions, experiment results and discussions about these analysis. be aware of the different items of SMV, production variation in terms of efficiency. Chart 4.1.1: Analysis of Capacity Diagram of different operations from Table 3.1.1 44 Chart 4.1.2: Analysis of SMV of different operations of Naomi Is Top Table 3.1.1 45 Chart 4.1.3: In terms of efficiency Target production analysis of Naomi is at the top Table 3.1.1 46 Graph 4.1.4: Differentiation between maximum and minimum SMV of different.
Chart-4.3.4: Difference between maximum and minimum SMV according to different operations Erik Basic Fit Tank Top. Graph-4.4.1: Performance Chart Analysis from Gabbi Tank Table-3.4.1 56 Graph-4.4.2: SMV Analysis from Various Operations Gabbi Tank Data 57 Graph-4.4.3: Efficiency Wise Target Production Analysis from Gabbi Tank .
Introduction
Nature of Work in Industrial Engineering
Objective of the Study
Importance of the Project
Scope of the Project
Definition of Industrial Engineering
Objective of Industrial Engineering
Activities of Industrial Engineering Department
Process flow chart of IE
Line Balancing
Line Efficiency
Standard Minutes Value (SMV)
- Factors consider of SVM Calculation
- SMV Calculation
- Operation Breakdown
- Bottleneck
Operation division is the special components each different style of the clothing to be completed. To make a garment, it is necessary to join or fasten different parts by using different types of sewing machines and necessary helpers to move the body, so it is special each operation, we called operation breakdown. The upper narrow part of a front is called the neck (opening side), and it is an obstacle to going from a large part of a bottle through the narrow part of a neck.
Pitch Time
Method Study
Flow Chart of Method Study in Garment Industry
Time Study
Target Setting
Rating
Work Dividing Plan of Naomi Is Top
- Data Table of Naomi Is Top
- Description
- Production Target, SMV and Pitch Time Calculation
- Labor Productivity and Efficiency Calculation
- Sewing Line Capacity Calculation
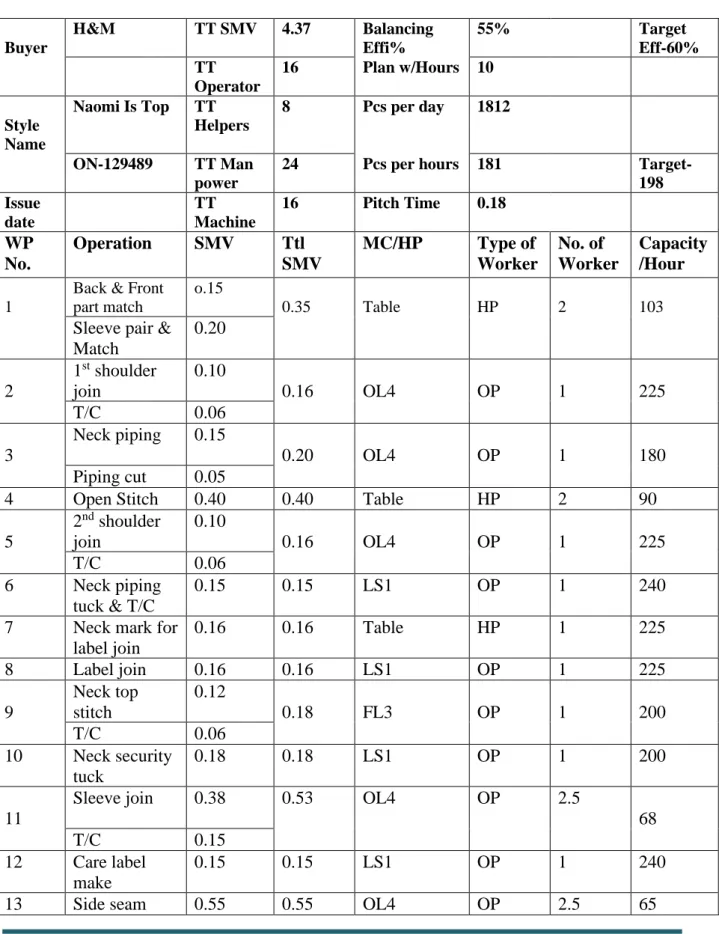
Above the operation breakdown data sheet for Naomi Is Top in the 65 count sewing line located in the Robintex group is the name of the buyer H&M. Accordingly, we calculated the assumed efficiency and 80% with the same SMV value to find out the target production calculation. Daffodil International University Page 16 From the data table, the balancing efficiency was only 55%, so let the efficiency be 55% and the target is reduced here.
The following calculation is given here only for back, front and sleeves fair match and other capacities calculated in the same way.
Work Dividing Plan of Tilly Solid
- Work Dividing Plan of Tilly Solid
- Description
- Production Target, SMV and Pitch Time Calculation
- Labor Productivity and Efficiency Calculation
- Sewing Line Capacity Calculation
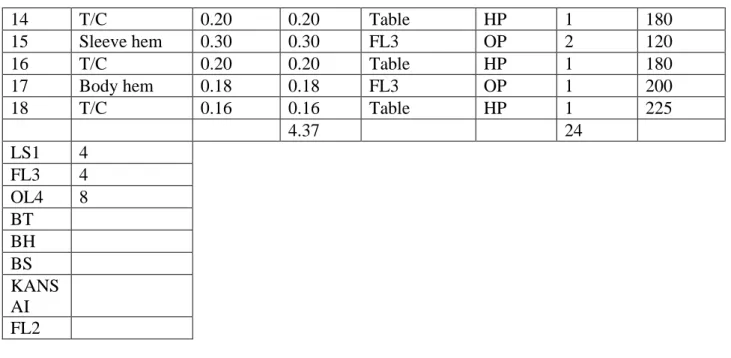
Located above the operation breakdown data sheet for Tilly Solid in 32nd number sewing line of the Robintex Group, the buyer name is H&M. Affodil International University Page 24 From data table the balancing efficiency got only 52% so leave the efficiency 52% and the target is lowered here.
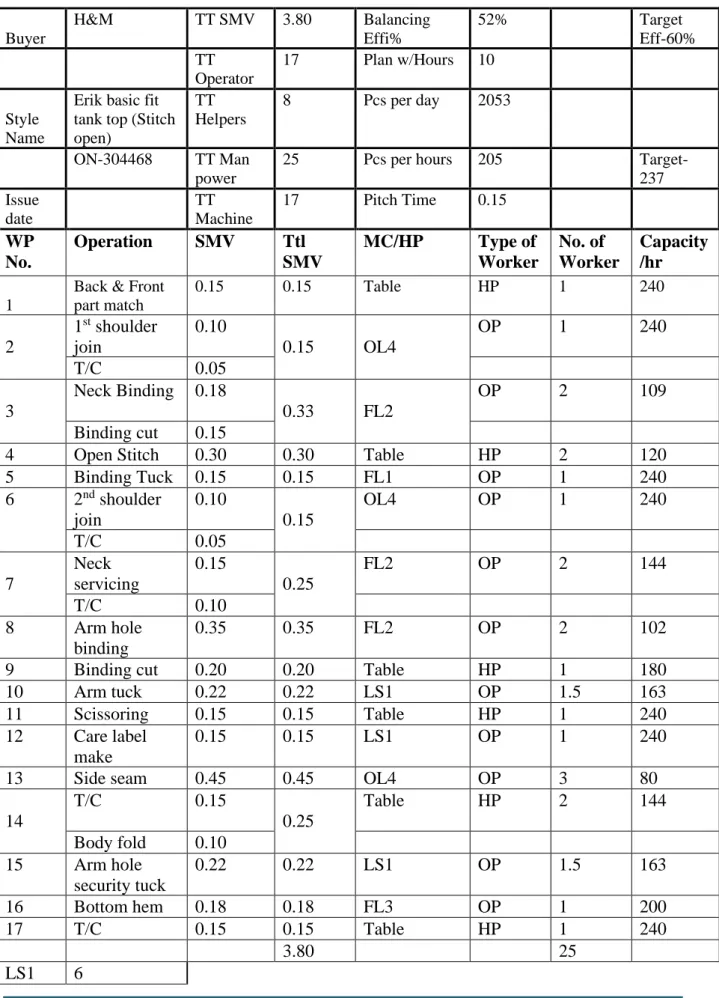
Work Dividing Plan of Erik Basic Fit Tank Top (Stitch Open)
- Work Dividing Plan of Erik Basic Tank Top
- Description
- Production Target, SMV and Pitch Time Calculation
- Labor Productivity and Efficiency Calculation
- Sewing Line Capacity Calculation
Above the operating data sheet for the Erik Basic Fit Tank Top (Stitch Open) in the 33 count sewing line located in the Robintex Group, the buyer's name is H&M. From the data table, the balancing efficiency got only 52%, so let the efficiency be 52% and the target is reduced here. Line efficiency = Total number of minutes produced ×100 total number of participants and total minute produced = line output × SME.
Work Dividing Plan of Gabbi Tank
- Description
- Production Target, SMV and Pitch Time Calculation
- Labor Productivity and Efficiency Calculation
- Sewing Line Capacity Calculation
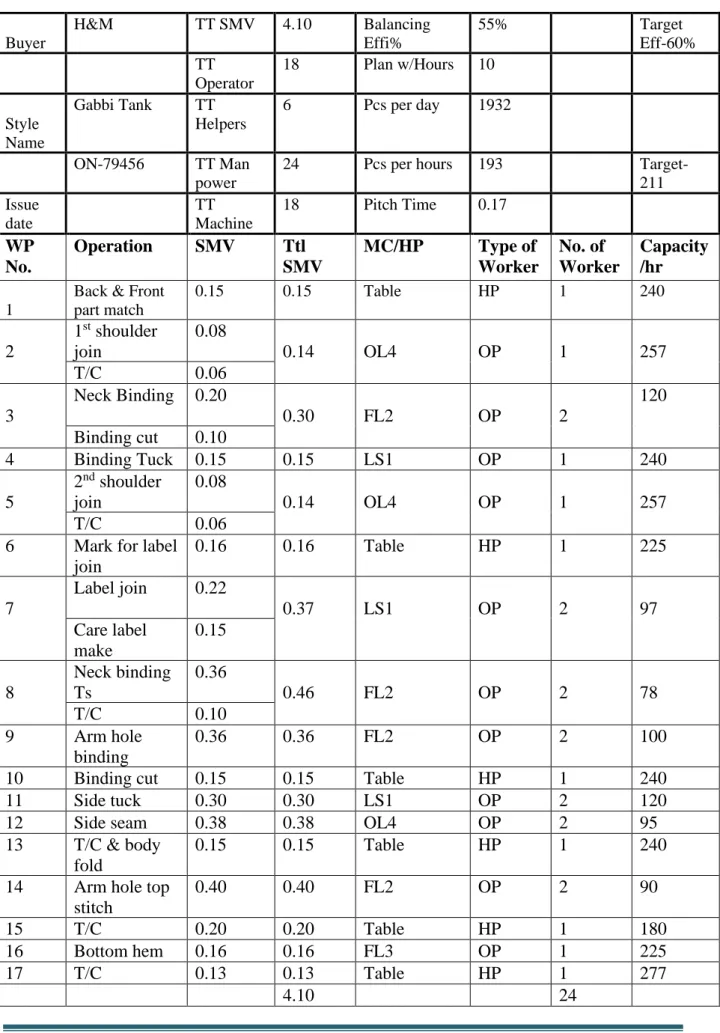
Above the operation breakdown data sheet for the Gabbi Tank in sewing line 48 located in the Robintex group is the name of the buyer H&M. From the data table, the balancing efficiency was only 55%, so let the efficiency be 55% and the target is reduced here. Observation Time = Total Cycle Time/Number of Cycle Times Here we would like to show only the SMV side seam operation.
Result Discussion and Analysis of Naomi Is Top From Data-3.1.1
- Description of the Capacity Diagram Chart
- Analysis of Standard Minute Value (SMV)
- Description
- Analysis of Efficiency Wise Production Target from Table-3.1.1
- Description
- Differentiation Between Maximum and Minimum SMV from Different Operation from
- Description
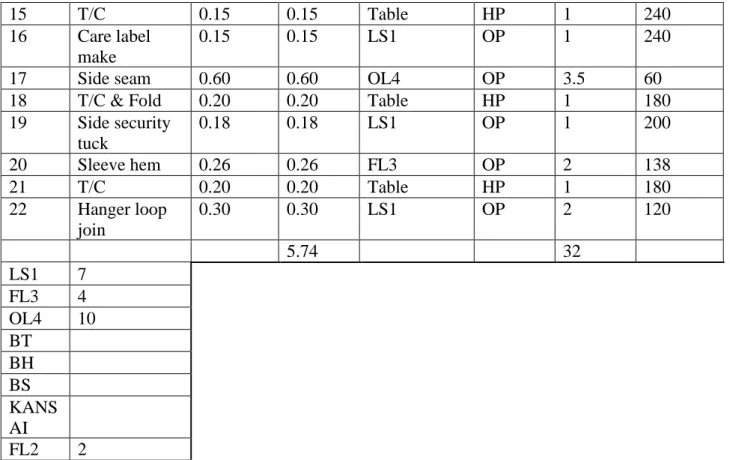
The SMV chart shows the different types of SMV values with different types of operation required to produce the Naomi Is Top garment. Here in the values shown by data-1 also present their highest and lowest values of SMV each different operation. So here the highest SMV values are 0.55 side seam operation and another set of neck tubes and T/C shows the lowest SMV value as 0.15.
This change in SMV value directly affects the production capacity, which can increase or decrease. If the total SMV value of the clothing style is less, the manufacturer has higher production, if the total SMV value of the clothing style is high, the manufacturer has lower production. Back, Front & Sleeves Match Fairly 1st Shoulder Joint & T/C Neck Trim & Neckline Open Seam 2nd Shoulder Joint & T/C Neck Trim & T/C Neck Mark Joint Mark Collar Top Neck Safety Flap Sleeve Joint & T/C Care manufacturer tag Side seam T/C Sleeve hem T/C Body hem T/C.
In the sewing line, the industrial engineers are given the daily, weekly and monthly production target according to their capacity and efficiency. Here the target output graph for efficiency shows how to increase output if there was higher efficiency and also shows how less output appears if efficiency is lower. So here the graph is from Naomi Is Top data oriented accordingly and 80% efficiency, showing the highest and lowest production target.
Affodil International University Page 47 4.1.4 Distinguish between maximum and minimum SMV from different operations from Data-3.1.1 of Data-3.1.1. Graph-4.1.4: Differentiation between Maximum and Minimum SMV of Different Operation of Naomi Is Top Table-3.1.1. Here we want to show the time of maximum and minimum of the SMV values of the different operations.
So here is the style of the garment total 18th operation to do and 7th operation took maximum SME to do this job and 11th operation took minimum SME which total SME is 4.37 including seven operations took 2.73 SME and other operations took 1.64 SME.
Analysis of Capacity Diagram Tilly Solid from Table-3.2.1
- Description of the Capacity Diagram Chart
- Analysis of SMV from Different Operation of Tilly Solid Data-3.2.1
- Description
- Analysis of Efficiency Wise Target Production Analysis from Tilly solid Data-3.2.1
- Description
- Analysis of Maximum & Minimum SMV from Different Tilly Solid Data-3.2.1
- Description
The SME chart showed the different types of SME values with different types of operations required for produced Tilly Solid garments. Here in the displayed values from data-2 also presents their highest and lowest values of SME every other operation. So here the highest SMEV value is 0.60 side seam operation and another care label shows lowest SMEV value as 0.15.
1st Shoulder Tuck & T/C Collar & Cut Open Stitch 2nd Shoulder Tuck & T/C Neck Piping Tuck & T/C Neck Etc Tuck & T/C Back Collar Tuck & T/C Neck Top Seam T/C Mark for Label Join Top with tape at back. Sleeve Join & T/C Body Seam T/C Care Tag Side Seam T/C & Fold Side Security Sleeve Edge T/C Hanger Join. Daffodil International University Page 50 4.2.3 Analysis of Efficiency Wise target production analysis from Tilly solid data-3.2.1.
So here the graph is from Tilly Solid data oriented accordingly and 80% efficiency showing the highest and lowest production target. Daffodil International University Page 51 4.2.4 Analysis of maximum and minimum SMV from different data Tilly Solid-3.2.1. So here the style of total 22 dressing operations is to perform finishing and 8 operations got maximum SMV to do this job and 14 operations got minimum SMV that total SMV is 5.74 including seven operations received 3.19 SMV and other operations received 1.64 SMV.
Analysis of Capacity Diagram Erik Basic Fit Tank Top from Data-3.3.1
- Description of the Capacity Diagram Chart
- Analysis of SMV from Different Operation Erik Basic Fit Tank Top Data-3.3.1
- Description
- Efficiency Wise Target Production Analysis from Erik Basic Fit Tank Top Data-3.3.1
- Description
- Analysis of Maximum & Minimum SMV from Different Operation Erik Basic Fit Tank
- Description
Daffodil International University Page 53 4.3.2 Analysis of SMV from different operations Erik Basic Fit Tank Top data - 3.3.1. The SMV diagram shows the different types of SMV values with different types of operations required to produce the Erik Basic Fit Tank Top garment. Here, the values shown from the data-3 also present their highest and lowest values of SMV in each different operation.
So here the highest SMV value is 0.45 in side seam operation and the second care label showed the lowest SMV value as 0.15. Back & Front Matching 1st Shoulder Tuck & T/C Neck Binding & Cutout Open Stitch Binding Tuck 2nd Shoulder & T/C Neck Repair & T/C Armhole Binding Binding Cutout Armhole Flap Scissoring Care label make Side seam T/C & Body fold Armhole safety tab Bottom hem T/C. Daffodil International University Page 54 4.3.3: Effective Target Production Analysis from Erik Basic Fit Tank Top Data.
So here's a chart from the Erik Basic Fit Tank Top data that is properly oriented and 80% efficient, showing the higher and lower production target. Daffodil International University Page 55 4.3.4 Analysis of Maximum and Minimum SMV from Different Operations Erik Basic Fit Tank Top Data-3.3.1 Tank Top Data-3.3.1. This pie chart is sourced from the data-3 Erik Basic Fit Tank Top.
So here is the garment style total 17 operations to complete and operation 6 required the highest SMV to do this job and operation 11 required the least SMV for a total SMV of 3.80 including six operations requiring 1, 93 SMV and other operations 1.87 SMV.
Analysis of Capacity Diagram Gabbi Tank from Table-3.4.1
- Description of the Capacity Diagram Chart
- Analysis of SMV from Different Operation of Gabbi Tank Data-3.4.1
- Description
- Analysis of Efficiency Wise Production Target Gabbi Tank Data-3.4.1
- Description
- Analysis of Maximum & Minimum SMV Different Operation from Gabbi Tank Data-3.4.1
- Description
The SMV chart shows the different types of SMV values with different types of operation required to produce the Gabbi Tank garment. Here in the values presented by data-4 also present their highest and lowest values of SMV each different operation. So here the highest value of SMV is 0.46 functioning of Ts & T/C connecting neck and another first joint of shoulder &.
Back, front match 1st shoulder joint & T/C Neck binding & cutting Binding snip 2nd shoulder joint & T/C Mark for back label joining Label joining & care label making Neck binding & T/C Armhole binding Binding cut Side snip Side seam T/C & body fold Armhole topstitch T/C Bottom hem T/C. So here is the graph of the Gabbi Tank data oriented accordingly and 80% efficiency indicating the higher and lower production target. Affodil International University Page 59 4.4.4 Analysis of Maximum & Minimum SMV Different Operation from Gabbi Tank Data-3.4.1 Data-3.4.1.
So here is the style of the garment total 17th operations to complete and 7th operations took maximum SMV to do this job and 10th operations took minimum SMV which is total SMV 4.10 including seven operations took 2.57 SMV and other operations took 1.53 SMV.
Analysis of Total Production from Different Style of Garments and SMV
Description
Conclusion