International Journal of Mechanical and Materials Engineering (IJMME), Vol.6 (2011), No.1, 92-101
EVALUATING CHARPY IMPACT SIGNALS USING POWER SPECTRUM DENSITIES:
A FINITE ELEMENT METHOD APPROACH
M.B. Ali, S. Abdullah, M.Z. Nuawi, A.K. Ariffin and M. Mohammad
Department of Mechanical and Materials Engineering, Faculty of Engineering and Built Environment Universiti Kebangsaan Malaysia, 43600 Bangi, Selangor, MALAYSIA
E-mail:[email protected]
Received 24 May 2010, Accepted 13 December 2010
ABSTRACT
Dynamic fracture properties of most engineering materials are generally assessed using the charpy test. The dynamic responses of the standard charpy impact machine are studied by running experiments using strain gauges and a specific data acquisition system in order to obtain the impact response and for this reason, the numerical analysis by means of the finite element method has been used to obtain the findings. In addition, the non-linear dynamic finite element is used for simulating the charpy impact test. The charpy test modelling was used in order to obtain the strain on the striker during the test. Two different velocities (5.18 m/s and 3.35 m/s) which are similar to the instrument charpy impact machine with the standard charpy modelling from the aluminium 6061 and low carbon steel 1050 as the rim material were used. A power spectrum density (PSD) is used to convert a signal from the time domain to the frequency domain using the fast Fourier transform (FFT) method. Related parameters of different materials, different velocities, energy absorbed, strain signals, PSD and the relationship between all the parameters were finally correlated and discussed. It was found that the modulus elasticity of materials and velocities were proportional to the energy absorbed, strain signals and PSD during the impact simulation.
Keywords: Charpy Impact, FEA, material, PSD, signal
1. INTRODUCTION
The Charpy V-Notch test was proposed more than a century ago. It is a standardised high strain-rate test that can measure the amount of energy absorbed in a material. The absorbed energy is considered as a measurement of the toughness of a given material and also acts as a tool to study the ductile-brittle transition of the material depending on the temperature during the testing procedure. With this impact test, one can evaluate the reliability of the structure basing on the measured energy absorption of the material (specimen) and understanding the deformation and failure process during the test (Jang et al., 2008).
Automotive industries increasingly seek to achieve higher quality levels for their vehicles. Vehicle components such as the parts of the engine, the suspension and the body structure are prerequisites that are able to withstand the increasing higher stress
(Abdullah et al., 2009). This study focuses on the alloy aluminium 6061 as the rim material because the rim system of the vehicle directly experiences the impact of the load when the vehicle is driven on the road. It is estimated that more than half the cars on the road today ride on alloy rims and the popularity of this wheel style is hard to top for a number of reasons, but there are some potential pitfalls to watch out when an alloy is selected.
The aluminium alloy 6061 is a heat treatable, wrought Al–Mg–Si alloy, in which magnesium and silicon are added either in balanced amounts to form quasi-binary Al–Mg2Si or with an excess of silicon needed to form
Mg2Si precipitate. This alloy also contains 0.2% Cr,
which provides an improved corrosion resistance. While the presence of the excess silicon improves age hardening response, it may however reduce the ductility and cause intergranular embrittlement, due to the segregation of excess silicon on the grain boundaries (Toh and Kanno, 2004; Jogi et al., 2008).
The wheel design and development departments conduct three main wheel tests (the rotating bending test, the radial fatigue test and the impact test) to test a prototype wheel for various fatigue and durability considerations. The impact test is established to evaluate the impact damage on the wheel when the wheel hits a curb (Chang & Yang, 2009). The velocities when a wheel hits a curb are variables that depend on the speed of the car. Two different velocities (v0 = 5.18 m/s and v0
= 3.35 m/s) that are similar to the instrument charpy impact machine need to be studied as a guideline research by using signal processing approach.
2009). From the literature the review, less study were impact signal responses with different velocities and materials, and analyzed the value using PSD.
In this study the dynamic-based Finite Element Analysis (FEA) is performed to simulate the standard charpy during the impact test. The FEA model consists of a striker, standard charpy aluminum 6061 and a low carbon steel 1050. A PSD is used to convert a signal from the time domain to the frequency domain using the fast Fourier transform (FFT) method. PSD is a normalized density plot describing the mean square amplitude of each sinusoidal wave with respect to its frequency and PSD is mathematically defined as the Fourier transform of its auto-correlation function (Abdullah et al., 2006). Finally, the relationship of different material, different velocities, energy absorbed and strain signal is investigated for the purpose of enhancing the impact knowledge distribution.
2. LITERATURE BACKGROUND
A simulation of wheel impact test using the finite element method was studied by Chang and Yang (2009). In this study a nonlinear dynamic finite element is used to simulate the SAE wheel impact test. The wheel is modelled as an elastic plastic body that is mounted at a 130 horizontal inclination, and the striker is prescribed as an initial velocity for a drop height simulation. Three dimensional finite element methods are employed in order to obtain the strain energy density of the wheel on the impact, and the critical strain energy density is based on the total plastic work of the material on the wheel. The finite element results show the total plastic work approach that can be used to predict the extent of the wheel fracture during the impact test.
The dynamic responses of the Standard Charpy Impact Machine were experimentally studied (Shterenlikth et al., 2005) using strain gauges and an accelerometer that is attached to the striker. The rotary position sensor is fixed at the rotating axis and it is numerically validated with with the accelerometer signal is different.
The Izod Impact Test is numerically analysed (Tvergaard & Needleman, 2008) using the polymer constitutes relation with the material parameter that is a qualitatively representative of a polycarbonate. The main purpose of this analysis is to compare the stress and strain fields that are developed for various geometric specimens that are used in practice, ranging from a specimen with a square cross section to a specimen with a width that is about a quarter of the value of the former specimen. The results illustrate the effect of the stress
strain behaviour of a polymer, which involves in attaining a stress peak, followed by a softening and then by a gradual evolution of a very stiff response which happens due to the increasing network stiffness.
An effect of the striker shape and the position of strain gauge on a measured load in an instrumented charpy impact test were studied by Toshiro et al. (2000). The strain gauges were attached to four positions in each striker. The instrumented charpy impact test was carried out using these strikers in order to investigate the effect of the gauge position on the actual impact load. By the finite element analysis, the effect of the strain gauge position on the measured load was also investigated. As the results indicate, it became clear that the accurate impact load was not measured around the end of the slit which was introduced to release the constraining effect of the deformation of the gauge position of the surrounding hammer. The effect of the vibration of the hammer appeared stronger at this position. It was however possible to prevent the effect of such vibration by attaching the gauge away from this position.
An experimental study was previously performed (Chen et al., 2009) on the dynamic fracture behaviour of extruded AA6xxx and AA7xxx aluminium alloys (either recrystallized or fibrous grain structure) using an instrumented charpy test. Two types of the charpy impact test were carried out and in the type one test the notch was parallel to the direction of the thickness of the profile, while in type two the notch was perpendicular to the direction of the thickness. In each type the longitudinal direction of the specimen was parallel, 450 and 900 to the extrusion direction. As the results indicate, the dissipated energy is practically invariant to the specimen orientation and direction of the notch for the recrystallized alloy but for the fibrous alloy the dissipated energy is lower when the longitudinal direction of the specimen is 900 towards the direction of the extrusion.
A dynamic fracture of linear medium density polyethylene under the impact loading conditions was studied by Martins et al. (2007). The three point bend impact experiments were conducted using a Modified Split Hopkinson Bar to better understand the correlation between impact velocity (from 1 to 7 m/s) and critical dynamic energy release rate at the crack initiation in the linear medium density polyethylene. The dynamic energy release rate at the crack initiation was determined from the force displacement history of the load obtained from measurements of input and reflected strain profiles on the incident bar. Extensive scanning electron microscopy was used to elucidate the micro and micro failure mechanisms operative during the dynamic fracture event. The result illustrates the dynamic energy release rate for the propagation of a crack where it is represented by the area under the falling part of the force displacement curves that pass the crack initiation point which is seen to increase as the velocity increases.
mechanical behaviour of the composite filament cylindrical vessel with a metal liner and without internal pressure and predict the damage distribution during and after the impact. A modified Hertzian Contact Law was used to calculate the contact force between the impact body and impacted cylindrical vessel. It was found that the damage styles and damage distributions of a typical vessel differ under different velocities. From these numerical results, it is clear that the impact damage extent for a composite filament wound vessel with an internal pressure is more severe than that without the internal pressure under a low velocity impact case with the same kinetic energy. It is also seen that the damage area also increases with an increase in the impact velocity.
Previously, the influence of some test parameters on the determination methods of a specimen loading in the instrumented charpy impact tests was studied (Landrein et al., 2001) and the analysis showed the influence of some test parameters on the impact load (including different velocities) and the specimen displacement measurements in the instrumented charpy impact tests and it was established that the initial impact velocity is the most important parameter in such tests. The initial speed was proportional to the amplitude of the first oscillation of the tup load time trace. The higher the initial impact speed, the higher would be the amplitude of the first oscillation and the maximum impact load was also found to be higher.
3. METHODOLOGIES
The material used for the analysis model is assumed to be isotropic, homogeneous, and temperature independent. The material of the impact specimen is aluminium 6061 and carbon steel 1050 and the properties for these materials are as tabulated in Table 1. They are selected due to the significant analysis of an alloy rim impact failure as stated in the problem statement and objectives. An alloy rim normally is assumed to be made of the aluminium 6061 material and the comparison with another steel material category such as carbon steel 1050 is needed to be carried out in order to indentify and analyse the impact failure analysis of the alloy. The striker of this impact is modelled as a charpy striker machine and its density was increased in order to make the striker equal to an actual instrumented charpy striker (for example 30.24kg.). The material properties that are used in the finite element model for both striker and charpy specimen are also listed in Table1.
Table 1 Material properties for striker, charpy specimen 1 and specimen 2
Comp. Material Young’s Modulus Density Poisson’s E (GPa) ρ (kg/m3) ratio, υ
Striker Steel 200 modified 0.32 Spec. 1 Alum. 6061 70 2.7 x 10³ 0.35 Spec. 2 Carbon steel 1050 200 7.86 x 10³ 0.32
Commercial ABACUS finite element analysis software was utilized in order to carry out the dynamic explicit analysis of the charpy impact test. The standard charpy impact specimen that is tested is with dimensions of 10 mm in depth, 10 mm in width and 55 mm in length (as required in the ASTM E23) and a striker modelling was used for the finite element analysis. In the finite element simulation, the mesh of the striker and the charpy impact specimen is mainly constructed by using the tetrahedral elements, this type of mesh was chosen due to the irregular geometry of the charpy impact specimen and the striker (Chang & Yang, 2009). The finite element results for the impact test are shown in Figure 1 and the mesh model data for Figure 1 are shown in Table 2.
Figure 1 FEA meshes and results for the charpy test specimen and the striker
Table 2 The data of striker and standard charpy meshes obtained from FEA
Component Element type Total element mesh Striker Tetrahedral 868
Std. charpy Tetrahedral 960
From the FEA, the total number mesh element 868 for the striker and 960 for the standard charpy were selected because the number of the mesh element when compared to the size of the charpy and striker is found to be suitable and adequate in order to obtain a good result. The three elements in the example element #837, element #835 and element #832 which are located in the striker is shown in Figure 1 and these were then used to obtain the significant strain signals and their simulated time histories as shown in Figures 6 to 11. These three elements (#837, #835 and #832) were selected because the results of the finite element obtained the maximum strain signal as compared to other elements. The position of the element is also closer to the centre of the impact location during the impact simulation.
The simulation symmetric constraints are also imposed on the symmetric plane of the model in order to determine the boundary and loading conditions. The boundary between the striker and the charpy specimen is then modelled as a contact boundary, for ensuring that the FEA procedure has been installed with at least a minimal contact between the striker and the charpy specimen during simulation. The striker was also modelled as a charpy striker machine and the Element 837, 835 and 832 Striker
Charpy specimen Stress
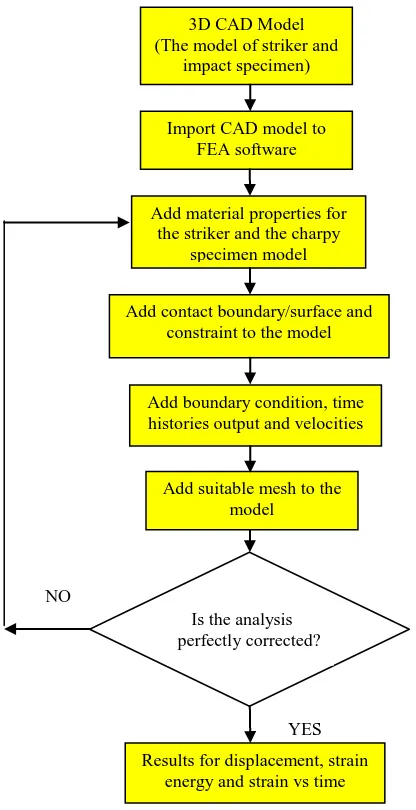
displacement of the striker is constrained to move in the parallel direction to the charpy impact model. At the beginning of simulation, the striker was located at 0.4 mm of the charpy specimen in order to provide a small gap of a zero amplitude before the striker begins to hit the charpy impact model. The block diagrams of the application of the FEA are illustrated in Figure 2.
Figure 2 The flow chart of finite element analysis
A PSD is a normalized density plot describing the mean square amplitude of each sinusoidal wave with respect to its frequency and it presents the vibration energy distribution of the signal across the frequency domain. The sample rate of every simulation in FEA was maintained at 50 kHz basing on the study by Shterenlikth et al. (2005) where the normalized peak of the PSD of the acceleration signal is about 15 kHz. 50 kHz was selected because it is of an appropriate data range where the normalised peak of the PSD always occurs within that range. From the studies of Timoshenko et al. (1974) it can be seen that the first natural frequency of a uniform beam is also calculated where the formula for aluminium is around 13 kHz. An instrument pendulum charpy impact machine as shown in Figure 3 has been used as a
guideline for this research and it has two types of impact velocity with a high latch of 5.18 m/s and a low latch of 3.35 m/s.
Figure 3 Pendulum impact apparatus for the experiment
The following discussion comprises several parameters that are used in the analysis of this paper.
A. Force, displacement and impact energy from strain The relevant equations are given below, based on the standard assumptions of one dimensional wave propagation of elastic waves. The experimental signals are processed using a home made computer programme, in which a correction for geometrical dispersion has been carried out (Rittel et al., 2002).
The load applied to the specimen is stated as:
F(t) = AE[εin(t) + εref(t)] (1)
where A and E are cross sections of the specimen and Young’s Modulus.
The displacement of the edge of the specimen is given as:
u(t) = co∫ εin(α) –εref(α)] dα (2)
where co is the longitudinal wave velocity.
Finally the impact energy applied on the specimen is stated as:
W = AcoE ∫
ε(α)
in 2–ε(α)
ref 2] dα
(3)
where tf refers to the fracture time
B. First natural frequency of the charpy sample
The first natural frequency of the charpy sample can be calculated using the solution proposed by Nash (1971) for a notched beam. For the standard charpy sample ASTM E23 with the span of the anvil, L = 40 mm, notch depth, a = 2 mm, and sample width, W = 10 mm (Charpy standard, 2006), the ratio of the first natural frequency of the notched beam, ω1, to the first natural frequency of the
uniform beam, ω01, is ω1/ω 0
1 = 0.912.
The first natural frequency of the uniform beam can be expressed as follows (Timoshenko et al., 1974);
ω0 1
√
(4)
Is the analysis perfectly corrected?
3D CAD Model (The model of striker and
impact specimen)
Import CAD model to FEA software
Add material properties for the striker and the charpy
specimen model
Add contact boundary/surface and constraint to the model
Add boundary condition, time histories output and velocities
Add suitable mesh to the model
Results for displacement, strain energy and strain vs time
Where ρ is the density of the material, E is the Young’s Modulus and I is the area moment of the inertia. For aluminium, E = 70 GPa , ρ = 2.71 x 10³ kg/m3,10 mm in width and 10 mm in depth. Thus the ω0
1 value for this
condition can be shown by the following calculation:
ω0
C. Impact loading of the specimen
The impact occurs when a large force builds up between two objects which strike one another in a short period of time. The ratio of the equivalent static load Pmax to the
load W is termed as the impact factor, n. This factor represents the magnification of the statically applied load so that it can be treated dynamically. Once the impact factor is determined, the dynamic stress and deflection can then be easily calculated from the static stress and the static deflection which are caused by the load W. The dynamic deflection and stress can be calculated by using the following formula (Hibbeler, 2008).
Dynamic deflection equation Δ max= n Δ st (5)
The deflection caused by an equivalent static load Pmax,
can be determined from Pmax= k Δ max = (48EI/L degree of freedom mechanical system with damping can be obtained with the method of the equivalent linear system where its natural frequency is a random variable. The PSD matrix function of the non linear response is defined as the PSD of the stationary response of the equivalent linear system. This approach involves complicated numerical analysis when solving problems of the non linear eigen value (non linear modes of vibration) (Shterenlikht et al., 2005, Saidur et al. 2008). The autocorrelation function and power spectrum have similar measurements in the domain time and frequency. Both these functions can be related to the Fourier Transform Function. The power spectrum density can be
calculated using the following formula (Shiavi, 1999; Nuawi, 2007):
Pxx (
∫ xx ( e -jωtd
(10)
and the relationship between the autocorrelation functions is given as:
rxx( ∫ (t) x(t- ) dt (11)
The autocorrelation function is usually an even function for while the power spectrum function is usually an even function of ω. The imagination parts e-jω and ejω are not considered in the integration procedure for every function and this integration can be stated as:
Pxx ( ∫ xx ( kos(ω ) d
Where vo is the measured initial impact velocity and P is
the impact load measured on the tup. The impactor mass m is considered as a point of mass striking the specimen with an initial impact velocity vo.
4. RESULTS AND DISCUSSION
4.1 Displacement and strain/internal energy
The finite element results for the displacement of the striker for both materials are shown in Figure 4. The displacement of the striker during the impact simulation for both materials with a velocity of 5.18 m/s is higher if compared to the velocity of 3.35 m/s for a time span of two milliseconds. The finite element results show that for a time span of two milliseconds, the displacement of the striker is around 10.2 mm for 5.18 m/s and 6.7 mm for 3.35 m/s speed. The FEA results indicate that it is approximately similar to the theory, where the velocity is proportional to the displacement by maintaining the time constraint.
5.18 m/s when compared to the velocity of 3.35 m/s. The total strain energy for steel for both velocities exceeds the strain energy of the aluminium material.
Figure 4 Displacement of the striker for both materials
(a)
(b)
Figure 5 Strain energy versus time with different velocity: (a) steel (b) aluminium
This show that the strain/internal energy for the striker during the impact simulation for steel is higher than that of aluminium. Results of the charpy experiments also indicate that the energy which is absorbed from the steel specimen is more than the energy absorbed by the aluminium specimen when both these specimens are observed at room temperature.
4.2 Strain rate versus time and PSD
The results of the simulation of strain rate versus time of velocity at 5.18 m/s are shown in Figures 6 to 8. The
strain rate of the element 837 and the corresponding PSD are shown in Figure 6. The first dominant PSD peak is approximately at 19 kHz for steel but when compared to the PSD of the aluminium the first dominant is only at 3.8 kHz. For other elements (835 and 832) the first dominant PSD peak is approximately at 19 kHz for steel when compared to 3.8 kHz for aluminium element 832 and 20.0 kHz element 835. The second PSD peak for all elements is approximately at 22.5 kHz for steel while for the aluminium it is only at 18.2 kHz for element 837, 18.3 kHz for element 835 and 18.2 kHz for element 832. From the finite element results of the velocity at 5.18 m/s the PSD frequency peak (first and second peak) for steel is higher than the one for the aluminium. This is because during the impact simulation, when the striker hits the steel, the strain signal and vibration of the striker is higher when compared to that of the aluminium. This happens as steel has a higher strain/internal energy than aluminium, so it is tougher than aluminium.
(a)
(b)
Figure 6 The simulated time histories and PSD plot for element 837 (a)simulated time histories (b) PSD
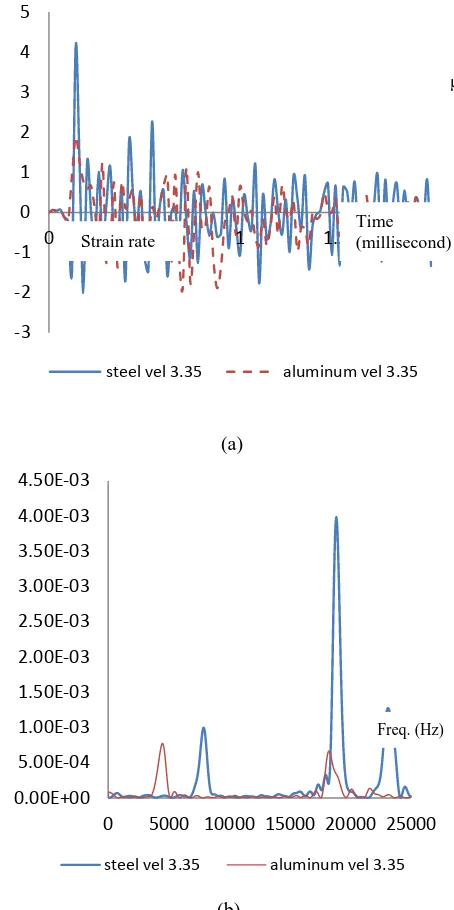
The results of the simulation of the strain rate versus the time of velocity at 3.35 m/sare shown in Figures 9 to 11. The strain rate of the element 837 and the corresponding PSD is shown in Figure 9. The first dominant PSD peak is at approximately 19 kHz for steel but the PSD of aluminium is only at 18 kHz for the first dominant. For other elements (835 and 832) the first dominant PSD -12
-10 -8 -6 -4 -2 0
0 0.5 1 1.5 2
velocity 5.18 velocity 3.35
0 2E+09 4E+09 6E+09 8E+09 1E+10
0 0.5 1 1.5 2
steel vel 5.18 steel vel 3.35
0 1E+09 2E+09
0 0.5 1 1.5 2
alum vel 5.18 alum vel 3.35
-8 -6 -4 -2 0 2 4 6
0 0.5 1 1.5 2
steel vel 5.18 aluminum vel 5.18
0.00E+00 5.00E-04 1.00E-03 1.50E-03 2.00E-03 2.50E-03 3.00E-03
-5000 5000 15000 25000
steel vel 5.18 aluminum vel 5.18
Displacement
Time (ms)
Strain energy
Time (ms) Strain
energy Time
(ms)
Time (millisecond)
Strain rate
με2
/Hz
peak is approximately at 19 kHz for steel while for aluminium it is only at 4.3 kHz for the element 835 and 18 kHz for the element 832.
(a)
(b)
Figure 7: The simulated time histories and PSD plot for element 835 (a)simulated time histories (b) PSD
(a)
(b)
Figure 8 The simulated time histories and PSD plot for element 832 (a)simulated time histories (b) PSD
(a)
(b)
Figure 9 The simulated time histories and PSD plot for element 837 (a)simulated time histories (b) PSD -6
-4 -2 0 2 4 6
0 0.5 1 1.5 2
steel vel 5.18 aluminum vel 5.18
0.00E+00 1.00E-03 2.00E-03 3.00E-03 4.00E-03 5.00E-03
0 5000 10000 15000 20000 25000
steel vel 5.18 aluminum vel 5.18
-8 -6 -4 -2 0 2 4 6
0 0.5 1 1.5 2
steel vel 5.18 aluminum vel 5.18
0.00E+00 5.00E-04 1.00E-03 1.50E-03 2.00E-03 2.50E-03 3.00E-03
0 5000 10000 15000 20000 25000
steel velocity 5.18 aluminum velocity 5.18
-3 -2 -1 0 1 2 3 4 5
0 0.5 1 1.5 2
steel vel 3.35 aluminum vel 3.35
0.00E+00 2.00E-04 4.00E-04 6.00E-04 8.00E-04 1.00E-03 1.20E-03 1.40E-03 1.60E-03
0 5000 10000 15000 20000 25000
steel vel 3.35 aluminum vel 3.35
Time (millisecond)
Strain rate
με2
/Hz
Freq. (Hz)
με2
/Hz
Freq. (Hz)
Strain rate
Time (millisecond)
(a)
(b)
Figure 10 The simulated time histories and PSD plot for element 835 (a)simulated time histories (b) PSD
(a)
(b)
Figure 11 The simulated time histories and PSD plot for element 832 (a)simulated time histories (b) PSD
The results of the PSD for all elements of steel and aluminium materials are shown in Figures 12 and 13. For the velocity of 5.18 m/s the first dominant PSD peak is approximately at 19 kHz for the steel material and the second PSD peak is approximately at 22.5 kHz. The graph patterns for all elements are seen to be similar and uniform. For the aluminium material, the first PSD peak is approximately at 18-20 kHz for the element 835 and 3.8 kHz for the elements 837 and 832. The second PSD peak is approximately at 3.8 kHz for the element 835 and 18-20 kHz for elements 837 and 832. The graph patterns for all the elements appear not to be very uniform as compared to the graph pattern of the steel material. The maximum PSD (με2/Hz) for steel is higher and it is approximately 4.6 x 10⁻³ με2/Hz as compared to aluminium which is only approximately at 1.2 x 10⁻³ με2/Hz. The second PSD (με2/Hz) for steel is also higher
and is approximately 3.4 x 10⁻³ με2/Hz as compared to aluminium which is approximately only at 9.7 x 10⁻⁴ με2/Hz.
(a) -3
-2 -1 0 1 2 3 4 5
0 0.5 1 1.5 2
steel vel 3.35 aluminum vel 3.35
0.00E+00 5.00E-04 1.00E-03 1.50E-03 2.00E-03 2.50E-03 3.00E-03 3.50E-03 4.00E-03 4.50E-03
0 5000 10000 15000 20000 25000
steel vel 3.35 aluminum vel 3.35
-3 -2 -1 0 1 2 3 4 5
0 0.5 1 1.5 2
steel vel 3.35 aluminum vel 3.35
0.00E+00 5.00E-04 1.00E-03 1.50E-03
0 5000 10000 15000 20000 25000
steel vel 3.35 aluminum vel 3.35
0.00E+00 1.00E-03 2.00E-03 3.00E-03 4.00E-03 5.00E-03
0 5000 10000 15000 20000 25000
elem 837 vel 5.18 elem 835 vel 5.18
elem 832 vel 5.18 Strain rate
Time (millisecond) Strain rate
Time (millisecond)
με2
/Hz
Freq. (Hz)
με2
/Hz
Freq. (Hz)
με2/Hz
(b)
Figure 12: The simulated time histories and PSD with velocity 5.18 m/s (a) steel (b) aluminium
(a)
(b)
Figure 13: The simulated time histories and PSD with velocity 3.35 m/s. (a) steel (b) aluminium
For the velocity of 3.35m/s, the first dominant PSD peak is approximately at 19 kHz for steel material and the second PSD peak is approximately at 23.0 kHz. The graph patterns for all elements are similar and uniform. For the aluminium material the first PSD peak is approximately at 18 kHz for elements 837 and 832 and at 4.5 kHz for the element 835. The second PSD peak is approximately at 4.5 kHz for elements 837 and 832 and at 18 kHz for the element 835. The graph patterns for all the elements do not appear to be very uniform when compared to that of the steel material. The maximum PSD (με2/Hz) for steel is approximately higher at 4.0 x 10⁻³ με2/Hz as compared to aluminium which is only at
7.4 x 10⁻⁴ με2/Hz. The second PSD (με2/Hz) for steel is also approximately higher at 1.16 x 10⁻³ με2/Hz as compared to the aluminium which is only approximately at 6.5 x 10⁻⁴ με2/Hz. In comparing the velocity differences (5.18 m/s and 3.35 m/s) of the steel material (refer to Figures 12 and 13), it can be noted in the graph pattern which is almost similar to the first dominant PSD which is approximately at 19 kHz and where the second PSD peak lies between 22.5-23.0 kHz. For a velocity of 5.18 m/s the maximum power spectrum (με2/Hz) is approximately seen as 4.6 x 10⁻³ με2/Hz if compared to the velocity of 3.35 m/s which is approximately only at 4.0 x 10⁻³με2/Hz. The second PSD (με2/Hz) of the steel velocity is approximately at 5.18 m/s 3.4 x 10⁻³με2/Hz if compared to the velocity that is at 3.35 m/s which is approximately only at 1.16 x 10⁻³ με2/Hz. In making a comparison for the differences in the velocities (5.18 m/s and 3.35 m/s) of aluminium material (refer to Figures 12 and 13) one should note that the graph pattern is seen to be not very uniform where the first and second dominant PSD is approximately at 18-20 kHz and 3.8-4.5 kHz respectively. For the velocity of 5.18 m/s the maximum power spectrum (με2/Hz) is approximately at 1.2 x 10⁻³ με2/Hz as compared to the velocity of 3.35 m/s which is approximately only at 7.4 x 10⁻⁴με2/Hz. The second PSD (με2/Hz) of the velocity of aluminium is at 5.18 m/s which is approximately at 9.7 x 10⁻⁴ με2/Hz as compared to the velocity of 3.35 m/s which is approximately only at 6.5 x 10⁻⁴με2/Hz. From the results of the finite element (from simulated time histories and PSD), it can be concluded that steel has a higher PSD when compared to aluminium for both velocities. This is because during impact simulation, when the striker hits the steel, the strain signal and the vibration of the striker is higher than that of aluminium. Steel has a higher internal/strain energy than aluminium so it tougher than aluminium. For different velocities of the same material, the PSD is higher when the velocity of the striker is higher. From the studies of Landrein et al. (2001) it was reported that the initial speed was proportional to the amplitude of the first oscillation of the tup load time trace. The higher the initial speed, the higher will be the amplitude of the first oscillation and the maximum impact load is also higher. From the equation it is also observed that the impactor displacement x1 is proportional to the initial impact
velocity. Studies by Changliang et al. (2006) highlight that the impact damage extent for a composite filament vessel with internal pressure is more severe than that without the internal pressure under a low velocity impact case with the same kinetic energy. It also shows that with the increase of the impact velocity, there is an increase in the damage. Martins et al. (2007) state that the dynamic energy release rate for crack propagation is represented by the area under the falling part of the force displacement curve which passes the crack initiation point thereby increasing the crack as the velocity is increased.
The power spectrum analysis method is used to extract and compare the frequency spectrum for both the materials and with different velocities. The main finding 0.00E+00
5.00E-04 1.00E-03 1.50E-03
0 5000 10000 15000 20000 25000
elem 837 vel 5.18 elem 835 vel 5.18
elem 832 vel 5.18
0.00E+00 1.00E-03 2.00E-03 3.00E-03 4.00E-03 5.00E-03
0 5000 10000 15000 20000 25000
elem 837 vel 3.35 elem 835 vel 3.35
elem 832 vel 3.35
0.00E+00 5.00E-04 1.00E-03
0 5000 10000 15000 20000 25000
elem 837 vel 3.35 elem 835 vel 3.35
elem 832 vel 3.35 με2
/Hz
με2
/Hz
με2
/Hz
of this work is that the strain signal and power spectrum density of the striker during the impact simulation for steel is higher than aluminium. In comparing the different velocities the power of the spectrum density is noted to be higher when the velocity of the striker goes higher.
5. CONCLUSION
This paper discussed signal analysis by using the PSD method. Through this procedure the quantity of energy produced from every frequency is measured during the impact simulation. The strain signal and PSD of the striker in the steel material are higher when compared to that in the aluminum material at the time of the impact simulation. The PSD was found to be proportional to the strain/internal energy indicating that it was higher when the PSD of the striker was at a higher point during the impact simulation.
The strain signal and PSD of the striker during the impact simulation for a velocity of 5.18 m/s is also higher if compared to the velocity of 3.18 m/s. This shows that the strain signal and PSD are proportional to the velocity of the striker and in addition also indicates that the velocity of the impact was higher in the PSD of the striker was also during impact simulation. Finally from the finite element results it was seen that the strain/internal energy was proportional to the PSD and the energy absorbed was also proportional to the PSD in the experiment.
ACKNOWLEDGEMENTS
The authors would like to express their gratitude to Universiti Kebangsaan Malaysia and Universiti Teknikal Malaysia Melaka for supporting these research activities.
REFERENCES
Abdullah, S., Choi, J.C., Giacomin, J.A. and Yates, J.R., 2006. Bump extraction algorithm for variable amplitude fatigue loading, International Journal of Fatigue, 28, 675–691.
Abdullah, S., Ismail, N., Nuawi, M. Z., Nopiah, Z. M. and Baharin, M. N. 2009. On the need of kurtosis based technique to evaluate the fatigue life of a coil spring, Proceeding International Conference on Signal Processing Systems, 989-993.
Chang, C. L. and Yang, S. H., 2009. Simulation of wheel impact test using finite method, Engineering Failure Analysis, 16, 1711-1719.
Changliang, Z., Minfa, R., Wei, Z. and Haoran, C., 2006. Delamination prediction of composite filament would vessel with metal liner under low velocity impact, Composite structure, 75, 387-392.
Charpy pendulum impact test, 2006. International Standard Metallic materials, part 1, 2 & 3.
Chen, Y., Pedersen, K.O., Clausen, A.H. and Hopperstad, O.S., 2009. An experimental study on the dynamic fracture of extruded AA6xxx and
AA7xxx aluminium alloys, Material Science & Engineering A, 523(1-2), 253-262
Hibbeler, R.C., 2008. Mechanics of Materials, 7th ed, Prentice Hall, Singapore.
Jang, Y.C., Hong, J.K., Park, J.H., Kim, D.W. and Lee, Y., 2008. Effects of notch position of the charpy impact specimen on the failure behavior in heat affected zon, Journal of materials processing technology, 201, 419–424
Jogi, B.F., Brahmankar, P.K., Nanda, V.S. and Prasad, R.C., 2008. Some studies on fatigue crack growth rate of aluminium 6061, Journal of Materials Processing, 201, 380-384.
Landrein, P., Lorriot, T. and Guillaumat, L., 2001. Influence of some test parameters on specimen loading determination methods in instrumented Charpy Impact, Engineering Fracture Mechanics, 68, 1631-164.
Martins, C, F., Irfan, M. A. and Prakas, V., 2007. A Dynamic fracture of linear medium density polyethylene under impact loading, Material Science and Engineering A, 465, 211-222.
Nuawi, M. Z., 2007. “Pembangunan system pemantauan keadaan perkakas mesin menggunakan kaedah isyarat ultrasonic bawaan udara “, Thesis of Doctoral of Philosophy, Department of Mechanical and Materials, UniversitiKebangsaan Malaysia.
Research activity case study of Structure Analysis for Alloy Rim utilizing Computer-Aided Engineering, 2009. Dream Edge Sdn Bhd.
Rittel, D., Pineau, A., Clisson, J. and Rota, L., 2002. On Testing of Charpy Specimens using the one point Bend Impact Technique, Centre Technique de l’Armement, Cedex, France.
Saidur, R., Jahirul, M.I., Hasanuzzaman, M., Masjuki, H.H. 2008. Analysis of exhaust emissions of natural gas engine by using response surface methodology, Journal of Applied Sciences, 8(19), 3328-3339 Shiavi, R., 1999. Introduction to applied statistical signal
analysis, 2th ed., Academic press, San Diego. Shterenlikht, A., Hashemi, S. H., Yates, J R., Howard, I.
C. and Andrews, R. M., 2005. Assessment of an Instrumented Charpy impact machine, International Journal of Fracture, 132, 81-97.
Timoshenko, S., Young, D. H. and Weaver, JR, W., 1974. Vibration Problems in Engineering, 4th ed., John Wiley and Sons, New York.
Toh, C.K. and Kanno, S., 2004. Surface integrity effects on turned 6061 and 6061-T6 aluminum alloy, Journal of Material Science, Vol. 39, pp. 3497-3500. Toshiro, K., Masahiro, O., Shigeki, M.and Hiroyuki, T., 2000. Effects of striker shape and attached position of strain gage on measured load in Instrumented Charpy impact test, Journal of the Iron and Steel Institute of Japan, 86, 595-601.