ISSN 0973-4562 Volume 9, Number 10 (2014) pp. 1223-1238 © Research India Publications
http://www.ripublication.com
A 16kV Distribution Network Reconfiguration by Using
Evolutionaring Programming for Loss Minimizing
M. F. Sulaima1, M. S. Shidan1, W. M. Dahalan2, H. Mokhlis3, M. F. Baharom1, H. I. Jaafar1
1
UniversitiTeknikal Malaysia Melaka, Faculty of Electrical Engineering, 76100, Hang Tuah Jaya, Malacca, Malaysia
2
University of Kuala Lumpur (Unikl-MIMET),
Department of Electrical Engineering, Lumut, Perak, Malaysia 3
University of Malaya, Department of Electrical Engineering, Kuala Lumpur, Malaysia
Corresponding author: [email protected]
ABSTRACT
In the worldwide trend toward restructuring the electricity network; there are a lot of problems. Where with the increasing of electricity demand, intelligence algorithm is one of the optimization search engine that may help in minimizing the power losses in the power distribution network. This paper presents a method of 16kV Distribution Network Reconfigurtion (DNR) by using Evolutionary Programming (EP). The main objectives of this study are to minimize the power losses and improve the voltage profile while analyzing the consistency and computing time effectively. The performance of the Evolutionary Programming method will be investigated and the impact to the 16kV distribution network will be analyzed. Thereal result will be compared with the conventional initial network and other optimization technique which is Genetic Algorithm (GA). The results of this study is hoped to help the power system engineers in Malaysia in order to solve the losses problem in the plant at the same time increasing the efficiency of the real 16-bus distribution system.
INTRODUCTION
The proposed of distribution network reconfiguration is to reduce the system losses, balance the feeder load while improving the voltage profile simultaneously. The minimizing power losses and Voltage Profile Improvement (VPI) are the major aspect for an efficient distribution system. Evolutionary programming could be helpful in the future research in the field of power system [1, 2, 3]. Distribution network reconfiguration is defined as changing the open or close feeder switches in the network system and usually done for loss reduction via the solution involves a search over relevant radial configurations [4, 5].
Nevertheless, the evolutionary programming is a technique that can be applied to identify an optimal switching feeder for plan reconfiguration [6]. During a feeder reconfiguration, two objectives are considered by the operating system operator. They are minimum losses and excellence voltage profile. The computer program that is giving adequate switching plan to reconfigure the feeders can be referred by the engineers in order to get the appropriate number tie switches to be opened in the system.
There are many existing methods being proposed to solve the problems for feeder reconfiguration such as Genetic Algorithm (GA) and Evolutionary Strategies (ES), Tabu Search (TS), Artificial Neural Network (ANN), Simulated Annealing Method (SA) and Fuzzy mathematics with the objectives to solve 33kV distribution network reconfiguration problems and analysed features of these methods applied to distribution network reconfiguration [7, 8]. The loss reduction is an important element in minimizing the energy loss in large power distribution system as wrote in [9]. The authors proposed a method for energy loss reduction by develop a heuristic rules to lead the iterative process, make the energy loss minimization method effective, robust and fast.
These are numerous optimization methods in solving the 11kV, 33kV and 69kV distribution network reconfiguration, but there is a small number of 16kV network system. In this work, in order to solve the problems in minimizing the power losses and improving the voltage profile; anheuristic method which is called as Evolutionary Programming (EP) is introduced to 16kV test system. This type of the test system is chosen because of their rare to find and easy to involve with losses increment due to the change of the network environment such as load demand, human error and nature disaster. The performance analysis of Evolutionary Programming (EP) method and Genetic Algorithm method (GA) will be investigated. The results will be analyzed in order to select the best technique in reducing feeder losses and improving voltage profile for special 16kV power distribution network system.
MATHEMATICAL MODEL OF A DNR
operating structure that minimizes the system power loss while satisfying operating constraints. Thus, the network reconfiguration for loss minimization can be formulated as shown in Eq. 1 and Eq. 2.
Minimize:
∑ (1)
I.e ∑ | | (2)
Where:
is the loss function, is the current in branch i, is the resistance of branch, NL is the total number of branch and is the variable that represents the topological status of the branch (0=open, 1=close). From the Eq. 1, the total power loss can be increased when the main source is sending the large amount if current, through certain branch in the network to achieve the target demand at the end of feeder. But, with the reconfiguration network, it can be solved the problem to minimize the power losses by changing the closed and open switching in the network accordingly.
There are several constraints must be satisfied during the network reconfiguration. Radial network constraint
Distribution network should be composed of the radial structure considering operational point of view.
Node voltage constraint
Voltage magnitude at each node must lie within their permissible ranges to maintain power quality. The standard minimum voltage used is 0.95 and maximum voltage is 1.05(1±5%).
(3) Feeder capability limits
| | , , … … (4)
Where = maximum current capability of branch k.
Load Flow and Line Losses
In this study, the Newton Raphson load flow method has been used. Where, load flow studies are need in scheduling, economic planning, control of the existing system and planning its future expansion. The Newton-Raphson load flow equation as follow:
∑ | | | | (6)
Where,
, : Voltage magnitude of bus i and j respectively , : Voltage angle of bus i and j respectively
, : Magnitude and angle ofYij element in the bus admittance matrix respectively
The equations for the difference in real power ∆ and reactive power ∆ are:
∆ (7)
∆ (8)
and are the specified real and reactive power at bus i respectively. The rectangular Newton-Raphson power flow is expresses as:
∆
∆ ∆| |∆ (9)
Power loss equation as follow:
∑ ∑ (10)
(11) (12)
Where,
: Real power at bus i respectively : Real power at bus j respectively
: Reactive power at bus i respectively : Reactive power at bus j respectively
: Line resistance between i and j
: Voltage magnitude of bus i and j respectively : Voltage angle of bus i and j respectively
The Voltage Profile Formulation
.95 if .95 :
.95 if . 5 :
:
IMPLEMENTATION OF EVOLUTIONARY PROGRAMMING
The implementation proposed here uses an Evolutionary Programming search method for determining the optimal solution to the network reconfiguration problem.The programming will be written and used the entire data network. The EP programming will be tested on MATLAB for result analysis. The network is optimized switch position by determined on the basis of their fitness function. Tie switches are symbolized by using the integer such as 1, 2 or 3. Evolutionary Programming (EP) was originally conceived by Lawrence J. Fogel in 1960 [10]. In EP, mutation is done according the Gaussian or any other mathematical formulation.
The EP is an excellent method for searching optimal solution to a complex problem. Generally, there are several steps for developing EP. The steps are:
1. Random generation of initial population 2. Fitness computation
3. Mutation 4. Combination
5. Tournament selection
6. Transcription of next generation
Step 1: Random generation of initial population
The process for the optimal solution is done by determining a population of candidate solution over a number of generations randomly.
Step 2: Fitness computation
The strength of each candidate solution is determined by its fitness function which is evaluated based on the constraint in the objective function of the optimization process.
Step 3: Mutation
Others will combine through a process of mutation to breed a new population. Step 4: Combination
Step 5: Tournament Selection
Tournament selection is choosing the survival to next generation. Step 6: Transcription of next generation
The new population is evaluated and the process is repeated.
Optimization in the EP can be summarized into two major steps. Which are mutate the solution in the population, mutational transformations ( play a crucial role in EP. It is the key search operator which generates new solutions (offspring) from the current one (parent). Another one is select the next generations from the matured and the current solutions. The process of network reconfiguration using EP method is explained more below for implementation of the EP method in DNR.
Initialization
Input system data includes network data, buses data, lines data, and data to run EP such as maximum iteration, population size and accuracy are inserted in the MATLAB program. The initialization population is determined by selecting tie switches from the set of original tie switches. After that, the variable will be generated by the system via a random generator available in the program and they will be utilized to compute the power losses in the next step. Equation of tie switches as shown:
, , … … … . . (13)
Where,
S= variable for tie switch = number of tie switches
Furthermore, to ensure the radial network is maintained, several constraint needs to be considered in the system. There are several conditions have been adopted for the selection switches:
Condition1: All switches that do not belong to any loop are to be closed. Condition 2: All switches are connected to the sources are to be closed. Condition 3: All switches contributed to a meshed network need to be closed. Fitness Calculation
Mutation
Mutation is the process of generating the offspring of the random numbers. The Gaussian mutation technique has been used in this project. It has been implemented by using below equation:
, , (14)
(15)
Where:
, = Mutated parents (offspring)
= Parents
= Gaussian random variable with mean and variance = Mutation scale, 0< <1
= Maximum random number for every variable = Minimum random number for every variable = Fitness for the random number
= Maximum fitness
The mutation scale or search step, determine the convergence rate. Large value or will cause slow convergence of the EP since it implies to a large search step. Thus it will lead to large computation time.
Fitness Calculation & Combination
At this stage, the fitness function is recalculated in order to get new fitness value based on the new generate state variables (new tie switch) during mutation process. Subsequently, the combination process will combine the parents and offspring in cascade mode.
Tournament Selection
EP employs a selection through the tournament scheme as to choose the survivals to the next generation. This selection is used to identify the candidates that can be transcribed into the next generation from the combined populations of the parent and offspring. The priority selection was done whereby the populations of individuals with better fitness were sorted in descending order according to their fitness values. Convergence Test
Convergence test is required to determine the stopping criteria of the evolution. The convergence criteria are specified by the difference between maximum and minimum fitness . . The mathematical equation is given as follow:
The Simulation and Test System
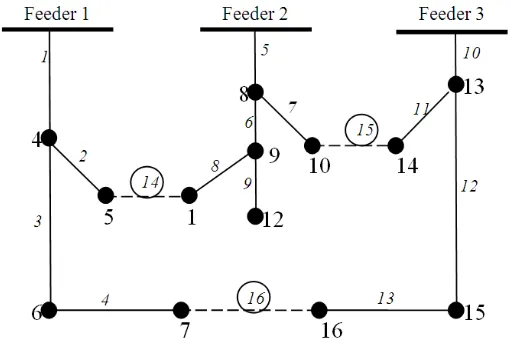
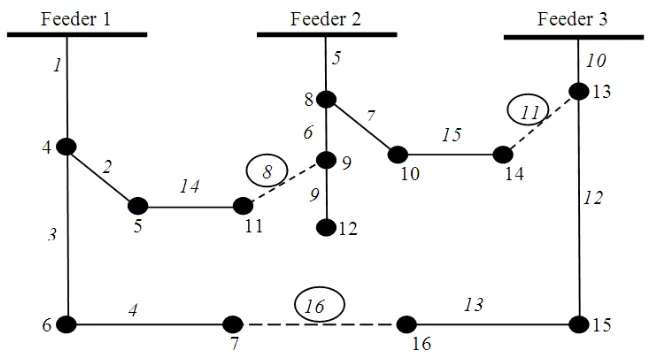
This paper used the test system which consist of 16-bus radial distribution system as shown in Figure 1. The system consist of 3 feeders, 13 sectionalizing switches(normally close switches) and 3 tie switches(normally open switches with dotted line) and located on branch No. 14, 15, and 16.This system has 13 load centers and is assumed to be constant with initial load capacities for total real and ractive power are 28.7MW and 16.3MVAr respectively. The base MWA for the system is set at 100MVA. In other word, the total optimization variable is represented by combination of 3 switches (X1, X2, and X3). After that, all the population will be evaluated by using load flow analysis. The power flow program, Evolutionary Programming and Genetic Algorithm are implemented in MATLAB environment. All calculation for this method are carried out in the per-unit system.
Figure 1: 16-bus test system with initial network
Three cases have been executed in determining their reliability of having EP and GA in the system to achieve best configuration.
1. In the first case
The system follows the original network distribution of 16-bus without any alteration done. All the switches in the network remain the same.
2. In this second case
The reconfiguration strategy is applied in the system is based on GA method. 3. In this third case
RESULT AND ANALYSIS
The proposed algorithm is tested on radial 16-bus distribution test system. The numerical result of the three cases is summarized in the Table 1 while the Table 2 and Table 3 represent the consistency for a Genetic Algorithm method and Evolutionary Algorithm method. Other than that, from Table 4 represent the improvement of voltage profile between GA and EP algorithm.
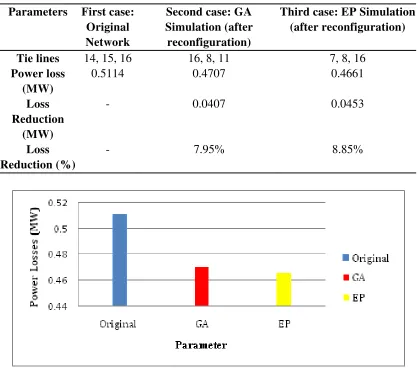
Table 1: The performance analysis of the 16-bus systems by using GA and EP
Parameters First case: Original Network
Second case: GA Simulation (after reconfiguration)
Third case: EP Simulation (after reconfiguration)
Tie lines 14, 15, 16 16, 8, 11 7, 8, 16
Power loss (MW)
0.5114 0.4707 0.4661
Loss Reduction
(MW)
- 0.0407 0.0453
Loss Reduction (%)
- 7.95% 8.85%
Figure 2: Total power losses for original, GA and EP
GA method, the total power loss is 0.4707MW and 0.0407MW for loss reduction if to be compared with original network. The percentage of reduction is approximately 7.95%. Other than that, the total power loss in case 3 is 0.4661MW while the loss reduction is 0.0453MW when is compared to the original network. The percentage for loss reduction is nearly 8.85%. From the result obtain, it can be concluded that EP algorithm is better in power loss reduction compared to the GA algorithm. The Figure 2 review the total power losses plotted in the graph presentation.
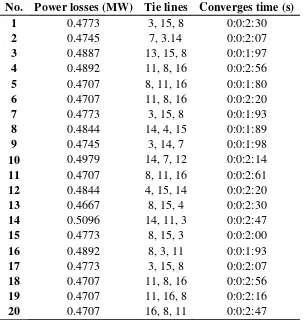
Table 2: Table of Consistency GA
No. Power losses (MW) Tie lines Converges time (s) 1 0.4773 3, 15, 8 0:0:2:30
Table 3: Table Consistency of EP
7 0.4661 7, 8, 16 0:0:09:40 8 0.4661 7, 8, 16 0:0:09:40 9 0.4661 7, 8, 16 0:0:09:49 10 0.4661 7, 8, 16 0:0:09:54 11 0.4661 7, 8, 16 0:0:09:67 12 0.4661 7, 8, 16 0:0:09:58 13 0.4661 7, 8, 16 0:0:09:76 14 0.4661 7, 8, 16 0:0:09:90 15 0.4661 7, 8, 16 0:0:09:58 16 0.4661 7, 8, 16 0:0:09:76 17 0.4661 7, 8, 16 0:0:09:58 18 0.4661 7, 8, 16 0:0:10:00 19 0.4661 7, 8, 16 0:0:09:49 20 0.4661 7, 8, 16 0:0:09:54
Table 2 and 3 result are shown the consistency of both methods, GA and EP algorithm. It can see from the Table 2 and 3:
a. The consistency of converges time Both tables show the consistency of time.
b. Optimization results are better in longer runtime.
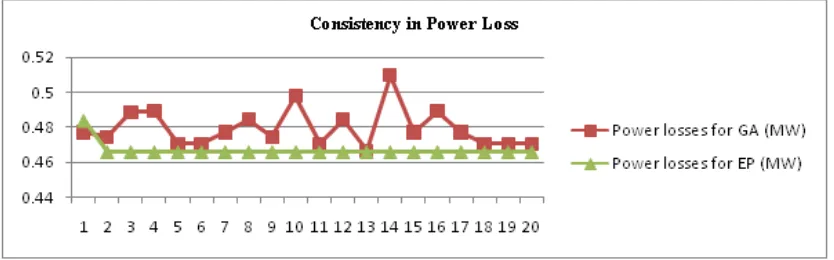
Convergence time for EP method is more longer than convergece time for GA. Figure 3 and 4 shown the better explaination that is taken from Table 2 and 3.
Figure 4: Consistency in Converges Time between GA and EP
It can be observed that, Figure 3 and 4 are represent and conclude from the Table 2 and 3. In order to determine the robustness and the consistency for both algorithm method, the program has run for 20 times to verify the converges time and power loss for this system. From Figure 3, the power loss for GA is not consistence. The graph shown increase and decrease in power losses. But, for EP method, the graph is consistence and linear starting at 2nd until 20th running. In other word, EP method is achieve it stabilize level so that the value of power loss is remain the same. In addition, for Figure 4 is explained the consistency in converges time comparison between GA and EP method. From observation can see that both method achieved good in consistency in converges time. But, also can see GA method get lower and fastest in converges time vice versa to EP method. Where, in EP method the converges time get more longer. Optimization results are better in longer runtime [11, 12].
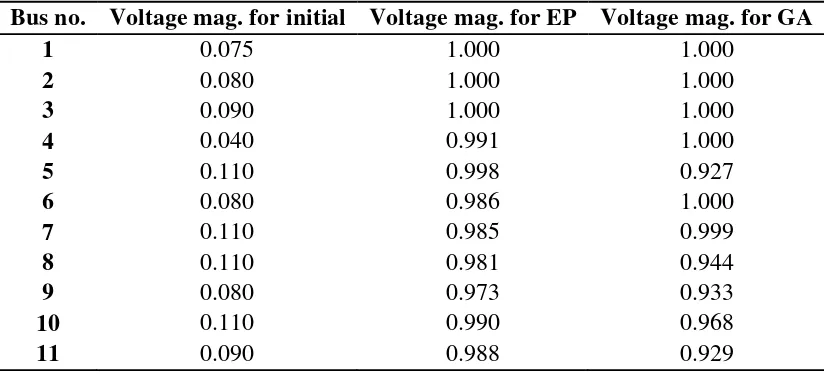
Table 4: Voltage Profile Comparison between GA and EP
Bus no. Voltage mag. for initial Voltage mag. for EP Voltage mag. for GA
1 0.075 1.000 1.000
2 0.080 1.000 1.000
3 0.090 1.000 1.000
4 0.040 0.991 1.000
5 0.110 0.998 0.927
6 0.080 0.986 1.000
7 0.110 0.985 0.999
8 0.110 0.981 0.944
9 0.080 0.973 0.933
10 0.110 0.990 0.968
12 0.080 0.972 0.931
13 0.040 0.992 1.000
14 0.040 0.991 0.977
15 0.040 0.990 0.998
16 0.090 0.989 0.998
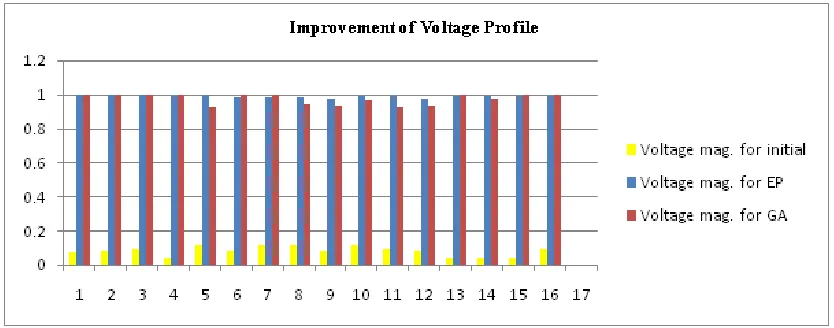
From Table 4, the results shown that EP method has a better value for the voltage profile if to be compared to initial configuration and GA method. The improvement of voltage profile has clearly shown in Figure 5. The voltage profile from bus 4 until 13 shows the improvement of EP from GA. While, graph GA shows the difference and not effective value between the bus.
Figure 5: Voltage profile improvement comparison between initial configuratuion, GA and EP
Figure6: The radial network after reconfiguration GA
Figure 7: The radial network after reconfiguration EP
To get the optimal value of power losses for both cases the sectionalizing switches are contributed in getting the value. The original switches that are opened from original network are at 14, 15 and 16. In case 2, GA algorithm after reconfiguration, the sectionalizing switches opened are 8, 11 and 16 while for EP it is opened at 7, 8 and 16 respectively. The Figure. 6 and 7 show the network topology after the reconfiguration by using both methods accordingly.
CONCLUSION
network reconfiguration with the objectives to minimize line losses and improving voltage profile. The superior of the proposed method has shown with the comparison of the results. The proposed algorithm is performed in MATLAB environment and the results of the study hash own that there are better improvement in terms of consistency and convergence time too. By all the word above, it can be concluded that the EP method produces a feasible and encouraging solution better than initial configuration and GA method while giving a great impact for the whole 16kV distribution network reconfiguration system.
ACKNOWLEDGEMENT
The authors would like to thank to the Universiti Teknikal Malaysia Melaka and University of Malaya for the all support given.
REFERENCES
[1] Darrell Whitley, 2001. An Overview of Evolutionary Algorithm: Practical Issues and Common Pitfalls. Information and Software Technology 43: 817-831.
[2] Armin Ebrahimi Milani and Mahmood Reza Haghifam, 2013. A New Probabilistic Approach for Distribution Network Reconfiguration: Applicability to Real Network. Mathematical and Computer Modelling 57: 169-179.
[3] Vladimiro Miranda, Dipti Srinivasan and L M Proenca, 1998. Evolutionary Computation in Power systems, Electrical Power & Energy System, Vol. 20, No. 2: 89-98.
[4] J. S Savier and Debapriya Das, 2007. Impact of Network Reconfiguration on Loss Allocation of Radial Distribution Systems. IEEE Transactions on Power Delivery, Vol. 22, No. 4.
[5] Chen-Ching Liu, Seung J. Lee and Khoi Vu, 1989. Loss Minimization of Distribution Feeders: Optimality and Algorithm, IEEE Transactions on Power Delivery, Vol. 4, No. 2.
[6] Men-Shen Tsai, and Fu-Yuan Hsu, 2010. Application of Grey Correlation Analysis in Evolutionary Programming for Distribution System Feeder Reconfiguration. IEEE Transactions on Power System, Vol.25, No.2, May. [7] M. M. Aman, G. B. Jasmon, K. Naidu, A. H. A, H. Mokhlis, 2013. Discrete
Evolutionary Programming to solve Network Reconfiguration Problem. IEEE. [8] YitaoHui, Ning Hua, Chun Wang, Liao lang Gong and Xiangshuo Li, 2010.
[9] Rubin Taleski and Dragoslav Raji Cid, 1997. Distribution Network Reconfiguration for Energy Loss Reduction. IEEE Transactions on Power Systems, Vol. 12, No. 1, February.
[10] L. J. Fogel, A. J. Owens, and M. J. Walsh, 1996. Artificial intelligence through simulated evolution.
[11] Gunter Rudolph, 1996. Convergence of Evolutionary Algorithms in General Search Spaces. IEEE.