UNIVERSITI TEKNIKAL MALAYSIA MELAKA
THERMAL COMFORT ASSESMENT IN MANUFACTURING
ENVIRONMENT
This report submitted in accordance with requirement of the UniversitiTeknikal Malaysia Melaka (UTeM) for the Bachelor Degree of Manufacturing Engineering
(Manufacturing Management) (Hons.)
by
ZULL AZMI BIN JAMALUDIN B050910155
870608-11-5375
DECLARATION
I hereby, declared this report entitled “Thermal Comfort Assessment in Manufacturing Environment” is the results of my own research except as cited in
references.
Signature : ………
Author’s Name : ZULL AZMI BIN JAMALUDIN
ABSTRAK
ABSTRACT
This study is about the human satisfaction to the thermal environment which is thermal comfort, especially in the industrial sector. In this study, respondents were surveyed is among students and workers which is the occupants who used the places which specified in the scope of this study. Each person has a different perception and evaluation of the thermal comfort around them. The objective of this study was to identify occupant’s satisfaction of the thermal comfort by having their opinions then evaluate the thermal comfort using thermal comfort monitor to determine the level of occupants comfortable of the thermal environment. Comfortable of the occupants is some factor that can increase the productivity and then increase work quality outcomes. The occupants comfortable level is determined by providing a questionnaires form and the interviews then do the assessment of the thermal environment using the thermal comfort monitor. After all the assessment data is available, calculation and analyze of those data will be done to get the results and discussion of this research.
iii
DEDICATION
I would like to express my deepest appreciation and special thanks to everyone, especially to both of my beloved parents and family who have given their support, encouragement and good advice to me. Then to my project super visor , lecturer and
iv
ACKNOWLEDGEMENT
v
List of Abbreviations, Symbol and Nomenclature xi
CHAPTER 1 INTRODUCTION 1
2.2 Research and Observation of Thermal Comfort 5
2.3 Factors Affecting Thermal Comfort 6
2.3.1 The Effect of Air Temperature 7
2.3.2 The Effect of Air Velocity 7
2.3.3 The Effect of Relative Humidity 7
2.3.4 The Effect of Mean radiant Temperature 8 2.3.5 The Effect of Clothing Insulation for Thermal Comfort 8
2.3.6 Metabolic Rates for Work Activities 10
2.4 Models of Thermal Comfort 11
2.5 Thermal Comfort in Different Regions 11
vi
CHAPTER 3: METHODOLOGY 14
3.1 Introduction 14
3.2 Study Overview 17
3.3 Summary of Methodology 18
3.4 Construct Survey 18
3.5 Thermal Comfort Measurement 20
3.6 Analysis 21
CHAPTER 4: RESULT & DISCUSSION 22
4.1 Questionnaire Responds Analysis 22
4.1.1 Building Occupant Background 23
4.1.2 Personal Workspace Location 28
4.1.3 Office Layout 31
4.2. The Four Environmental Parameters 41
4.2.1 Dry-Bulb Temperature for Morning Session 42 4.2.2 Dry-Bulb Temperature for Afternoon Session 43 4.2.3 Mean Radian Temperature for Morning Session 44 4.2.4 Mean Radian Temperature for Afternoon Session 45 4.2.5 Relative Humidity Temperature for Morning Session 46 4.2.6 Relative Humidity Temperature for Afternoon Session 47
4.2.7 Air Velocity for Morning Session 48
4.2.8 Air Velocity for Afternoon Session 50
4.3. Data Analysis for Predicted Mean Vote (PMV) and Predicted
Percentage of Dissatisfied (PPD) 51
4.3.1 Predicted Mean Vote (PMV) 51
vii
4.4 Discussion the Occupant’s Responses Regarding Thermal Comfort 53 4.5 Discussion the correlation between thermal comfort level and
subjective responses. 55
CHAPTER 5: CONCLUSION & FUTURE WORK 58
5.1 Conclusion 58
5.2 Future work recommendation for improvement 59
REFERENCE 60
APPENDICES
Appendix A: Gantt Chart Psm 1 Appendix A: Gantt Chart Psm 2
viii
LIST OF TABLES
Table 2.3.1 Metabolic rates for various typical activities 9 Table 2.3.2 Insulating value of clothing elements 9 Table 2.3.4 Metabolic rates for various typical activities 10
Table 4.1.1: Responses of Question 1 23
Table 4.1.2 Responses of Question 2 24
Table 4.1.3: Responses of Question 3 25
Table 4.1.4: Responses of Question 4 26
Table 4.1.5: Responses of Question 5 27
Table 4.1.6: Responses of personal workplace location section 29
Table 4.1.7: Responses of Question 9 30
Table 4.1.8: Responses of office layout section 31
Table 4.1.9: Responses of office furnishing section 33 Table 4 1.10: Responses of thermal comfort section 36
Table 4.1.11: Responses of air quality section 37
Table 4.1.12: Responses of lighting section 38
Table 4.1.13: Responses of general comments section 40 Table 4.2.1: Data of average Dry-bulb temperature for morning session 42 Table 4.2.2: Data of average Dry-bulb temperature for afternoon session 43 Table 4.2.3: Data of average Mean radian temperature for morning session 44 Table 4.2.4: Data of average Mean radian temperature for afternoon session 45 Table 4.2.5: Data of average Relative humidity temperature for morning
Session 46
Table 4.2.6: Data of average Relative humidity temperature for afternoon
Session 48
Table 4.2.7: Data of average Air velocity for morning session 48 Table 4.2.8: Data of average Air velocity for afternoon session 50
Table 4.3.1: Data of average PMV 51
Table 4.3.2: Data of average PDD 52
ix
LIST OF FIGURES
Figure 2.1 Thermal Comfort Monitor (QUESTemp ™) 13
Figure 3.1 Project Framework 14
Figure 3.2 Flow chart of methodology 15
Figure 3.2.1: AMC Laboratory as Station1 16
Figure 3.2.2: Casting Laboratory as Station2 16
Figure 3.2.3: Welding Laboratory as Station3 16
Figure 3.2.4: Thermal Comfort Monitor (QUESTemp ™) 17
Figure 3.4.1: The six symbols of face 20
Figure 4.1: Pie-chart for responses question 1 24
Figure 4.2: Pie-chart for responses question 2 25
Figure 4.3: Pie-chart for responses question 3 26
Figure 4.4: Pie-chart for responses question 4 27
Figure 4.5: Pie-chart for responses question 5 28
Figure 4.6: Bar-chart for question 7 and 8 responses 30
Figure 4.7: Pie-chart for responses question 9 31
Figure 4.8: Bar-chart for result of office layout section 33 Figure 4.9: Bar-chart for result of office furnishings section 35 Figure 4.10: Bar-chart for result of thermal comfort section 36 Figure 4.11: Bar-chart for result of air quality section 38 Figure 4.12: Bar-chart for result of lighting section 39 Figure 4.13: Bar-chart for result of general comments section 41 Figure 4.14: Line graph for Dry-Bulb Temperature for morning session 43 Figure 4.15: Line graph for Dry-Bulb Temperature for afternoon session 44 Figure 4.16: Line graph for Mean Radian Temperature for morning
session 45
Figure 4.17: Line graph for Mean Radian Temperature for afternoon
session 46
Figure 4.18: Line graph for Relative Humidity Temperature for morning
session 47
x
session 48
Figure 4.20: Line graph for Air velocity for morning session 49 Figure 4.21: Line graph of Air velocity for afternoon session 50 Figure 4.22: Line graph for Predicted Mean Vote (PMV) data 52 Figure 4.23: Line graph for Predicted Percentage of Dissatisfied (PPD) data 53 Figure 4.24: Bar-chart for result of thermal comfort section 54 Figure 4.25: Predicted Mean Vote (PMV) and Predicted Percentage of
xi
LIST OF ABBREVIATIONS, SYMBOLS AND
NOMENCLATURE
HVAC - Heating, Ventilation and Air Condition PPD - Predicted Percentage of Dissatisfied PMV - Predicted Mean Vote
MRT - Mean Radiant Temperature WBGT - Wet Bulb Globe Temperature DB - Dry Bulb Temperature WB - Wet Bulb Temperature
1
CHAPTER 1
INTRODUCTION
Fanger (1986) defined that “Thermal comfort is condition of mind which expresses satisfaction and comfortable international human body with the surrounding thermal environment.” Thermal comfort is affected by the environmental factors or personal factors and the combination both of them. Auliciems and Szokolay (2007) explained that the environmental factor contains of humidity, radiation, and air movement. While personal factors, they include the metabolic rate (activity level). Havenith et al., (2002)
added for personal factors include also clothing properties and metabolic heat production. ACT Government Work Safe ACT (2010) also said that the term thermal comfort describes a person"s psychological state of mind in terms of whether they feel too hot or too cold.
Thermal comfort is very difficult to define because it’s need to take into account a range of environmental and personal factors when deciding on the temperatures and ventilation that will make feel comfortable. In indoor air should minimize occupant discomfort, irritation, and illness. Sick building syndrome symptoms, discomfort, and irritation can result from non-indoor air quality environmental factors such as noise, poor quality or inadequate lighting, lack of individual privacy or control, and other environmental factors.
1.1 Background of study
2 when deciding on the temperatures and ventilation that will make humans feel comfortable. The study is about the quantification of thermal comfort at difference place with difference environment which is the manufacturing laboratories at Faculty of Manufacturing (FKP) in Universiti Teknikal Malaysia Melaka (UTeM).
The thermal comfort is psychological; it may affect our overall morale. For example in industrial field, the employee complaints may increase when they fell not comfortable while they working. Some aspects of the thermal environment such as air temperature, radiant heat, humidity and air movement also may contribute to the symptoms of sick building syndrome, then the productivity of the organization may fall and in some cases people may refuse to work in a particular environment.
1.2 Problem statement
Thermal comfort in laboratories has to be considered seriously because of the negative influence on learning and the potential for energy conservation through careful temperature control. Thermal discomfort such as overheated environment at laboratories or too cold can be associated to physical stress (thermal stress) and therefore be responsible for illnesses and poor performance of the students or workers.
Thermal condition in laboratories has to be considered carefully mainly because of the high occupant density in laboratories may cause of the negative influences that an unsatisfactory thermal environment has on learning and performance. The mean radiant temperature is a significant factor, especially in buildings whose envelopes were exposed to a strong solar radiation.
3
1.3 Objectives
The objectives to be achieved in this project are:
1. To investigate and identify the thermal comfort levels at manufacturing laboratories in faculty of manufacturing (FKP)
2. To determine the subjective response of occupants regarding to thermal comfort at laboratories in UTeM.
3. To relate the thermal comfort levels with the subjective response of occupants.
1.4 Scope of project
4
CHAPTER 2
LITERATURE REVIEW
While the first chapter describes the background of study, this chapter proceeds with a fully-referenced review from the relevant literature. It covers introduction to thermal comfort, models of thermal comfort, methods and tools used for thermal comfort study.
2.1 Introduction
5 children, adults and the elderly. Gender factor is also calculated for the type of skin between women and men in terms of skin temperature, evaporation loss, metabolic rate and the type of clothing they wear. Moreover, human adaptation to other environmental for example the ability of people from warm climates may adapt to the hot environment. So, this explanation of thermal comfort is the psychological object of human's mind, especially in terms of whether a person is feeling too hot or too cold. maintenance, system design and construction, equipment manufacturing and sales, and in education and research. The HVAC industry was historically regulated by the manufacturers of HVAC equipment, but Regulating and Standards organizations such as HARDI, ASHRAE, SMACNA, ACCA, Uniform Mechanical Code, international Mechanical Code, and AMCA have been established to support the industry and encourage high standards and achievement.
2.2 Research and observation of thermal comfort
The studies of factors that cause the thermal comfort have been touch since the 1970’s. Based to the research conducted at Kansas State University by Ole Fanger et al. and had to bring in the development and refinement of ASHRAE Standard 55. The perception of comfort is obtained into one of complex and varied interactions. The study also found the majority of individuals satisfied with a set of values that were introduced.
6 environment by the result of predicted mean vote (PMV). PMV is survey conducted in a place to evaluate the comfort level of a group of people in that environment. When these factors have been estimated personal comfort and physical factors have been measured, the overall sensation of heat loss can be predicted by calculating the PMV index is based on heat balance in the human body were found comfort from the following equation:
PMV = (0.028 + 0.303 e-0.036M) [ (M - W) - H - E - Cres - Eres ]
Where,
M = Metabolic rate of the subject W = Effective mechanical work it does
H = Body heat loss by convection, radiation and conduction (dry heat loss) E = Actual evaporative heat exchange at the skin of the subject
Cres = Respiratory convective heat exchange Eres = Respiratory evaporative heat exchange
Comfort of home building as compared to public buildings is much more convenient in terms of thermal comfort is due to their smaller size, type of clothing worn and the use of different rooms. The small rooms have to be more considering because the room such as the bathroom should be more comfortable to user although naked user or dressed users. Then in the bedroom while the garments of man are different because the metabolic rate of people who sleep with people who are aware of is different.
2.3 Factors Affecting Thermal Comfort
7 relative humidity and mean radiant temperature. Then the two personal factors that involved are clothing insulation and metabolic rates.
2.3.1 The effect of air temperature
The best temperature is the condition where all people feel comfortable the environment. Air temperature is a measure of how cold or how hot we feel the air around us. They are kinetic energy of the gases around and if the gas molecules move quickly the air temperature will increase. Air temperature is expressed in degrees Fahrenheit or Celsius. Room temperature is typically considered 33ᵒC.
2.3.2 The effect of air velocity
Air velocity is the speed of air movement in the environment. Effect of air velocity affects human comfort. For example, the high velocity of air at low temperatures will make people uncomfortable with the environment. But when air temperatures are high and the air velocity is too low also makes people become uncomfortable and been sweating.
2.3.3 The effect of relative humidity
Relative humidity also how dry conditions we are and how cold we feel. For example a sense of air around us after we shower or we are in a room that has been dehumidified by the air-conditioner. Environments that have high humidity also caused sweating is ineffective because the reverse sweating process will occur where moisture will accumulate on the surface of the skin and visible sweat a lot on the surface. In areas of very low humidity people may experience discomfort from dry eyes, nose and throat. Generally people are much more sensitive to extremes of temperature than extremes of humidity.
8 Mean radiant temperature is the average temperature of surfaces that surround a person. The entire human body occurs about 50% and 60% change between sensible heats through the radiation process. For example, the sensitivity of radiant on comforts at the temperature that in controlling on the floor, but the MRT was the air environment in that space. Moreover, Sunlight coming in through a window will markedly contribute to mean radiant temperature. This may be decreased by simple measures such as the closing of blinds and curtains or the installation of solar film.
2.3.5 The effect of clothing insulation for thermal comfort
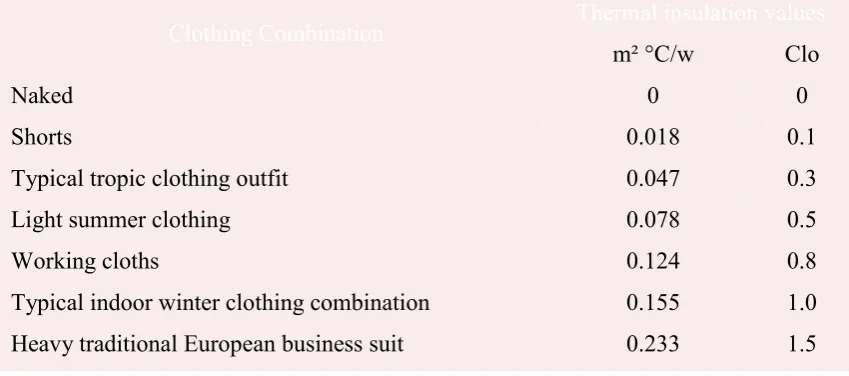
Clothing is the protective equipments that we wear on our body to avoid from exposure of the environment whether the pollution or light, it also protect the body from extreme temperature whether overheat or overcooled. As the insulating materials, clothes are mechanism that will transfer the temperature from the environment to the body. Clo- value is representing numerical value of clothing ensemble’s thermal resistance in SI units.
1 Clo = 0.155 m² °C/w. (Where; m = meter, w = Watt)
Barriers evaporation clothing is size moisture permeability or humidity affect the heat transfer from the buried layers of clothing and the skin through evaporation affects the heat loss from the skin surface. The following table shows some of the combination of insulation values.
9
Clothing Combination Thermal insulation values
m² °C/w Clo
Naked 0 0
Shorts 0.018 0.1
Typical tropic clothing outfit 0.047 0.3
Light summer clothing 0.078 0.5
Working cloths 0.124 0.8
Typical indoor winter clothing combination 0.155 1.0
Heavy traditional European business suit 0.233 1.5
Thermal resistance that happened to human body can be calculate by adding all the thermal resistance on the body especially the clothing worn based on the following table :