Nakhara :Journal of Environmental Design and Planning 19 (2020)97
The Correlation Between
Occupant Thermal Comfort and
Discomfort Glare in Office Buildings in the Tropics:
A Case Study in Thailand
Kittiwoot Chaloeytoy
*/ Masayuki Ichinose Graduate School of Urban Environmental Sciences, Tokyo Metropolitan University, Japan
[email protected] [email protected]
*
Corresponding author
Received 2020-04-16; Revised 2020-09-20; Accepted 2020-11-10
ABSTRACT
A buildings’ glazed facades influence their inhabited occupants in terms of thermal comfort and discomfort glare. This study aims to clarify the correlation between them in a tropical context. The field study was performed in office spaces in Thailand using comfort indices evaluation, i.e. the predicted mean vote (PMV) and daylight glare probability (DGP), and questionnaire surveys to investigate local occupants’ feedback. The statistical approaches indicated that the agreement between thermal comfort and discomfort glare variables could be observed with a glazing performance rating of the buildings and the occupants’ sensation level.
However, the usability of comfort indices must be carefully concerned with the post-occupancy evaluation since the PMV mismatched the occupants’ responses with the preference of a lower level of DGP. This study is an improvement in the understanding of occupants’ comfort, which allows researchers and practitioners to discuss on more comprehensive building assessment. It is necessary to study the effects of both comfort aspects separately, along with their interactions.
Keywords: Thermal comfort, discomfort glare, office spaces, glazed facades, post-occupancy evaluation
Nakhara :Journal of Environmental Design and Planning 19 (2020)98
INTRODUCTION
Over the last decade, strategies to enhance human health have advanced building occupants to the forefront of building practices. Newly constructed office buildings are anticipated to contribute positively to their occupants by assessing their comfort (WELL, 2019). The green building certification (LEED, 2018;
WELL, 2019) has evolved, and its concept has been adopted worldwide as a design guideline to reduce or eliminate negative impacts on the environment and, at the same time, to provide appropriate indoor environmental conditions so that occupants can achieve the required comfort.
Most studies on the comfort of building occupants have focused on quantifiable criteria such as physical measurements of the indoor environment, which can give an explanation of how the buildings affect their occupants. The environmental impact can be described in terms of human perception, such as thermal comfort, visual comfort, or acoustic comfort (Altomonte et al., 2013). However, the cross-analysis of them has not been prioritized.
Since the human body simultaneously perceives the presence of various environmental factors, to optimally enhance human comfort, the profound effects on the occupants need to be taken into account, and to be carefully integrated to improve the comfort evaluation.
In Thailand, the criteria for occupants’ comfort mainly refer to thermal comfort (TREES). However, thermal comfort is always accompanied by discomfort glare (Boyce, 2003; Garretón et al., 2016). As the trend of highly glazed facades continues to increase (Tzempelikos et al., 2007; CBRE, 2019), the transmitted solar radiation results in a large amount of solar heat gain and daylight entering simultaneously, and these solar effects have been described in the sensory terms of thermal comfort and discomfort glare, respectively. Achieving both are some of the most important and dominant features in any work situation (Boyce, 2003). In this study, therefore, the occupants’ comfort is revealed with a cross-study between them to clarify their correlation.
Thermal Comfort Introduction
Thermal comfort is defined as the condition of the mind that expresses satisfaction with thermal environments. It is possible to specify an environment predicted to be acceptable by a certain percentage of occupants, which is attained when the heat generated by the human is allowed to dissipate at a rate that maintains a thermal equilibrium in the body. Any heat gain or loss beyond this rate generates substantial discomfort (de Dear et al., 1998). To deal with the heat load, thermal comfort has been expressed as an index of predicted mean vote (PMV).
The PMV refers to the acceptance of thermal environment conditions based on ASHRAE 55 (2013). It was developed in Fangers’ study from a laboratory experiment with European subjects (Fanger, 1972) to find out if people felt comfortable under different conditions, and it was used to develop equations that would predict comfort.
According to his study, thermal comfort is affected by both environmental and human factors. The environmental factors include air temperature, mean radiant temperature, air velocity, and relative humidity. Factors related to subjective individuality involve the metabolism rates of activities and clothing resistance. The calculation method takes these six factors as an input, and the PMV value output is ranged based on the thermal perception level from cold (negative value: PMV < 0) to hot (positive value: PMV > 0), with a midpoint of 0 as a neutral sensation. Considering the widely acceptable range, human comfort is estimated to be within –0.5 to +0.5 (ASHARE 55, 2013).
The PMV is a reference method for several building assessments, including local standards such as the Thai’s rating of energy and environmental sustainability (TREES). It was used to evaluate thermal comfort for the study on Thai occupants (Taweekun et al., 2003). However, it may yield different results considering the responses in occupied spaces. A study on thermal comfort in office buildings in sub-tropical countries (Fukawa et al., 2017), and in healthcare buildings in Thailand (Sattayakorn et al., 2018) found that the PMV mismatched the thermal perception of the occupants from the questionnaire survey. The preferred temperature of local occupants was slightly colder than the neutral-based recommendation of ASHRAE 55 (2013). Thus, the post-occupancy evaluation in occupied space is a required process for obtaining local occupants’ feedbacks thoroughly.
Nakhara :Journal of Environmental Design and Planning 19 (2020)99
Discomfort Glare Introduction
Highly-glazed office buildings can utilize a large amount of daylight entering into interior spaces as the main light source. Thus, it has become crucial to avoid visual discomfort from excessive sunlight penetration falling to the human eyes. Visual comfort in interior spaces is commonly determined by considering discomfort glare (Narisada, 2004), and the discomfort glare indices are proposed to apply for visual comfort evaluation. In Thailand, guidelines for interior lighting design (TIEA, 2016) determine a discomfort glare issue that refers to the unified glare rating (UGR) index. However, the UGR is only suitable for assessing the glare from artificial light sources rather than from large-area sources, such as glass windows (Carlucci et al., 2015). Thus, the UGR is not suitable for discomfort glare evaluation in daylit spaces, which is generally found in the urban context of office layout in Thailand.
For daylit spaces specifically developed for large- area sources or daylight, the well-known indices are the daylight glare index (DGI) and daylight glare probability (DGP). However, the DGP performs better than DGI, especially in bright scenes with daylight (Jakubiec et al., 2012; Suk, 2017). The DGP, developed by Wienold et al. (2006), is a practical index used to evaluate the daylight glare. It was developed from experimental data in private office spaces involving human test subjects in Denmark and Germany by considering the luminance contrast and vertical illuminance on the observer’s eye (Wienold et al., 2009).
The DGP is considered as part of the main climate- based daylight metrics (Cantin, 2011). In tropical regions, field studies on DGP were carried out by Mangkuto et al. in Indonesia (2019), and by Hirning et al. in Malaysia (2016). These demonstrated a lower threshold value, with a preference for a DGP below 0.35, which is perceived as comfortable (imperceptible glare) based on the current recommendations by Wienold (2009). Both studies collected physical data in occupied spaces using high dynamic range (HDR) images, with software post-processing to obtain the DGP. Meanwhile, the glare sensation vote from the occupants was expressed in a questionnaire survey.
The physical and subjective variables were cross- analyzed to determine the DGP threshold values based on the occupants’ responses. Mangkuto suggested that visual comfort with the DGP ranking was suggested to be below 0.22, and below 0.16 - 0.22 by Hirning. The agreement in these tropical
studies revealed that Southeast Asians prefer a lower level of DGP. In Thailand, studies on discomfort glare are very limited. Further study is required as part of a field investigation in this study, and the DGP is selected as a suitable evaluation method.
Additionally, according to the findings in the tropical studies, the requirements of local occupants must be carefully considered following the actual comfort survey realized in the post-occupancy stage of the building (Ramasut et al., 2015).
Agreement on Thermal Comfort and Discomfort Glare
There are different fields of research that investigate how indoor temperature interacts with lighting. The study of body temperature suggested that lighting stimulation had an indirect influence on thermal comfort (Shoemaker et al., 1996). Studies of the energy simulation indicated that there was an implicit relationship between thermal and lighting aspects in radiative comfort, and the discomfort glare due to daylighting anticipated overheating related to solar radiation (Laforgue et al., 1997). Focusing on the human comfort evaluation, the observations on daylight available in an office space found that daylight through windows provided a comprehensive package of visual and thermal discomfort (Boyce, 2003). A study on indoor environment acceptance conducted in European regions showed that the environmental temperature significantly affected the perception of light (Laurentin et al., 2000). A study on the effects of perceived indoor temperature on DGP in a test room in Argentina revealed that the correlation between glare sensation and thermal sensation vote was dependent on the sensation level. The occupants who were out of their thermal comfort, particularly because of a warm sensation, could be affected by glare perception (Garretón et al., 2016). In a tropical study, a computer-based simulation study in Singapore found a strong correlation between PMV and DGP, and both revealed the same patterns due to the transmitted solar radiation (Fangzhi et al., 2013). From the mentioned background, however, these studies with the experiments in a test room or computer- based simulation may yield different results to a field study. It is worthwhile to take a further step in the post-occupancy evaluation, which is needed to be pursued in the tropical context study. Additionally, the occupants’ sensation should be discussed in terms of thermal sensation level and glare sensation
Nakhara :Journal of Environmental Design and Planning 19 (2020)100
level since the background has been reviewed in the occupants who were inside and outside their comfort zone.
Impact of Glazed Facades on Occupants’ Comfort
A glazed façade is the largest source that can cause a negative solar impact on occupants, and its effects have been described in terms of thermal comfort and discomfort glare. This makes it necessary to design a proper workplace with satisfying environmental conditions for the occupants. A simulation study on glass performance found that the impact of a window on thermal comfort could be defined by the transmitted solar radiation and the optical properties of the glass (Huizenga et al., 2006). A study on the performance rating of glass windows in a test room in Thailand found that glass specifications strongly affected the PMV because of the effect of heat transfer from surface temperature and transmitted solar radiation (Chaiyapinunt et al., 2005). The fraction of incident solar radiation admitted through a window, defined as the solar heat gain coefficient (SHGC), needs to be considered to provide the occupants with thermal comfort.
Discomfort glare can be basically achieved by controlling glazed facades systems. This has been done by studying the window placement and transmittance properties (Boyce, 2003). A study on occupants’ acceptance of a glass window stated that the transmittance of light and the color appearance of the light transmitted needed to be considered to achieve visual comfort (Boyce et al., 1995). Thus, the fraction of visible light transmitted through the glass, defined as visible light transmission (VLT), is concerned for achieving visual comfort.
The SHGC and the VLT play a key role in glazed facades’ performance with its effect on occupants’
comfort. Both features are mentioned in this study as a ratio of light-to-solar gain (LSG), which is the product of the VLT divided by the SHGC. To reduce solar heat load and utilize daylight, LSG is suggested as 1.20 – 1.60 (DEDE, 2016). This range was taken into account to classify the buildings to identify them by their glazing performance rating. The results were presented based on the building classes with the determination of their LSG, and the agreement on thermal comfort and discomfort glare was also discussed based on the building classes since it potentially influenced the occupants’ comfort.
Aim and Objective
This study aims to clarify the correlation between thermal comfort and discomfort glare based on the field study in office spaces in Bangkok, Thailand. The results of both comfort aspects were investigated and presented in terms of comfort indices (PMV and DGP) and the comfort vote from the occupants’ perspective (questionnaire survey).
The considerations on the performance rating of glazed facades (building classes) and the occupants’
sensation level (outside and inside comfort zone) were explored in this study.
For the brief introduction of this manuscript, as methodological approaches in this study depend on the post-occupancy evaluation, the section of methodologies describes the field investigation to collect the physical variables from on-site measurements and the subjective vote from questionnaire surveys, with the description of the statistical analysis and data classification for both physical and subjective variables. The section of results and discussions presents the overall collected data and the cross-analysis between the comfort indices and the comfort vote, with discussions on occupants’ sensation level and the criteria of glazing performance rating as the building classes. Lastly, the final section summarizes the agreement between thermal comfort and discomfort glare with its practical conclusion.
METHODOLOGIES
Brief Introduction of Case Study Buildings and Their Occupants Target Office Spaces
For this study, seven high-rise office buildings involving the operation of an air-conditioning system and located in Bangkok, Thailand (13° 44′ 12.1812″
N and 100° 31′ 23.4696″ E) were selected for the field investigation. All cases reflect the generic working environment of an open-plan layout with daylit spaces and side-lighted from glazed facades, which is commonly found in the urban context of Thailand.
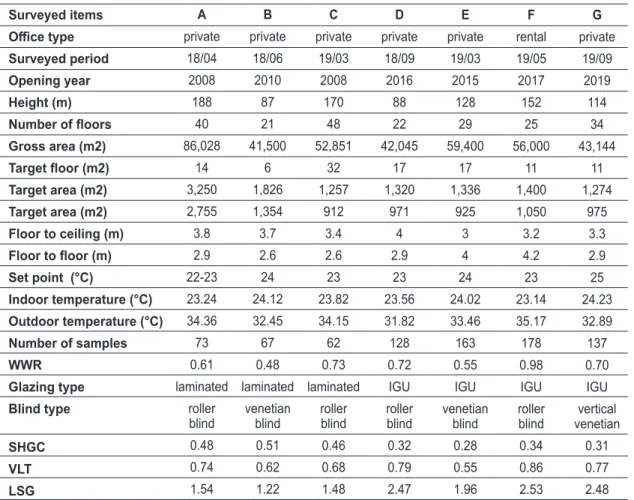
The field investigation was held for 3 – 5 days during working hours, from 8.00. to 17.00 h local time (UTC + 7), based on a collaboration between building stakeholders and occupants. The profiles and basic information of each are listed in Table 1.
Nakhara :Journal of Environmental Design and Planning 19 (2020)101
Target Occupants
This study mainly focused on working stations inside an open-plan space in the target floor, which served the largest number of occupants. Private office spaces or function rooms, such as meeting rooms, conference rooms, service facilities, or recreation spaces, were not included. The occupants in each building were invited to participate in the on-site survey. The target occupants were seated at certain positions in the occupied space. The seated direction of facing-to-window was selected in this study since the glare sensation from this direction had a higher potential of causing visual discomfort than the parallel-to-window direction (Suk, 2019). The actual furniture layouts included various directions to the building’s facades. Thus, the seats facing the building’s facades at 45° diagonal or less were considered to be in the facing-to-window direction (Osterhaus, 2019; Suk, 2019).
On-Site Survey and Data Collection
The field investigations were performed under the post-occupancy stage of the buildings. The on- site measurement by the installation of automatic data loggers involved collecting thermal variables for the PMV index. For the DGP index, a manual measurement was applied using a camera set with an illuminance sensor for HDR images. Meanwhile, the questionnaire survey was conducted alongside these measurement processes.
For subjective data collection, the occupants were asked to participate in a questionnaire survey twice a day, at a morning time and afternoon time. The typical office peak-day occupancy time is mainly distributed from 10.00 am to 11.00 am, and from 2.00 pm to 3.00 pm (ASHRAE 62.1, 2016). Thus, these peak scenarios are suitable for observing the consequences on the occupants in a particular
G private
19/09 2019 114
34 43,144
11 1,274
975 3.3 2.9 25 24.23 32.89 137 0.70 IGU vertical venetian 0.31 0.77 2.48 F
rental 19/05 2017 152
25 56,000
11 1,400 1,050 3.2 4.2 23 23.14 35.17 178 0.98 IGU roller blind 0.34 0.86 2.53 E
private 19/03
2015 128
29 59,400
17 1,336
925 3 4 24 24.02 33.46 163 0.55 IGU venetian
blind 0.28 0.55 1.96 D
private 18/09
2016 88 22 42,045
17 1,320
971 4 2.9
23 23.56 31.82 128 0.72 IGU roller blind 0.32 0.79 2.47 C
private 19/03
2008 170
48 52,851
32 1,257
912 3.4 2.6 23 23.82 34.15 62 0.73 laminated
roller blind 0.46 0.68 1.48 B
private 18/06 2010 87 21 41,500
6 1,826 1,354 3.7 2.6 24 24.12 32.45 67 0.48 laminated
venetian blind 0.51 0.62 1.22 A
private 18/04 2008 188
40 86,028
14 3,250 2,755 3.8 2.9 22-23 23.24 34.36 73 0.61 laminated
roller blind 0.48 0.74 1.54 Surveyed items
Office type Surveyed period Opening year Height (m) Number of floors Gross area (m2) Target floor (m2) Target area (m2) Target area (m2) Floor to ceiling (m) Floor to floor (m) Set point (°C)
Indoor temperature (°C) Outdoor temperature (°C) Number of samples WWR
Glazing type Blind type SHGC VLT LSG
Table 1: Basic information of the investigated case study office spaces
Nakhara :Journal of Environmental Design and Planning 19 (2020)102
situation. However, during the field investigations, some occupants started working at 10.00 am or later owing to the flexible working hour policy of their organizations. The specified times of 11.00 am and 3.00 pm had a higher potential to acquire feedback from answers in the survey. Thus, for physical data collection, the data set of thermal variables was derived (for PMV), and the manual measurement was conducted (HDR images study for DGP) following these target times to compare the results between comfort indices evaluation and the actual comfort vote from the occupants.
Thermal Comfort Index
The PMV can be predicted from environmental and physiological variables. To measure thermal environment variables, i.e., air temperature, mean radiant temperature (MRT), and humidity, a set of measuring devices (named as T&D TR-74, TR- 52) with a globe ball by diameter of 0.15 m., were installed at the working plane level or working partition level (approximately 1.10 m. from the floor) to investigate the air temperature, globe temperature, and humidity for the seated-occupant level. An anemometer (named as TL 1000) was also set on a tripod to measure the air velocity in each location. All the devices were set up in an automatic recording mode with time intervals of 1 minute. Approximately 9 – 10 measurement sets
were located in the occupied spaces, as shown in a simplified diagram in Figure 1. Each set represented a group of occupants (2-5 persons) sitting in the same working station or zoning depending on furniture layout, and only the occupants with the direction of facing-to-window were focused on in this study. For PMV calculation, the collected data were further derived by the target time of 11.00 am and 3.00 pm, which was the same time that the occupants were asked to rate their thermal sensation in the questionnaire survey.
MRT is defined as the uniform temperature of an imaginary uniform enclosure in which the radiant heat transfer from the human body equals the radiant heat transfer in the actual non-uniform environment.
In daylit spaces, the buildings usually have building facades made of glass. These glass windows receive plenty of heat gain from the incident solar radiation, which is transferred into the building with a non-uniform effect on the human body. When solar radiation is present, the PMV calculation must consider this load by including the solar load as an MRT calculation method. The measured air temperature, globe temperature, and air velocity can be combined to calculate the MRT. This is possible because Athienitis et al. (1992) have performed the experimental study of the effects of solar radiation on the indoor environment, and they presented its effects on the human thermal comfort in terms of globe temperature. Thus, MRT were calculated according to the equation in ISO 7726 ; MRT = [(GT
Figure 1:
Diagram showing the set-up of measuring devices in the occupied spaces
Nakhara :Journal of Environmental Design and Planning 19 (2020)103 + 273)4 + 2.5 × 10⁸ x va0.6(GT-Ta)]1/4 - 273, where GT
= globe temperature, va= air velocity and Ta= air temperature.
The occupant characteristics related to metabolic rate and clothing insulation were estimated from subjects’ clothing and their activities at the time of the survey. The metabolic rate was determined as 1.1 met by observing the occupant’s activity with typing on computer tasks, as mentioned in ASHRAE 55-2013. Clothing insulation values were derived from the questionnaire survey by applying the equation from ISO 9920 (2007); Icl = 0.161+0.835 ΣIclu, where Iclu is the effective thermal insulation according to the table of the insulation values of typical clothing ensembles.
Discomfort Glare Index
In this study, the DGP index used for discomfort glare evaluation can be generated from HDR image study from the manual measurement. A series of low dynamic range images (LDR) were captured using a Panasonic DMC-G1K digital single-lens reflex camera (DSLR) camera with a Lumix G F3.5 fisheye lens. The camera was placed vertically at the height of the eye level of the seated-occupant, approximately 1.20 m from the floor. The vertical illuminance was simultaneously measured using a LX-200SD light meter to calibrate the software- generated values from those HDR images. The set of the camera and the light meter was installed on an adjustable tripod facing the direction that was experienced by the occupants in the particular position, in an area nearby the occupants’ chair to maintain normal working conditions, as shown in a simplified diagram in Fig. 1. Meanwhile, the horizontal illuminance at desktop level was measured by the installation of an illuminance sensor (named as T&D TR-74), in an automatic recording mode with time intervals of 1 minute. Every seated occupant with the direction of facing-to-window was selected. All these processes started and collected data while the occupants were asked to rate their glare sensation vote in the questionnaire form at 11.00 am and 3.00 pm. After finishing at one seat position, the set-up was moved to the next position to start data collection with the others.
For the camera setting, fixed values of ISO at 100 and camera aperture at 4.0 were applied with 15 shutter speed values, namely, 1/6400, 1/4000, 1/2000, 1/1000, 1/640, 1/320, 1/150, 1/60, 1/20,
1/10, 1/3.2, 1/1.6, 1, 1.6, and 3.2 s, to represent a single sample of a seated occupant. To obtain HDR images, a practical way is to vary the captured LDR by increasing or decreasing the exposure value, which can be achieved by doubling or halving the shutter speed values. The more variations in exposure value obtained by setting the shutter speed, the more accurate the image processing of HDR achieved using the glare analysis software.
Overexposed and underexposed LDR images are required to cover the possible luminance range. For all practical considerations, relatively low shutter speed values were required to capture the proper contrast with a significantly bright scene in this study. The decision to let electric lighting be turned on was also taken by Hirning et al. (2013). Pilot experiments in his study suggested that turning the electric lighting off did not significantly influence the luminous environment. Even though electric lighting caused a relatively bright scene, they were located above the line of sight and had a much smaller size compared to the daylight source. However, the controlled patterns of electric lighting with the shading devices usage that were managed freely depended on the occupants’ behavior to maintain their normal working conditions during the field survey.
All the LDR images were stored in a RAW file format.
The images were then post-processed using the Aftab Alpha software to create HDR images and to evaluate the DGP with the detection of glare sources by the Evalglare interface, which was a graphical user interface developed by the Fraunhofer Institute in Germany (Miri, 2012). Since the seat positions in this study were prioritized based on the direction facing-to-window, which were likely to experience excessive brightness from the transmitted solar radiation, in such cases, vertical illuminance could be useful as a reference parameter for calibration (Inanici, 2003), with its strong correlation to the DGP (Wienold et al., 2009) in order to validate the software-generated values from HDR images.
Aftab Alpha featured an option for calibration using vertical illuminance. Figure 2 illustrates the comparison between the image-calculated vertical illuminance after software-processing and the measured vertical illuminance from the field survey using a linear regression model. The correlation between these values is strong (R2 = 0.931). The differences between the software-generated data and measured data are negligible. Therefore, the accuracy of DGP is reliable for further analysis, which is used to analyze based on the subjective vote by the occupants.
Nakhara :Journal of Environmental Design and Planning 19 (2020)104
Occupant Comfort Vote Evaluation
The survey measured occupants’ comfort in an anonymous paper-based questionnaire given to 808 samples. The occupants were asked to answer or rate the level for the same set of questions at 11:00 am and 3:00 pm. Their responses could be divided into subjective and objective variables. The objective variables aimed to collect personal data (including personal clothing for PMV calculation by individual seated-occupants), with the identification number of each. Meanwhile, the subjective variables referred to sensation and satisfaction vote from them. The questions were structured as follows:
1. Time and date of survey, identification number of the questionnaire, and seat position
2. Personal data (asking about age/gender/weight/
height/clothing)
3. The subject’s thermal satisfaction vote (discomfort/
slight discomfort/moderate/slight comfort/comfort) 4. The subject’s thermal sensation vote (very cold/cold/
cool/slight cool/neutral/slight warm/warm/hot/very hot) 5. The subject’s visual satisfaction vote (discomfort/
slight discomfort/moderate/slight comfort/comfort) 6. The subject’s glare sensation vote (imperceptible/per-
ceptible/disturbing/intolerable)
The answers to sensation vote, i.e. thermal sensation vote (TSV) and glare sensation vote (GSV), were selected for further analysis as it reflected the same sensation scale as the comfort
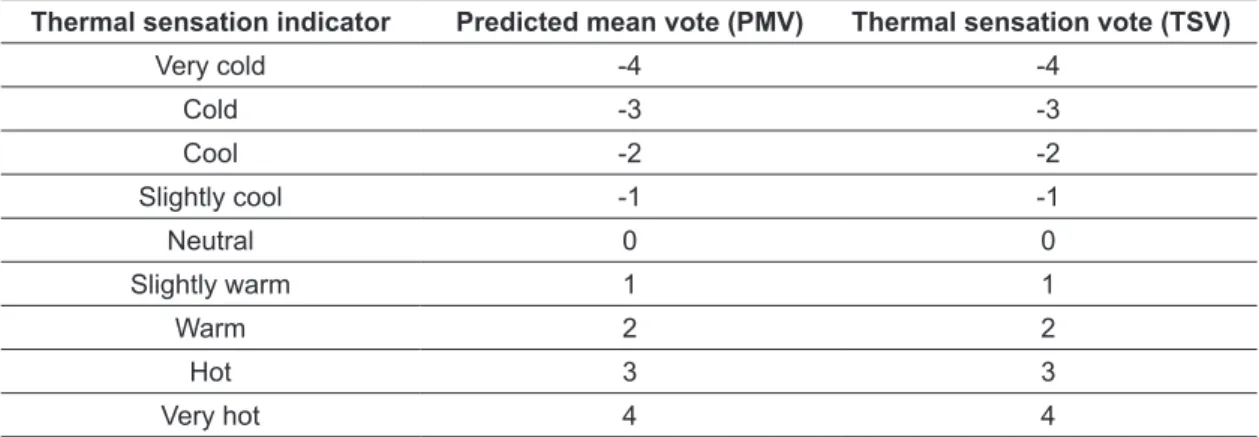
indices semantic interpretation. To investigate the thermal comfort of the occupants, the TSV was determined with respect to the 7-point thermal sensation scale from the ASHRAE 55 (2013), ranging from -3 (cold) to +3 (hot) with the midpoint of 0 as a neutral sensation. However, to offer a further possibility of occupants’ expression in the survey, the endpoint of extreme rating scale was modified (Carlucci et al., 2015), allowing answers on a 9-point scale, which ranged from -4 (very cold) to 4 (very hot). The answering scale of sensation vote was paralleled with the interpretation of PMV for the comparison purpose in the further analysis, as listed in Table 2.
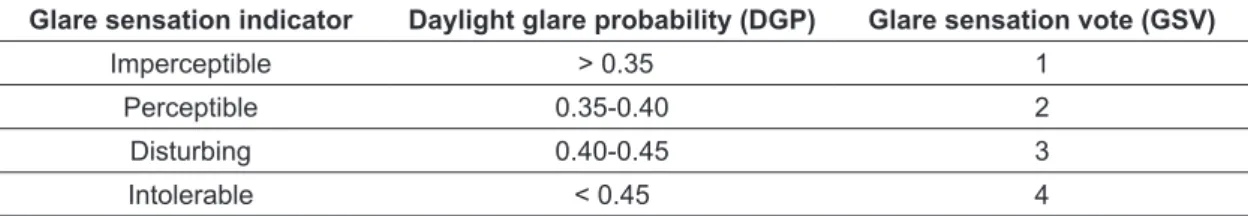
For discomfort glare evaluation, Wienold et al. (2009) stated that in the range of the DGP index, values <
0.35 are perceived as imperceptible, between 0.35 and 0.40 are perceptible, and between 0.40 and 0.45 are disturbing, and values > 0.45 are intolerable.
Meanwhile, the level of glare perception can be measured with a glare sensation vote (GSV) (Iwata et al., 1998) in the questionnaire survey, and the answers refer to a 4-point scale, similar to the sensation levels of the DGP, with the predefined criteria as: 1 = imperceptible, 2 = perceptible, 3 = disturbing, and 4
= intolerable. Thus, the answering scale of the glare sensation vote was paralleled with the interpretation of DGP for the comparison purpose in the further analysis as well, as listed in Table 3.
The questionnaire survey for each participant was conducted at the same time as all the on-site measurement processes in a particular position. The survey was required to be completed as quickly as possible. All participants answered the questions by filling out the questionnaire on a paper form. Answers to questions related to indoor environmental conditions were given in checkbox format. The answers were then scored to indicate the subjective responses of the occupant. The group membership was coded with a hidden dummy variable, and the correlation test between these variables was performed as described in the latter section.
Classification of Surveyed Data and Statistical Tests
Based on the above-mentioned introduction, the correlation between thermal comfort and discomfort glare was explored with considerations on the performance rating of glazed facades and the occupants’ sensation level. The criteria to classify the data set were illustrated in this section.
Figure 2:
Scatter plots of vertical illuminance from image-calculated in software-processing and on-site measurement
Nakhara :Journal of Environmental Design and Planning 19 (2020)105 In given buildings, they could be categorized based
on their glazing performance rating as building classes. Generally, it can be seen that three buildings (A, B, and C) were covered with laminated glass units. Meanwhile, the other four buildings were covered with insulated glass units (IGU).
Furthermore, the glazing performance rating of them could be distinguishably observed within these glass types. DEDE (2016) suggested the recommended range of LSG to be 1.20 – 1.60. From the basic information in Table 1, all those buildings could be classified into two groups based on their LSG.
The group with laminated glass units (A, B, and C) was the qualified-buildings (LSG as 1.22 – 1.54).
Meanwhile, the group with insulated glass units (D, E, F, and G) was marked as the over-qualified buildings (LSG as 1.96 – 2.53). Thus, among these buildings, the two groups can be denoted as class A and class B, respectively. It is important to note that this criterion was not a time-based citation, even though the buildings were constructed before the LSG recommendation had been issued (2016). They were practically classified corresponding to their glazing performance rating. In the further analysis, the collected data of the two building classes were
homogeneous in terms of the number of buildings, and individual in terms of occupants’ responses featured in each, and the results were presented and discussed based on the building classes.
As the perception of discomfort glare was found to vary with the perceived temperature (Garretón et al., 2016), the group of occupants in this study was classified based on their sensation level. The comfort indices evaluation (PMV and DGP) and the sensation vote (TSV and GSV) were considered, and they were then grouped for statistical analysis. For the group of thermal sensation, the data set was assumed to be a nominal response by simplifying to a nominal form.
The ASHRAE 55 (2013) thermal sensation scale was used as a reference to categorize the sensation level as inside (neutral) and outside (cool or warm) comfort zone. PMV values below −0.5, equal to or within −0.5 to 0.5, and above 0.5 were classified as ‘‘cooled-sensation,” “neutral-sensation,” and
“warmed-sensation,” respectively. Meanwhile, TSV values equal to or below −1, equal to 0, and equal to or above 1 were classified as ‘‘cooled-sensation,”
“neutral-sensation,” and “warmed-sensation,”
respectively.
Table 2: Interpretation of thermal sensation scale by the index as predicted mean vote (PMV) and thermal sensation vote (TSV)
Thermal sensation indicator Predicted mean vote (PMV) Thermal sensation vote (TSV)
Very cold -4 -4
Cold -3 -3
Cool -2 -2
Slightly cool -1 -1
Neutral 0 0
Slightly warm 1 1
Warm 2 2
Hot 3 3
Very hot 4 4
Glare sensation indicator Daylight glare probability (DGP) Glare sensation vote (GSV)
Imperceptible > 0.35 1
Perceptible 0.35-0.40 2
Disturbing 0.40-0.45 3
Intolerable < 0.45 4
Table 3: Interpretation of glare sensation scale by the index as daylight glare probability (DGP) and glare sensation vote (GSV)
Nakhara :Journal of Environmental Design and Planning 19 (2020)106
For the group of glare sensation, the data set were assumed to be a binominal response by simplifying to a binary form (Karlsen et al., 2015).
Wienold et al. (2009) proposed the border of glare- imperceptible as a DGP below 0.35. However, this study found a preference for lower DGP than the recommended values. Thus, based on the field- investigation concerning the occupants’ responses, DGP values below 0.25, and equal to or above 0.25, were classified as “glare-imperception” and
“glare-perception,” respectively (addressed in detail in sub-section: Applicability of Comfort Indices and Comfort Vote). Lastly, for the GSV, the study on discomfort glare by Mangkuto et al. (2019) determined the threshold of comfort–discomfort as the midpoint of the GSV scale, 2.5. Therefore, GSV values below 2.5 and above 2.5 were classified as “glare-imperception” and “glare-perception,”
respectively. The surveyed data with considerations on the building classes and the sensation levels were presented in terms of descriptive statistics.
For the statistical significance in each class, the GSV and TSV values were compared using a Wilcoxon test. Meanwhile, the DGP, PMV, and cross analysis values were compared using a paired t-test.
Besides, the physical environmental variables were tested using the Kolmogorov–Smirnov. To clarify the correlation between the data set, for each statistical influence tested, a power analysis was performed, and the effect size was calculated. Spearman rank correlation and Pearson’s correlation coefficient were used to estimate the correlation. The interpretation of the outcome was derived as benchmarks for
“very small,” “small,” “moderate,” “strong,” and “very strong” effect sizes (X ≥ 0.00, 0.20, 0.40, 0.60, and 0.80, respectively); the values lower than 0.20 can be considered negligible.
RESULTS AND DISCUSSIONS Basis Information of Comfort Indices and Comfort Vote
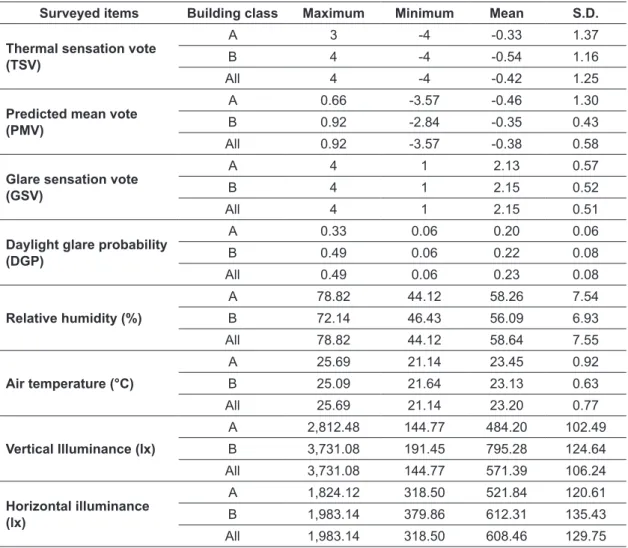
From a total of 808 surveyed samples, 202 samples were classified as class A, and 606 as class B, based on their glazing performance rating. Table 4 presents the descriptive statistics of TSV, PMV, GSV, and PMV, with the measured data. The normality of physical variables was evaluated using the Kolmogorov–Smirnov test. The results showed that the variables used in the statistical analyses were
reasonably normally distributed. Their mean and standard deviation (S.D.) revealed that all variables presented consistency.
All the participants in this study were Thai employees.
It was observed that the majority (58.13%, i.e., 470 participants) were in their early thirties, with a median age of approximately 31 years, and participants dominated the late-twenties age group.
The distributions of gender were approximately equal, with a higher number of female occupants (58.87%, i.e., 475 samples). Most of them (90.79%, i.e., 733 participants) performed their work based on a computer task. These characteristics were reflected in the demography of the occupants in this study.
The open-plan space could utilize daylight abundantly. However, during the survey, the occupants usually lowered, and kept internal shading devices in the down-position to maintain their own comfort (Chaiyapinunt et al., 2013). Its partially covering patterns resulted in a low rate of heat transferring (Chaiyapinunt et al., 2014), and daylight obstruction (Chaloeytoy et al., 2018).
It should be noted that the results in this study represented under shading situations or when occupants unconsciously shaded. For thermal environments, the air temperature revealed a low rate compared to the local recommended set-point at 25 °C (DEDE, 2016), and the recommended range of neutral temperature for occupants in the air-conditioned offices in tropic regions as 25.6 – 26.4 °C (Damiati et al., 2016). This thermal condition led to the thermal comfort evaluation that TSV and PMV were in a comfortable range, with most occupants’ sensation falling into slightly cool owing to their negative values, especially the occupants in class B. A possible explanation can refer to the high occlusion rate with its reduction of solar heat gain, and the low temperature set-point as presented in Table 1. For the building with a higher performance of glazed facades, it can be observed that the thermal environments in class B were more stable compared with class A, given that their TSV and PMV values present a smaller gap with lower S.D.
For the lighting environment, the electric lighting was turned on as usually practiced throughout the day without any control from the building management team or the occupants, except office G, which automatically turned off during the lunchtime break in accordance with the energy-saving policy by their organization. The personal task light could be
Nakhara :Journal of Environmental Design and Planning 19 (2020)107 found in some seat positions. However, it was not
switched on during the survey period. In general, the horizontal illuminance at the desktop level, which mainly depended on the electric lighting on the ceiling, ranged within the local recommendation at 500 – 1,000 lux (TIEA, 2016). Meanwhile, for the vertical illuminance at the eye level, the high rate of shading devices occlusion led it to be below the discomfort threshold at 2,670 lux (Chan et al., 2015), and mostly smaller than 1,479 lux, which could be considered comfortable based on the suggestion of Suk (2019) for the seated position with facing-to-window direction. For the discomfort glare evaluation in both classes, the mean GSV values were below 2.5 and the DGP presented below 0.35, which could be perceived as glare- imperceptible. However, the higher GSV and DGP
could be observed in class B since the distribution of horizontal and vertical illuminance was higher. A possible explanation could be found in the glazing performance rating information in Table 1 since the class B building was designed with a larger glazing area (WWR), with a higher VLT rate. A large amount of daylight accessed into interior spaces, and it fell directly to the desktop and the human eyes rather than that in class A. From the survey, the comfort evaluation revealed comfort conditions for both thermal comfort and discomfort glare. Most of the occupants in this study were found to be within their comfort zone. In this section, all the comfort indices and comfort votes are presented separately to describe their general patterns. Their interactions are discussed in the latter section.
Table 4: Descriptive statistics of the thermal comfort and discomfort glare variables
Surveyed items Building class Maximum Minimum Mean S.D.
Thermal sensation vote (TSV)
A 3 -4 -0.33 1.37
B 4 -4 -0.54 1.16
All 4 -4 -0.42 1.25
Predicted mean vote (PMV)
A 0.66 -3.57 -0.46 1.30
B 0.92 -2.84 -0.35 0.43
All 0.92 -3.57 -0.38 0.58
Glare sensation vote (GSV)
A 4 1 2.13 0.57
B 4 1 2.15 0.52
All 4 1 2.15 0.51
Daylight glare probability (DGP)
A 0.33 0.06 0.20 0.06
B 0.49 0.06 0.22 0.08
All 0.49 0.06 0.23 0.08
Relative humidity (%)
A 78.82 44.12 58.26 7.54
B 72.14 46.43 56.09 6.93
All 78.82 44.12 58.64 7.55
Air temperature (°C)
A 25.69 21.14 23.45 0.92
B 25.09 21.64 23.13 0.63
All 25.69 21.14 23.20 0.77
Vertical Illuminance (lx)
A 2,812.48 144.77 484.20 102.49
B 3,731.08 191.45 795.28 124.64
All 3,731.08 144.77 571.39 106.24
Horizontal illuminance (lx)
A 1,824.12 318.50 521.84 120.61
B 1,983.14 379.86 612.31 135.43
All 1,983.14 318.50 608.46 129.75
Nakhara :Journal of Environmental Design and Planning 19 (2020)108
Applicability of Comfort Indices and Comfort Vote
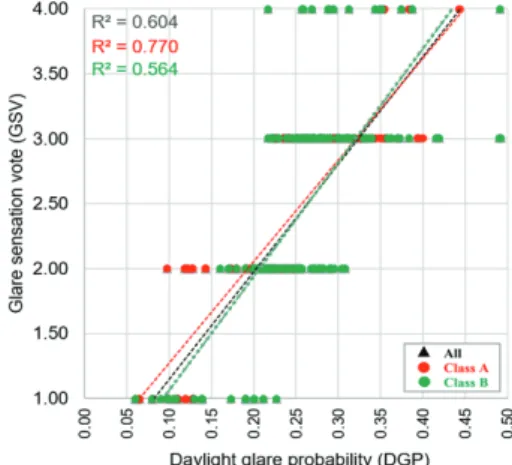
Concerning the usability of the comfort indices, linear regression models were applied with TSV–PMV and GSV–DGP. The subjective votes were paired with their corresponding comfort indices values obtained from the on-site measurement processes. It can be seen from the results of the TSV against the PMV values in Figure 3 that the correlation reaches a small significant level, with a small coefficient of determination (R2 = 0.203). This result is similar to the field study on thermal comfort in healthcare buildings in Thailand (Sattayakorn et al., 2019), which found discrepancies in PMV and thermal sensation vote of the local occupants, especially for out-patients staying in an open-planned area. In contrast, the comparison of GSV–DGP in Figure 4 outperformed, showing a reasonable significant level (R2 = 0.604), particularly for class A (R2 = 0.770).
This evidence leads to the finding that the PMV is mismatched in order to evaluate the thermal comfort of the occupants. A thermal prediction by the PMV model may not be applicable in the post-occupancy evaluation under the contextual study. Meanwhile, the accuracy of the DGP is trustable to describe the glare sensation of local occupants.
The usability of the DGP was responsible for the glare sensation vote by the occupants. However, from the linear regression model in Figur 4, the linear equation of all building classes (y = 8.2851(x) + 0.318) reveals the border of “glare-imperception” and
“glare-perception” (as the midpoint of the GSV-scale at 2.5) at the DGP of 0.26. It can be inferred that the occupants start to be disturbed by discomfort glare at the DGP 0.26 or above, even though the DGP below 0.35 can be perceived as glare-imperceptible (Wienold, 2009). This turnover point reveals a similar trend to discomfort glare studies obtained in Indonesia (Mangkuto et al., 2019) and in Malaysia (Hirning et al., 2016), which suggest the intolerable threshold to be below 0.26. The threshold value found in this study strongly agrees with the findings in those studies. Thus, from the agreement in the tropical context study, it can be concluded that Thai occupants prefer a lower level of the DGP as the field study reveal their visual sensitivity to discomfort glare, giving a possible explanation that several samples with lower DGP than 0.35 were responded with glare sensation vote by the occupants.
As the current border of each glare sensation level, that is, imperceptible–perceptible, perceptible–
disturbing, and disturbing–intolerable, mismatch the occupants’ responses. There is a fair possibility to lower the DGP threshold, and their reference values must be revised in accordance with the local requirements. With respect to the analysis of Wienold et al. (2009) by means of the occupants’
assessment in his study, the data set from both building classes are homogenous to highlight the threshold values of glare sensation in this study.
Figure 5 illustrates the occupants’ responses rank including the median, first, and third quartiles based on each level of glare sensation vote against the
Figure 3:
Scatter plots of thermal sensation votes (TSV) with their corresponding predicted mean vote (PMV)
Figure 4:
Scatter plots of glare sensation votes (GSV) with their corresponding daylight glare probability (DGP)
Nakhara :Journal of Environmental Design and Planning 19 (2020)109 DGP values, mapped with the linear regression
model of their mean values (blue dot). According to the plot of the mean values, a strong correlation can be found in the increment of DGP by each sensation level. The linear equation (y = -0.0107(x) + 0.2454) reveals the border of perceptible–disturbing (marked as the border of comfort-discomfort (Karlsen et al., 2015)) at the DGP of 0.24, which is comparable to the finding turnover point in Figure 4 (DGP of 0.26).
Thus, it can be inferred that the occupants start to be disturbed by discomfort glare at the DGP range of 0.24–0.26. For further analysis, therefore, their mean value at the DGP of 0.25 was selected to classify the occupants’ sensation level as “glare-imperception”
and “glare-perception”.
Correlation between Thermal Comfort and Discomfort Glare Variables
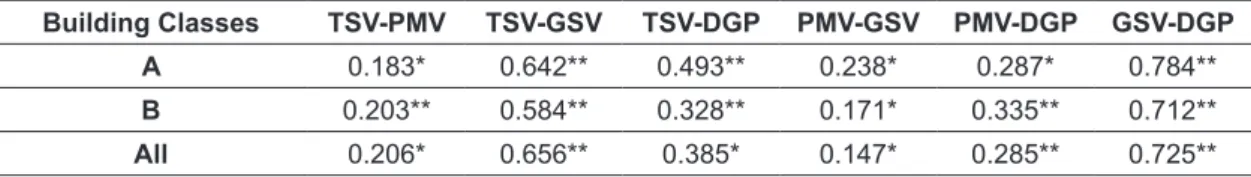
For the cross-analysis, the correlation of thermal comfort and discomfort glare is presented based on the correlation test, as presented in Table 5. The GSV and TSV were compared using a Wilcoxon test.
The DGP, PMV, and cross analysis were compared using a paired t-test, which showed a statistically significant difference in both values among classes.
The Pearson correlation coefficient was used to measure the correlation of a linear association
between the subjective answers and the comfort indices. Meanwhile, the Spearman rank correlation coefficient tests were performed within each category of the subjective answers. The presence of a perfectly positive correlation in every variable reveals an inclined-trend to each other, that is, when the thermal comfort increased, the discomfort glare increased, simultaneously. The strong correlation is mainly distributed into the test of comfort indices or the comfort vote, separately. Meanwhile, a smaller correlation can be found between them.
The strongest correlation is observed for GSV–DGP, especially for class A. These results agree with the concordance of the discomfort glare evaluation in Figure 4. For the cross-analysis between thermal comfort variables and discomfort glare variables, a notable correlation can be observed by the comfort vote from the questionnaire survey. The TSV has a relevant influence on GSV, particularly for class A. Furthermore, as a correlation between GSV- DGP was found, it is a fair explanation to assume that the TSV may affect DGP as well. However, TSV reasonably influences DGP only for class A.
Additionally, the invalid trend can be found in the tests subjected to PMV, as they hardly entail both a thermal comfort and discomfort glare variables.
These results indicate that PMV is unsuitable for the post-occupancy evaluation in the contextual study, similar to the result in Figure 3, which reveals the discrepancy of TSV–PMV. Thus, the PMV is excluded for the further analysis.
Figure 5:
The grouped box charts present the occupants’ rank of glare sensation vote (GSV) mapped with the linear regression model of their mean DGP values
Nakhara :Journal of Environmental Design and Planning 19 (2020)110
As the comfort vote outperformed the comfort indices evaluation, the TSV and GSV were selected as the main criteria to summarize the data set based on their opposite sensation. The descriptive statistics of surveyed data were tabulated based on their building classes and sensation scale in Table 6 and Table 7. It can be observed that the TSV gradually increases along with the discomfort glare variables (GSV and DGP), as shown in Table 6, and the same trend can be found in Table 7. These results are further evidence to indicate the agreement between
both comfort aspects. Furthermore, it is important to note that the comfort vote is highly required for the comfort evaluation method since TSV and GSV perform effectively, and they outperform the comfort indices in terms of human sensation predictions.
Since the agreement of thermal comfort and discomfort can be recognized as a consistent variation, to explore this issue, the linear regression analysis was applied with the mean values of each variable based on their building classes and Table 5: The correlation test on thermal comfort variables and discomfort glare variables
Building Classes TSV-PMV TSV-GSV TSV-DGP PMV-GSV PMV-DGP GSV-DGP
A 0.183* 0.642** 0.493** 0.238* 0.287* 0.784**
B 0.203** 0.584** 0.328** 0.171* 0.335** 0.712**
All 0.206* 0.656** 0.385* 0.147* 0.285** 0.725**
** significant level < 0.01
* significant level < 0.05
Table 6: Descriptive statistics of the discomfort glare variables based on their corresponding thermal sensation level
Very
cold Cold Cool Slightly
cool Neutral Warm Slightly
warm Hot Very hot
GSV A n 2 13 24 38 88 24 11 7 -
Mean 1.50 1.77 1.88 2.05 2.35 2.29 3.09 2.71 -
S.D. 0.50 0.42 0.33 0.32 0.52 0.54 0.51 0.70 -
B n 11 30 64 115 338 25 9 7 2
Mean 1.82 2.10 2.03 2.39 2.14 2.96 3.00 3.00 3.50 S.D. 0.39 0.54 0.43 0.54 0.39 0.77 0.67 0.00 0.50
All n 13 43 88 153 426 49 20 14 2
Mean 1.66 1.93 1.95 2.22 2.25 2.63 3.05 2.86 3.50 S.D. 0.44 0.48 0.38 0.43 0.46 0.66 0.59 0.35 0.50
DGP A n 2 13 24 38 88 24 11 7 -
Mean 0.13 0.17 0.18 0.27 0.23 0.24 0.32 0.28 -
S.D. 0.02 0.05 0.04 0.05 0.05 0.08 0.08 0.06 -
B n 11 30 64 115 338 25 9 7 2
Mean 0.17 0.20 0.20 0.23 0.22 0.29 0.35 0.35 0.40 S.D. 0.06 0.05 0.05 0.04 0.04 0.05 0.07 0.08 0.10
All n 13 43 88 153 426 49 20 14 2
Mean 0.15 0.19 0.19 0.20 0.23 0.26 0.34 0.32 0.40 S.D. 0.04 0.05 0.04 0.05 0.04 0.06 0.08 0.07 0.10
Nakhara :Journal of Environmental Design and Planning 19 (2020)111 Table 7: Descriptive statistics of the thermal comfort variables based on their corresponding discomfort
glare sensation level
imperceptible perceptible disturbing intolerable
TSV A n 71 106 21 4
mean -1.63 -0.61 0.54 2.33
S.D. 1.36 1.25 0.98 0.47
B n 101 368 122 15
mean -2 -0.58 -0.23 0.86
S.D. 1.36 1.02 1.37 1.14
All n 172 474 143 19
mean -1.81 -0.59 0.15 1.61
S.D. 1.36 1.14 1.18 0.80
sensation scale. TSV, GSV, and DGP were selected for the prediction model of their effect on the opposite sensation. The effect of TSV on discomfort glare variables in Figure 6 and 7 indicate that every 1 unit of TSV scale responds to an increment of 0.21 and 0.03 unit in GSV and DGP, respectively. On the contrary, the increment of TSV can be predicted by GSV using the model in Figure 8. Every 1 unit of GSV scale responds to the increment of 1.01 unit in TSV. The results in Figure 6 and 8 are similar to the correlation test in Table 6 and Table 7, in which the strong correlation can be found from the comfort vote, as TSV and GSV. The prediction model can be applied with the DGP as well, as Figure 9 shown.
However, only class A is highlighted as its reasonable correlation. It can be observed that every 0.01 unit of DGP responds to an increment of 0.03 unit of TSV.
As the cross-analysis models reveal the correlation between thermal comfort and discomfort glare,
there is a fair chance to deduce that the occupants who experience higher thermal conditions are likely to perceive the higher discomfort glare conditions, since each sensation scale determined by their corresponding opposite comfort aspects is presented with a reasonable trend in Figure 6 to 9. Concerning the building classes, both reveal a good correlation.
However, it needs to be noted that, from all models, the stronger correlation can be found in class A due to the higher coefficient of determination. The class A outperforms to describe its agreement, particularly for the comfort vote as TSV and GSV. Thus, the correlation between thermal comfort and discomfort glare seems to be found stronger in the building with a lower glazing performance rating. This issue is further discussed in the latter section.
Focusing on sensation level, for the prediction model in Figure 6 and 7, the neutral-sensation (thermal sensation is 0) can be read as GSV of 2.45 and
Figure 6:
Scatter plot showing the effect of thermal sensation level on glare sensation vote (GSV)
Figure 7:
Scatter plot showing the effect of thermal sensation level on daylight glare probability (DGP)
Nakhara :Journal of Environmental Design and Planning 19 (2020)112
DGP of 0.27, respectively, which is almost identical to the border of “glare-imperception” and “glare- perception”, marked in this study (GSV = 2.50 and DGP = 0.25). Meanwhile, in Figure 8 and 9 (only for class A), the turnover point of glare sensation can be read as TSV of -0.28, and TSV of -0.18, respectively, which is comparable to the thermal neutral-sensation as 0. These findings indicate that the occupants who were inside their thermal comfort zone were likely to achieve visual comfort since their responses were revealed in the same stage. Achieving both can be considered as a consistent experience for the occupants.
The occupants who were outside their thermal comfort zone were explored since they could be affected by glare perception (Garretón et al., 2016).
It was described based on sensation level. Data sets were grouped by the interpretation of simplifying into nominal or binary form based on sensation level, as mentioned in detail in the methodologies section. For thermal comfort variables, TSV was selected as a criterion to classify thermal sensation levels as “cooled-sensation” ‘‘neutral-sensation” and
“warmed-sensation”. For discomfort glare variables, both GSV and DGP were considered. However, since the preference of lower DGP was found, the current threshold values were unsuitable to classify the sensation level. Thus, it was roughly classified as “glare-imperception” and “glare-perception” by the threshold values mentioned in sub-section:
Applicability of Comfort Indices and Comfort Vote (GSV=2.5 and DGP=0.25). Both classifications of the sensation levels were presented together in a percentage stacked bar. Figure 10 shows the thermal sensation levels based on their corresponding glare sensation levels. The percentage of glare- perception can be observed higher when the thermal sensation level increases out of the comfort zone
as warmed-sensation. On the contrary, Figure 11 shows the discomfort glare sensation levels based on their corresponding thermal sensation levels.
The percentage of warmed-sensation is also higher when discomfort glare sensation levels keep rising out of comfort zone as glare-perception. These results also indicate that the perceived temperature affected discomfort glare perception, or it can be said that discomfort glare perception affected perceived temperature, which is more evidence to confirm the agreement on thermal comfort and discomfort glare found in this study.
Multiple regression analysis was performed based on this group of sensation levels. TSV was considered as a dependent variable, and the GSV and the DGP were independent variables. The group of the outside comfort zone as “cooled-sensation” and “warmed- sensation” were highlighted. The overall analysis of both building classes reached a significant level (class A: F = 4.109, p-value = 0.027) (class B: F = 4.055, p-value = 0.034). However, It could reach a higher level by focusing on their sensation level as cooled-sensation (class A: F=7.022, p-value = 0.007) (class B: F=6.872, p-value = 0.021), and warmed- sensation (class A: F = 7.925, p-value = 0.008) (class B: F = 7.583, p-value = 0.010). From Figure 10 and 11, it can be seen that the cooled-occupants have a lesser effect from discomfort glare. Meanwhile, the warmed-occupants are mostly affected by discomfort glare, with the presence of glare-perception from GSV and DGP at 68.15 % and 78.62%, respectively.
In the test room study on the correlation of TSV and DGP with GSV in Argentina (Garretón et al., 2016), the correlation between TSV and DGP was only found when the person was inside thermal comfort zone. However, the post-occupancy evaluation in this study helps expand other possibilities in the tropical context. The results show that the correlation Figure 8:
Scatter plot showing the effect of glare sensation level on thermal sensation vote (TSV)
Figure 9:
Scatter plot showing the effect of daylight glare probability (DGP) and thermal sensation vote (TSV)
Nakhara :Journal of Environmental Design and Planning 19 (2020)113 can be observed stronger in the occupants who
were outside their thermal comfort zone, and their perception of discomfort glare could be affected since those with a warmed sensation experienced a higher DGP, and responded in higher GSV. As the agreement on thermal comfort and discomfort glare was revealed, it is necessary to study them separately as well as their interactions to enhance the comfort evaluation method, with the improvement on understanding of occupants’ comfort.
Consideration of Glazed Facades on Occupants’ Comfort
As the glazed facades strongly influence occupants’
comfort, thermal comfort needs to be considered besides the heat transmission in selecting a proper type of glass (Chaiyapinunta et al., 2005;
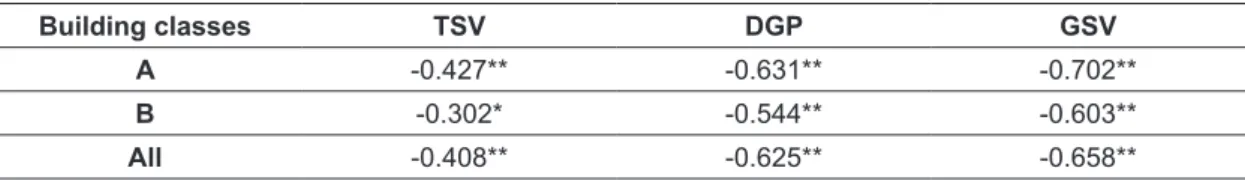
Chaiyapinunta et al., 2009). Using a material with low visible light transmittance can effectively reduce discomfort glare from the glazed facades source (Fangshi et al., 2013). The consideration on building classes with their glazing performance rating is mentioned in this section. Furthermore, the impact of glazed facades on occupants’ comfort is basically described based on their seat position since it depends on room geometry, obviously, the closer a person, the greater the impact on comfort (Huizenga et al., 2006). The correlation test between comfort variables and distance from the window (m.) was performed using the Pearson correlation coefficient,
referring to the building classes. The results present in negative values and were statistically significant in all tests, as shown in Table 8. The closer the seat position is to a glazed façade, the larger the values of comfort indices and sensation vote were, compared to the inner area. Thus, to describe the correlation between thermal comfort and discomfort glare in this section, their agreement was described based on the building classes as well as the distance from the window.
The mean values of the comfort variables, i.e. TSV, DGP, and GSV, were summarized and ordered based on their corresponding distance from the window at the particular positions in every interval unit of 0.10 m., concerning their classes as class A and class B, as illustrated in Figure 12 and 13.
It can be seen that the occupants sitting nearby were likely to perceive higher indoor environmental conditions than those in the inner area, and they also responded to a higher TSV and GSV. All the variables revealed the same pattern for both classes.
These results agree with the computer-based study on occupants’ comfort in Singapore, which revealed that the same pattern of PMV and DGP correlated to the transmitted solar radiation (Fangshi et al., 2013).
When the discussion on glazing performance rating is held, for class B, the TSV maintained almost the same condition for every distance, even though the GSV and DGP continued to decrease by a further distance. Thus, the correlated trend in class B was only valid in the area near the glazed facades, and Figure 10:
Percentage stacked bar of glare sensation based on thermal sensation level (TSV)
Figure 11:
Percentage stacked bar of thermal sensation based on glare sensation level (GSV, DGP)
Nakhara :Journal of Environmental Design and Planning 19 (2020)114
gradually contradicted in the inner area. Unlike class A, both the thermal comfort and discomfort glare variables revealed the same trend in every distance. According to these geometric patterns with solar radiation, it can be seen that the correlation between thermal comfort and discomfort glare is found depending on the glazing performance rating of the buildings. The agreement in class B, denoted as an over-qualified glazing performance rating with an insulated glass unit, could be observed smaller than that in class A, denoted as a qualified glazing performance rating with a laminated glass unit. A stronger correlation can be found in the building with lower glazing performance.
Figure 14 and 15 shows the mean values of indoor environmental variables, i.e. air temperature (referred to thermal comfort) and vertical illuminance (referred to discomfort glare), to represent their conditions in different seat positions. They were
summarized and plotted against their corresponding distance from the window at the particular positions, in every interval unit of 0.10 m., referring to the building classes. The same trend can be observed with the comfort variables in Figure 12 and 13.
According to the transmitted solar radiation, the buildings covered with lower glazing performance rating, or class A, allowed both of the solar heat and daylight access into occupied spaces. Thus, the stronger correlation between air temperature and vertical illuminance by the further distance can be observed. Meanwhile, the buildings covered with a higher performance glazing rating, or class B, resulted in a smaller difference in air temperature for the further distance due to the lower heat transferring rate of their glazed facades (SHGC), as listed in Table 1. Moreover, the solar heat load had a smaller influence on thermal environments, which were more stable compared to those in class A, and were not varied on the vertical illuminance distribution. These results are also similar to the Table 8: The correlation test on distance from the window and comfort variables
Building classes TSV DGP GSV
A -0.427** -0.631** -0.702**
B -0.302* -0.544** -0.603**
All -0.408** -0.625** -0.658**
** significant level < 0.01
* significant level < 0.05
Figure 12:
Scatter plot showing glare sensation vote (GSV) and thermal sensation vote (TSV) based on the distance from the glazing window.
Figure 13:
Scatter plot showing daylight glare probability (DGP) and thermal sensation vote (TSV) based on the distance away from the glazing window.
Nakhara :Journal of Environmental Design and Planning 19 (2020)115 results obtained in sub-section: Correlation between
Thermal Comfort and Discomfort Glare Variables, which revealed a stronger correlation in class A. As a result, it can be concluded that the agreement on thermal comfort and discomfort glare accompany with the consideration on glazing performance rating, in which the buildings with lower glazing performance can be found stronger.
In practical terms, the main thermal functions of daylight need to be controlled for heat transmission, and daylight utilization is a delicate balance between brightness and temperature. It is a challenge for researchers or designers to carefully concern both when a discussion on occupants’ comfort is taken with glazing material selection. High-performance glazing, such as that in class B buildings, may provide thermal conditions effectively, but it may be ineffective for interior lighting conditions.
Concerning the discomfort glare variables, the DGP of both classes is comparable. Meanwhile, the GSV in class B is higher, as listed in Table 2. The high-performance glazing material is restricted by the high VLT rate to access daylight to contribute positively to the occupant’s health and to reduce the electrical light load due to daylight utilization.
From Table 1, class B buildings were designed with a high glazing area (WWR) and high VLT. However, from the field survey, the finding in this study shows that the occupants in Thailand prefer a lower level of DGP than the current recommendations, which is also revealed by other studies in tropical regions.
There is a fair chance that they would prefer a lower
level of daylight glare in interior spaces. To enhance occupants’ comfort and avoid discomfort glare, the controlled strategies can be reconciled to achieve visual comfort with the modifications on visible light transmittance rate, glazing area, or any features for glazing material selection guidelines in Thailand, based on the acceptability-based approaches from the occupants in this study.
To this end, the agreement between thermal comfort and discomfort glare is clarified. Their interactions can be described in terms of the occupants’
sensation level and the glazing performance rating of the buildings. To improve local occupants’
comfort evaluation, the criteria, which is currently mentioned in terms of thermal comfort (TREES), can be updated by addressing the discomfort glare evaluation as a more comprehensive model, concerning the analysis of comfort indices with the comfort vote in this study. However, the usability of comfort indices must be carefully concerned since there are discrepancies from the actual perception of the occupants. To determine an applicable criteria, the post-occupancy evaluation is a required method to enhance the occupant’s comfort, which can be applied and revised based on local requirements.
Any improvement in the understanding of occupants’
comfort will allow researchers or designers to develop tools to provide a proper design solution for the buildings.
Figure 14:
Scatter plot showing the mean air temperature (°C) based on the distance from the glazing window (m.)
Figure 15:
Scatter plot showing the mean vertical illuminance (lux) based on the distance away from the glazing window (m.)