THE CHARACTERISTICS OF DOMESTIC WASTEWATER FROM OFFICE
BUILDINGS IN BANDUNG, WEST JAVA, INDONESIA
Vandith Va
*, Ahmad Soleh Setiyawan, Prayatni Soewondo, Dyah Wulandari Putri
Department of Environmental Engineering, Faculty of Civil and Environmental Engineering, Bandung Institute of Technology, Bandung, 40132, Indonesia
*Corresponding author: vandith_va@yahoo.com
ABSTRACT
Domestic wastewater generated from various types of buildings has been recognized to be different to some extent. Aims : This research aimed to know the quality, quantity, fluctuation of quality, and fluctuation of quantity of domestic wastewater discharged from office buildings.
1.
INTRODUCTION
Many developing countries have problems in managing their domestic wastewater, especially in
big and densely populated cities. Indonesia as the fourth most-populated country in the world with 261 million populations in 2016 also faces many challenges regarding domestic wastewater management, which includes black water generated from toilets and urinors, and gray water generated from bathing, washing and other non-toilet activities.
Indonesia has sewerage system, which serve around 2.13% of the national population (Mungkasa and Wahyuki, 2010). Untreated domestic wastewater could make a problem of environmental deterioration in rivers, lakes and other public water bodies. It has been increasing considerably over the past decade. The main sources of water pollution are domestic wastewater (Mungkasa and Wahyuki, 2010).
Bandung City is one of 13 cities in Indonesia that already has a centralized wastewater treatment system with limited service against the total population. The plant, which is called IPAL Bojongsoang, has a capacity of 89,000 m3/day and covers treatment for Eastern part of the
city. Only around 35% of the population are connected to the plant in Bojongsoang. In regard to area also about 30% of Bandung is covered with the sewer (ESP-USAID, 2006). Nowadays, the
operation is not effective because existing work capacity is only 40,000 m3/day. The plant is also
suffering to people living around the area, who take water directly from the open sewer channel and ponds for irrigation.
Wastewater generated from various types of buildings has been recognized to be different in some extent. Installation of appropriate wastewater treatment technology at the initial
source of pollution can solve the specific problem. There is a little information about characteristics of office building wastewater in Bandung. In order to implement the appropriate on-site office building wastewater treatment system, the research on characteristics of wastewater quality needs to be considered in advance. Therefore, this research was to know
2.
RESEARCHED METHODOLOGY
2.1
Matrials and Methods
Location and period of research, data collection, data analysis, analytical method and data
analysis are described in this part.
2.1.1
Location and Period of Research
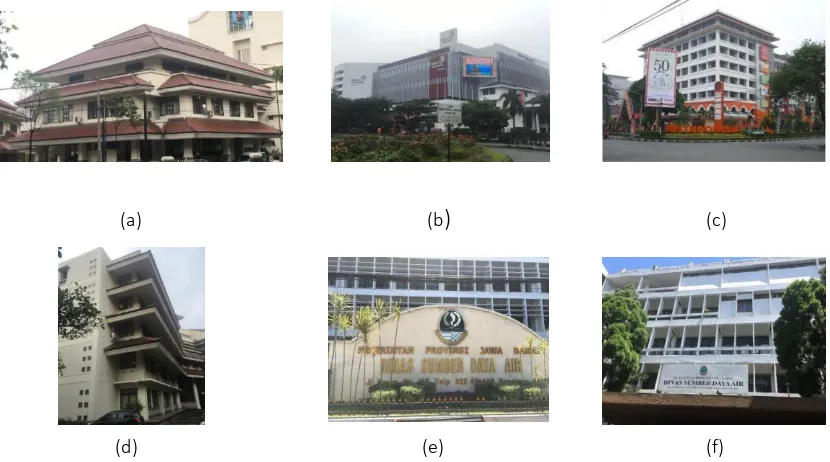
Figure 1 showed that annex building is located at St. Tamansari, No. 64 (Building A), Telkom Indonesia building, which is located at St. Japati, No. 1 (Building B), in Bandung were
characterized for both quality and quantity of wastewater, while the wastewater generated from Dinas sumber daya A and B, which is located at St. Braga, No.137, Graha pos Indonesia, which is located at St. Banda No.30, and main building, which is located at St. Tamansari, No. 64 were used to observe the quality of wastewater discharge. The Period of this research took about 4 months.
(a) (b
)
(c)(d) (e) (f)
Figure 1 Building A is located at St. Tamansari, No.64 (a), building B is located at St. Japati, No. 4 (b), Graha pos Indonesia is located at St. Banda No.30 (c), Main building is located at St. Tamansari, No. 64 (d), Dinas sumber daya B is located at St. Braga, No.137 (e), and Dinas
2.1.2
Data Collection
Wastewater discharge is widely used in designed and constructed municipal wastewater
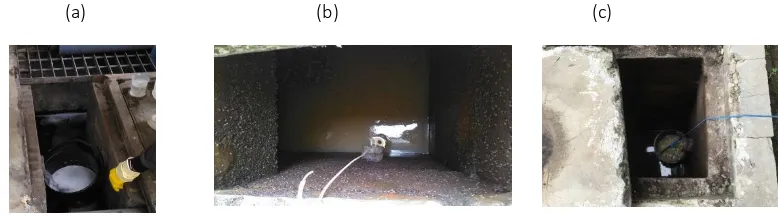
treatment plant and on-site domestic wastewater treatment plant. WWTP and on-site WTP have important roles to solve water environmental problems. Figure 2 showed the quantity and quality of gray water and black water sampling method generated from building A, while Figure 3 showed the quality and quantity of mixed wastewater sampling method from building B. To know the quality of gray water and mixed wastewater, the composite samples were taken from
the inlet.
(a) (b) (c)
Figure 2 The quantity and quality of gray water sampling from building A (a), quality of black water sampling method from building A (b), and quantity of black water sampling from building
A (c)
(a) (b)
Figure 3 The quality of mixed wastewater sampling method (a) and the quantity of mixed wastewater sampling from building B (b)
The point before it was mixed in the septic tank every hour from 7 am until 5 pm with a small bucket of 0.5 litters and mixed it in the bigger container of 5 litters to measure in
quality, grab sampling was taken hourly from building B. To know the quantity of wastewater, the amount of wastewater was measured every hour from 7am until 4 pm during the working
period from building A and building B. There is no commercial activity in these two buildings. Black water is the wastewater generated from the closet and urinors, while the gray water is the wastewater generated from lavabo, ablution, kitchen and shower. Moreover, the number of people working in annex building, main building, Telkom building, Dinas sumber daya air A, Dinas Sumber Daya Air B, and Graha pos Building were 53, 208, 900, 400, 50, and 600 persons,
respectively.
2.1.3
Analytical Method
The following parameters were determined according to the standard method for the examination of water and wastewater: COD (SMEWW 5220-B), BOD (SMEWW-5210-B), TSS
(SMEWW 2540-D), TN (SMEWW 4500-B), NH4 (SMEWW-4500-NH4-B), TP (SMEWW 4500-P-D)
and pH (SMEWW 4500H+).
2.1.4
Data Analysis
The concentrations and ratios between various water quality parameters in wastewater influent can influence the selection and function of treatment processes. Consequently, it is critical to
conduct systematical analyses on water quality parameters of wastewater such as COD, BOD, TSS, TN, NH4, TP, and pH and quantity of wastewater generated from office buildings by using
statistical method such as mean and standard deviation.
3.
RESULTS AND DISCUSSION
The quality of wastewater, quantity wastewater, fluctuation of quality wastewater, and fluctuation of quantity of wastewater generated from office buildings are discussed in this part.
3.1
Quality of Wastewater Discharge from Office Buildings
3.1.1
Quality of Mixed Wastewater
The biodegradability assessment of wastewater is practical significance as it is helpful to optimize the wastewater treatment process for achieving the maximum removal efficiency,
BOD /COD widely used to determine the degradability of wastewater (Xia et al. 2008). Moreover, The BOD/COD ratio is generally considered to measure the biodegradability of wastewater. A high BOD/COD ratio (between 0.4 to 0.6) shows a good biodegradability of wastewater whereas a low BOD/COD ratio (between 0.2 to 0.4) indicates the presences of
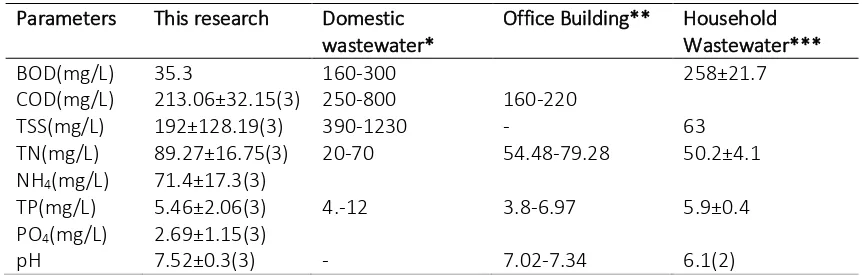
poorly biodegradable substances in wastewater. Possible consequences of unfavorable BOD/COD ratios indicate incomplete denitrification, high COD in the outflow of wastewater treatment plants, and deterioration of biological phosphorus removal (Winkler, 2005). According to Table 1, The BOD and COD concentrations from this research were lower than those obtained from typical domestic wastewater (Tchobanoglous et al. 2003) and household
wastewater (Fajri, et al. 2018), while the COD concentration from this research is quite similar to wastewater from office building conducted by Bouted and Tatanatamstul (2018). Moreover, BOD/COD ratio from this research was found to be about 0.2. The average BOD/COD ratio of the characteristics of an office building in Campus, Bandung, Indonesia conducted by va et al. 2018 was found to be 0.38 and it is a bit higher than BOD/COD ratio obtained from this
research. This is because the previous sampling method was grab sampling of the mixed wastewater in the first compartment of septic tank. This indicated that the mixed wastewater generated from office building is a poorly biodegradable substance since it contains low concentration of BOD with a bit higher concentration of COD.
The balanced relationship among carbon, nitrogen and phosphorus in influent of influent
wastewater treatment plant is crucial to the effectiveness of biodegradation configuration so as to achieve the maximum nutrient removal efficiency. For efficient wastewater treatment, it is widely stated that the C:N: P ratio for anaerobic treatment was in the range between 250:5:1 to 500:5:1 (Ammary, 2004), while aerobic treatment was in the range between
100:5:1 to 100:10:1 (Droste, 1997). High concentration of individual substances and unfavorable nutrient ratio can reduce the degradation efficiency of microorganisms (Winler, 2005). Total Nitrogen and Total Phosphorus concentrations from this research and the office building wastewater conducted by Bouted and Tatanatamstul (2018) are quite similar to the high strength of typical domestic wastewater. The average C: N: P ratio of this research was
office building in Thailand conducted by Bouted and Tatanatamstul (2018). On the other hand, it is different to C:N:P ratio from typical wastewater (100:10:1) (Tchobanoglous et al. 2003),
BOD:N:P (100:20:2.36) ratio from household wastewater (Fajri, et al. 2018). This indicated that wastewater from office buildings has specific water quality with high concentration of nutrient and low concentration of organic matter.
Table 1 The comparison of characteristics of mixed wastewater generated from this research with the typical domestic wastewater, household wastewater and another office building
wastewater
Data are minimum-maximum, mean ± standard deviation and parentheses indicate number of samples *(Tchobanoglous et al. 2003), **(Bouted and Ratanatamskul, 2018) and ***(Fajri et al. 2018)
3.1.2
Quality of Gray Water
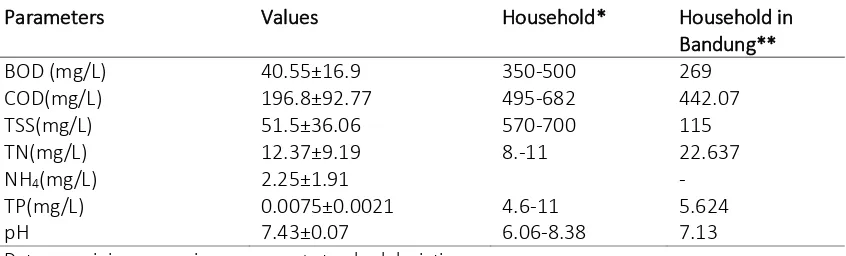
The average BOD/COD ratio of gray water in this study was found to be 0.2 and it was lower
than the one obtained from household wastewater conducted by Palmaquist and Hanaux (2005) and it has low concentration of total suspended solid, indicated that a greater proportion of the contaminants are dissolved (Jefferson et al. 19996). Moreover, although the concentration of organic matter is quite different to household wastewater and typical domestic wastewater. Jefferson et al. (1999) reported large variations of the gray water
Table 2 The comparison of characteristics of gray water of domestic wastewater from office building A and the characteristics of gray water generated from household wastewater
Parameters Values Household* Household in
Bandung**
Data are minimum-maximum, mean ± standard deviation * (Palmaquist and Hanaux ,2005)
* (Firdayati et al. 2010)
Total suspended solid and nutrient of gray water from this research were lower than those obtained from household wastewater. This means that quality of gray water was influenced by the activities of people in households and office buildings.
3.1.3
Quality of Black Water
Based on Table 3, the average BOD/COD of black water generated from this research found to be 0.48 and it is similar to the BOD/COD obtained from household wastewater conducted by Palmaquist and Hanaux, (2005). The ratio of BOD/COD for untreated sewage typically ranges from 0.3 to 0.8 (Tchobanoglous et al. 2003). If the BOD/COD ratio of untreated wastewater is 0.5 or greater than, it is considered to be easily treatable by biological mean. The total nitrogen
Table 3 The comparison of characteristics of black water of domestic wastewater from office building A and the characteristic of black water generated from household wastewater
Parameters Value Household*
Data are minimum-maximum, mean ± standard deviation * (Palmaquist and Hanaux, 2005)
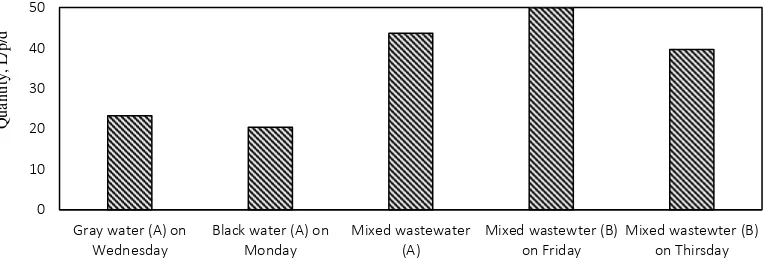
Figure 4 The quantity of gray water, black water, and mixed wastewater discharge from building A and building B
3.2
Quantity of gray water, black water and mixed wastewater discharge
Wastewater flows are steady or uniform, but vary from one hour to another, from day to day, from month to month, and from year to year. When building wastewater treatment plant, it is
important to know the volumes of wastewater and their variations, now as well as future. Based on knowledge of the wastewater, the design of treatment plant can be determined, taking into account the wastewater to be treated. In this connection, measurement is useful; if such measurements do not exist, as estimates should be made. Based on Figure 4, in respect of the volume of the future wastewater, the development should of course be taken into account, the
production from household wastewater in Bandung city, Indonesia conducted by (Firdayati et
al. 2010) was found to be 60 to 178 L/p/d. This indicated that the quantity of gray water discharge from office building of this research was lower than the wastewater discharge from household conducted by Palmaquist and Hanaux (2005) and Firdayati et al. (2010). Moreover, the quantity mixed wastewater discharge from building B was varying from 39.61 to 49.93 L/p/d. Therefore, the quantity of wastewater discharge from office buildings was ranging from 39.61 to 49.93 L/p/d.
3.3
Fluctuation of quality of wastewater discharge
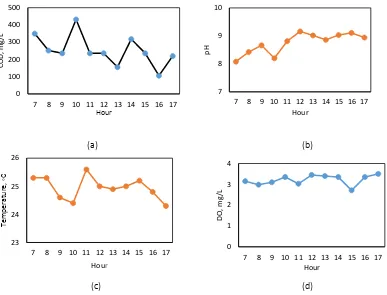
Several types of constituent concentration variation can occur depending upon the characteristics of the contributors to the wastewater collections system, the concentration may change significantly during the day. As can be seen in Figure 5 (a), the peak COD (organic
matter) concentration was at 10 am about 432 mg/L while the low COD concentration was at 4 pm about 106 mg/L with mean ± standard (252.5±89). Control of the pH value is very important in the reactor with biological processes, this is because some microorganisms can survive only in a certain pH range. The pH value may also affect the metabolic activity of microorganisms that affect the speed of its growth. Most microorganisms can develop in the pH range from 4 to 9.5,
but the most optimum conditions to accelerate the growth process is in the range 7.2 to 8.8 (Chen, et al. 2006). Based on Figure 5 (b), it showed the change of pH values in influent system was not significantly different with mean ± standard (8.8±0.4). As is known under the presence of dissolved oxygen in the anaerobic process will impact the passage of the process. Anaerobic bacteria will degrade COD in the absence of free oxygen molecules to obtain energy for cellular
activity and carbon for cellular synthesis. The optimum value of dissolved oxygen for anaerobic process is 0.1 to 0.05 mg/L according to research by Skerman and Macrae, 1957 and DO above a concentration of 0.2 mg/L can inhibit reaction of the denitrification process. In activated sludge systems, a DO concentration at least 2 mg DO/L is normally used in nitrifying processes
(a) (b)
(c) (d)
Figure 5 Variation of COD concentration (a), variation of pH (b), variation of Temperature (c), and variation of DO concentration (d) hourly from 7 am to 5 pm obtained from mixed
wastewater from office building B, which was measured on March 22, 2018
Based on Figure 5 (d), it showed the change of DO values in influent system was not significantly different with mean ± standard (3.2±0.2). Environmental conditions of temperature have an important effect on the selection, survive, and growth of microorganisms (Metcalf and Eddy, 2004). The effects of temperature variations on aerobic biological wastewater treatment
were evaluated with respect to treatment efficiency, solids discharges, sludge physicochemical properties and microbiology. The adaptation of the microorganisms to abrupt temperature changes seems to be much slower at higher temperatures. Aerobic digestion and nitrification stops when the temperature rises to 50°C. When the temperature drops to about 15°C,
3.4
Fluctuation of Quantity of Wastewater Discharge
The fluctuation of gray water, black water and mixed wastewater generated from office building will be discussed in this part. Measurement of the volume of wastewater will be either in the
form of curves or in the form of figure (metering). The curve is the sum of domestic wastewater from office building. The curve can be used to find the maximum hourly flow and the average hourly flow of the day. The rated capacity of wastewater treatment plants is normally based on the overage annual daily flowrate at the design year. As a practical matter, however,
wastewater treatment plants have to be designed to meet a number of conditions that are influenced by flowrates, wastewater characteristics and constituent concentration. Peaking conditions that must be considered include peak hydraulic flowrates and peak process constituent mass loading rate in wastewater collection systems and from individual residences is also considered.
3.4.1
Fluctuation of Mixed Wastewater Discharge
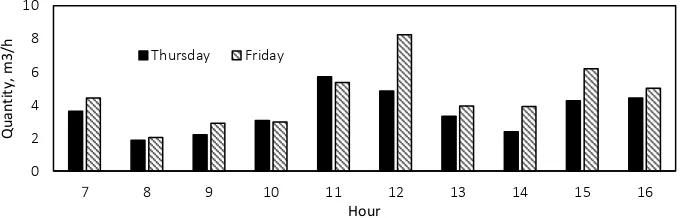
Based on Figure 6, the mixed wastewater which was measured on Friday showed that the wastewater generation was 4.43 m3 at 7 am and it was getting down from 8 am to 10 am. This
indicated that some people seemed to use much water when they arrived their office in the morning. The wastewater generation was increased from 10 am to 12 am, which is the peak
discharge of wastewater generation. This means that the people used much water before they prayed on Friday for Moslem Indonesian culture. From 1 pm and 2 pm, the wastewater was getting down again because the working period. By the way, wastewater generation was increasing at 3 pm. This indicated that people use a bit high water before they prayed at 3:30 pm.
Figure 6 . The fluctuation of mixed wastewater discharge from office building B was measured on Friday 2, 2018 and Thursday 22, 2018
The wastewater was getting down again at 4 pm as it was the time to come back home. Moreover, the quantity of wastewater discharge per person per day is 49.93 L/p/d with the
number of people 900 persons. Based on Figure 6 again, the mixed wastewater which was measured on Thursday showed that the wastewater generation was 3.66 m3 at 7 am and it was
getting down from 8 am to 10 am. This indicated that some people seemed to use much water when they arrived their office in the morning. The wastewater generation was increased from 10 am to 12am, which is the peak discharge of wastewater generation. This means that the
people used much water before they prayed for Moslem Indonesian culture. It was increasing at 3 pm. This indicated that people use higher water before they prayed at 3:30 pm.The wastewater was getting down again at 4 pm as it was the time to come back home. Moreover, the quantity of wastewater discharge per person per day is 39.61 L/p/d with the number of
people 900 person. Moreover, peaking factors of wastewater discharge are equal to maximum flowrate divided by the average flow rate obtained to be 1.59 and 1.83, which were measured on Thursday and Friday, respectively. This showed that the highest peaking factor was 1.83, which was measured on Friday. According to this result, it indicated that the quantity of mixed wastewater discharge from office building gave the peak volume on Friday, while it gave the
minimum volume of wastewater discharge, which was measured on Thursday according to Moslem Indonesian culture.
3.4.2
Fluctuation of Gray Water and Black Water Discharge
Based on Figure 7 (b), people seemed to use much water in the morning at 7 am, which was 151.2 liters and the black water was getting down from 8 am until 10 am. It showed that people
did not use much water because they were working at that time. It was increasing at 11 am It indicated that the peak discharge of wastewater generation. This means that the people used much water before they prayed for Moslem Indonesian culture. From 1 pm and 2 pm, the wastewater was getting down again because the working period. On the other hand,
(a) (b)
Figure 7 The fluctuation of black water was measured on Monday, January 22nd, 2018 (b) and the fluctuation of gray water discharge was measured on Wednesday January 17th, 2018 from
office building A (b)
Wastewater discharge showed high point at 1 pm because they used urinors and toilets after lunch break and it was getting down again as it was the time to work. By the way, it was
getting up at 4 pm becausethey used water before coming back home. The total black water generation for 10 hours is 1080 L and numbers of people working in that building are 53 persons. Therefore, the quantity of gray water discharge per person per day is equal to 20.38 L/p/d. Based on Figure 7 (a), quantity of gray water discharge was 162 L at 7 am and it was
getting down from 8 am until 10 am. It showed that people did not use much water because they were working at that time. It was increased from 11 am until 1 pm because they started to wash their hands, face and legs before they prayed for Moslem Indonesian culture and after break time. The peak discharge showed at 3 pm, which was 198 L because both men and women were preparing themselves to pray at that time. The total gray water generation for 10
hours is 1233 L and numbers of people working in that building are 53 persons. Therefore, the quantity of gray water discharge per person per day is equal to 23.26 L/p/d. Furthermore, the peaking factor of wastewater discharge is equal to maximum flowrate divided by the average flow rate of black water and gray water obtained to be 1.4 and 1.6, respectively. This indicated
that the black water discharge was 2.88 L/p/d lower than the gray water discharge and black water gave a lower peaking factor comparing with the one obtained from gray water.
4.
CONCLUSION
The quantity and quality of wastewater generated from office buildings were evaluated. The
results showed that the quality of wastewater generated from office building has high concentrations of nutrient and low organic matter with average C: N: P ratio 100:42:2.56. The
quantity of wastewater varied over time and it was ranging from 39.61 to 49.93 L/p/d, while the quantity of black water and gray water were 20.38 L/p/d and 23.26 L/p/d with the peaking
factors of black water, gray water and mixed wastewater were 1.4, 1.6 and 1.83, respectively at the beginning of working time and the praying time of Moslem Indonesian culture. COD concentration variation can occur depending upon the characteristics of the contributors to the wastewater collections system, it changes significantly during the working time with the peak COD was 432 mg/L and minimum COD was 106 mg/L, while pH, DO and Temperature were not
significantly different with mean ± standard (8.8±0.4), (3.2±0.2), and (24.9±0.4), respectively. It is proposed that domestic wastewater from office building has specific characteristics and high concentrations of nutrient that is required the appropriate advanced technology for treating this kind of wastewater. The finding of this research can be served as useful information for
domestic wastewater treatment system design and operation for office buildings in Bandung, West Java, Indonesia.
5.
ACKNOWLEDGEMENT
This research was supported by the fund from Research Program, Community Service, and
Innovation (P3MI) of Water and Wastewater Engineering Research Group and AUN/SEED-Net Doctoral Sandwich Scholarship Program.
6.
REFERENCES
Ammary, B.Y. 2004. Nutrients requirements in biological industrial wastewater treatment. Afr J Biotechnol. 3:236-238
Bouted, C., and Ratanatamskul, C. 2018. Effects of temperature and HRT on performance of a novel insulated anaerobic filter (IAF) system incorporated with the waste heat input for building wastewater treatment. Journal of Environmental Management, 206:698-706
Chen, S., Ling, J., Blancheton, J.-P. 2006. Nitrification Kinetics of Biofilm as Affected by Water Quality Factors. Agricultural Engineering, 34:179-197.
Droste, R L. Theory and Practice of Water and Wastewater treatment, John Wiley and Sons. Inc, 1997.
ESP-USAID, Comparative Study: Centralized Wastewater Treatment Plants in Indonesia, 2006.
Firdayati, M., Handajani, M., Buzie, C., and Otterpohl. 2010. Gray water reuse for green vertical garden: possible or impossible (case study): Bandung City, Indonesia. 1st International Conference on Sustainable Urbanization, Hong Kong.
Jefferson, B., Laine, A., Parsons, S., Stemphenson, T., and Judd, S,. 1999. Technologies of domestic wastewater recycling. Urban Water, 1:92-285.
Metcalf, L., & Eddy, H. Wastewater Engineering, Treatment and Reuse, 4rd, McGraw-Hill, New
York, 2004.
Mungkasa, O., and Wahyudi, D. Portrait of Indonesia's sanitation development,Jakarta, 2010.
Palmquist, H., and Hanaux, J.2005. Hazardous substances in separated collected grey- and blackwater from ordinary Swedish households. Science of the Total Environment, 348: 151-163.
Skerman, V., & MacRae, I. 1957. The influence of oxygen availability on the degree of nitrate reduction by Pseudomonas denitrificans. Canadian Journal of Microbiology. 3:505-530.
Tchobanoglous, G., Burton, F., and Stensel, H. Wastewater Engineering, Treatment and Reuse. McGraw-Hill, New York, 2003.