DOI: 10.12928/TELKOMNIKA.v14i3.3118 1203
Medical Image Contrast Enhancement via Wavelet
Homomorphic Filtering Transform
Xinmin Zhou1, Ying Zheng2, Lina Tan3, Junchan Zhao*4 1,3,4
Institute of Big Data and Internet Innovation, Hunan University of Commerce, Changsha 410205, Hunan, China
2
College of Electronic and Information Engineering, Tongji University, Shanghai 201804, Shanghai, China *Corresponding author, email: [email protected]
Abstract
A novel medical image enhancement algorithm based on spatial domain is presented in this paper. The medical image is firstly divided into several sub-images under the dyadic wavelet scale analysis. As different directional sub-images can reflect different characteristics, at each level, different Butterworth homomorphic filtering functions are used in performing filtering of corresponding sub-band images to attenuate the low frequencies as well as amplify the high frequencies and a linear adjustment is carried out on the low frequency of the highest level. Later, the wavelet reconstruction course is utilized to get the final image. Experiments on magnetic resonance (MR) images of temporomandibular joint (TMJ) soft tissues have shown that our method can eliminate non-uniformity luminance distribution of medical images effectively and its performance is better than traditional Butterworth homomorphic filtering algorithm.
Keywords: medical image; wavelet transform; homomorphic filtering; image enhancement
Copyright © 2016 Universitas Ahmad Dahlan. All rights reserved.
1. Introduction
Along with the medicine phantom technology’s development, medical images have become the important means in the medicine clinical diagnosis and the treatment. However, almost all kinds of digital medical images, especially magnetic resonance (MR) images, generally have the characteristics of noise, edge blurry and low contrast between objects and background as well as being disturbed by pseudo image. These characteristics pose great difficulty for follow-up analysis and on a certain degree affecting doctor’s diagnosis accuracy.
In many cases, the low contrast can be considerers as a result of bad distribution of pixel intensities over the dynamic range of the display device. This and suggest the application of contrast enhancement methods in an attempt to modify the intensity distribution. Contrast enhancement is an important processing technique that can be used in highlighting interesting range in the image [1]. Now, it has been one of the research focuses and is widely used in medical image processing. So far, plenty of techniques have been proposed and can be generally classified into spatial uniform operators and spatially non-uniform operators.
Linear contrast stretching, histogram equalization are two of the most widely used spatially uniform techniques. The linear contrast-extension method can hardly enhance all parts of the image simultaneously. For images containing large homogeneous regions, such as a flat ground, applying histogram equalization is not effective and in fact serves to magnify noise. The biggest disadvantages of spatially uniform methods are their limited ability in incorporating local context into transformation [2].
with those basically following the AHE as above is that the brightness is changed and enhancement images look far from natural and the extend of enhancement is non controllable and they are single-scale spatial domain methods, thus can only enhance the contrast of a narrow range of sizes. Though some works have been done, it is still has no means to solve this problem in a better manner.
With the development of the wavelet theory, spatial filtering has become major algorithm in image enhancement study. Unlike traditional signal scale techniques, multi-resolution or multi-scale based algorithms offer capability of enhancing components adaptively based on their spatial frequency properties [3]. The main idea of these kind approaches is to use a redundant wavelet transform and linear or non-linear mapping functions applied on Laplacian [4] or gradient wavelet coefficients [5]. Such methods have demonstrated significant contrast enhancement and good visibility of medical images. Lu and Healy’s multi-scale edge representation algorithm enhances the image contrast by choosing scale variable stretching factor to reduce low contrast and enhance the image edges [5]. Wang and Chen proposed a mixture scope model of wavelet multi-scale transform based medical computed tomography (CT) enhancing algorithm [6]. Meanwhile, several wavelet-based spatially adaptive methods have been presented for mammographic contrast enhancement [7].
The MR images, however, are very difficult to be analyzed and processed by the traditional image enhancement method [8]. In this paper, we propose a novel homomorphic algorithm for their enhancement. At first, an image is decomposed by dyadic wavelet transform. Afterwards, homomorphic filtering is performed on wavelet coefficients of the image. Here different sub-band images are processed differently through high-pass filter or linear adjust to attenuate low spatial frequencies and amplify high spatial frequencies. Finally, we utilize inverse dyadic wavelet transform to reconstruct the enhanced image.
The paper is organized as follows. In Section 2, the traditional homomorphic algorithm is analyzed. Besides, the dyadic wavelet transform is described in Section 3. Furthermore, we propose a novel algorithm that applies homomorphic filtering based on the multi-scale representation in Section 4. Finally, experiment results of the proposed algorithm and some existing representative contrast enhancement methods on real MR images are granted for comparison and conclusion is drawn.
2. Traditional Homorphic Filtering Method
Homomorphic filtering is an important contrast enhancement technique that has been successfully applied in correcting slowly varying illumination of image. In image processing, the possibility of optical implementation for the homomorphic filter makes it a powerful alternative to other enhancement techniques, such as histogram equalization. By equalizing the illumination variation onto the image, one can retrieve details lost in dark regions. The homomorphic is said to useful for image enhancement by simultaneous brightness range compression and contrast enhancement.
2.1 Illumination-Reflectance Model
Generally speaking, an image can be regarded as a two-dimensional function of the form f x y( , ) and its value at spatial coordinates ( , )x y is a positive scalar quantity whose physical meaning is determined by the source of the image. An image can be expressed in terms of intensity spatial distribution as follows:
( , ) ( , ) ( , )
f x y =i x y r i y (1)
here i x y( , )describes the intensity of the illumination and r i y( , )represents the reflectance of the object or scene. Here illumination results from the lighting conditions present when the image is obtained, and can change when lighting conditions change. While reflectance results form the way the objects in the image reflect light, which is determinate by the intrinsic properties of objects itself and can be changed.
2.2 Basic Homomorophic Filtering
Homomorophic filtering is a frequency domain filtering process that tries to separate the two components and enhance the reflectance and reduces the contributions of illumination [9].
In general, the spectrum of the illumination component is dominated by low spatial frequencies and its variations are smooth in the input plane. Meanwhile, the spectrum of the reflectance component is typically distributed over the whole frequency domain. By separating the two components, attenuating the low spatial frequencies and amplifying the high spatial frequencies, the undesired contributions within the image that are due to high source non-uniformities can be reduced and the object features can be emphasized in [10].
The logarithmic function of the image intensity function is:
( , ) ln( ( , )) ln( ( , )) ln( ( , ))
Z x y = f x y = i x y + r i y (2)
here it is a linear expression containing two additive components. Then we can use the Fourier transform ξ and get:
( , )) ln[ ( , ]) ln[ ( , )])
(
Z x y(
i x y(
r i yξ
=ξ
+ξ
(3)It can be rewritten as:Z u v( , )=F u vL( , )+F u vR( , ), here F u vL( , )and F u vR( , ) are the Fourier transform of ln[ ( , ]i x y and ln[ ( , )]r i y , respectively. We can high pass Z u v( , ) by means of a filter function H u v( , ) in frequency domain and obtain a filtered version:
S u v( , )=H u v( , )⋅Z u v( , )=H u v( , )⋅F u vL( , )+H u v( , )⋅F u vR( , ) (4)
Taking an inverse Fourier transform of the above equation provides:
1 1 1
( , )) ( , ) ( , ) ( ( , ) ( , ))
( , )
(
S x y(
H u v F u vL)
H u v F u vRs x y =ξ− =ξ− ⋅ +ξ− ⋅ (5)
And finally the enhanced image g x y( , )can be obtained by the exponential operation;
( , ) exp( ( , ))
g x y = s x y (6)
Though the above process, a dynamic range component of the gray level scale and a contrast enhancement can be obtained. The below flow chart describes course of homomorphic filtering [11]:
Ln
f(x,y)
FFT LF FFT-1 Expg(x,y)
Figure 1. Homomorphic filtering procedure
Here: Ln: logarithm, FFT: Fourier transform, LF: linear Filtering, LFT: inverse Fourier transform, Exp: exponential,f x y( , ): the initial image intensity function, g x y( , ):Processed image intensity function.
Usually, there three second–order homomorphic high-pass filtering functions that are used as the linear filtering. The first one is the Gaussian filtering function; its expression is as follows:
2
( , )
( , )
(
H L)(
1 exp[
])
L Cu v
H u v
r
r
c
ρ
r
ρ
−
=
−
−
+
[image:3.595.87.501.556.587.2]Here
r
H andr
L are high and low frequencies respectively, and usuallyr
H >1andr
L <1.Theconstant
c
is to control the sharpening the filtering function slope,ρ
=
(
u u
−
0)
2+ −
(
v v
0)
2 is the distance between( , )
u v
and the center of the filter,(
u v
0,
0)
are the center coordinates, andC
ρ
is the cutoff spatial frequency of the filter and it takes value ofρ
when( , )
u v
=(0,0). The second one is the Butterworth filtering function defined as follows:2
( , )
( , )
(
H L) /(
1
/
)
L Cu v
H u v
r
r
ρ
c
r
ρ
+
=
−
+
(8)The third one is the exponentiation filtering function that takes the form as follows:
( , )
(
H L)(
1 exp[(
( , )
) ])
2 L Cu v
H u v
r
r
c
ρ
r
ρ
−
=
−
−
+
(9)Among the above mentioned high pass filters, the Butterworth type high pass equations far superior to the other two frequency-domain filter functions can get the best result in dynamic range compression and contrast enhancement, making it suitable of use with the homomorphic filtering approach. It has global property and can keep overall appearance well as it makes use of all pixels in the image. However, it has not taken local spatial characteristics into account and can not get satisfying result in image local contrast enhancement.
3. Dyadic wavelet transform
In recent years, multi-scale and multi-resolution analysis has been widely applied to contrast enhancement. Wavelet analysis provides a multi-resolution representation of continuous and discrete-time signals and images. The advantage of this technique is that structures of different size appear at different scales and can be process independently [12].
Redundant biorthogonal wavelet representations have several advantages than orthogonal wavelet representations. Their sub-band images are invariant under translation and do not aliasing. Smooth symmetrical or anti symmetrical wavelet transform functions can be used, allowing alleviation of boundary effects via mirror extension of the signal. Due to these advantages, such representations have been extensively used in image enhancement. In this paper, a fast biorthogonal, redundant discrete wavelet transform based on a wavelet function
( )x
ψ
with compact support, is utilized in image enhancement.Let
ς
s( , )x y =(1 /s2) ( / ,ς
x s y s/ )denote the dilation of a 2D functionς
s( , )x y at scale s.Any 2D function f( , )x y can be approximated at a scale s=2jby an approximated operator
2j S
,defined by a convolution with a dilated scaling function:
2j ( , ) * 2j( , )
S f x y
=
fφ
x y .The scaling functionφ
( , )x y is a low pass function whose Fourier transform is an aggregation of wavelet functions dilated by scales than 1. Any discrete imageI
n m, can be considered ad the uniformsampling of the approximation of a function f x y( , ) at the finest measured scale 1:
1 ( , ) n m,
S f m n =I . The discrete wavelet transform is then a uniform sampling of the corresponding
1
1 1
2
2 2
2
2 2 2
2 2 2 * ( , ) ( , ) ( , ) * ( , ) ( , ) * ( , ) *
2 2 2
*
(
)
(
( , )
(
)
)
j j j j j j jj j j
f x y
x y x y
f
x y x y f x y
W f W f
x
x y
y
θ θ θψ
ψ
→ ∂ ∂ ∂ ∂
=
=
=
⋅∇
(10)here the analysis wavelets ψ1( , )x y and ψ2( , )x y are partial derivates of a symmetrical, smoothing function θ( , )x y , approximating the Gaussian and the dyadic scale j. Then the original image is decomposed into a multiresolution hierarchy of sub-band images, consisting of
a coarse approximation image
2j ( , )
S f m n and a set of wavelet images
{
1 2}
2j( , ),x y 2j( , )x y
W W
(j=1…J)which provide the details that are available in S f1 but has disappeared in
2j
S f.All
sub-band images have the same number of pixels as the original, thus the representation is highly redundant. At dyadic scalej, the discrete filters areLHj,HLj, HHjobtained by inserting
2
j-1 zeros between each of the coefficients of the coefficients of the corresponding filters.Through dyadic wavelet transform, an image can be decomposed into multi-scale wavelet coefficients each level is composed by LHj , HLj , HHj high frequencies in the
horizontal, vertical and diagonal direction as well as a low frequencies
LL
Jin the highest level [14].LL
J reflects the illumination distribution and basic information in spatial domain. The following figure show result of dyadic wavelet transform on an image.[image:5.595.87.499.390.521.2]
Three level wavelet decomposition Image wavelet decomposition
Figure 2. Chart of image dyadic wavelet decomposition
The wavelet coefficients under different resolution can be similarly high-pass processed to attenuate the low frequencies and amplify the high frequencies for the spatial characteristic of wavelet transform reflects the global information of the image to some extent. We can use different algorithms to handle different sub-band to enhance image.
4. A novel image enhancement algorithm
Ln
f(x,y)
WT LF IWT Expg(x,y)
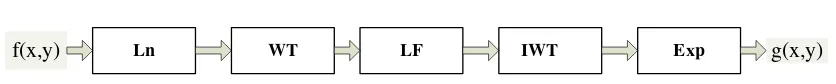
Figure 3. Wavelet homomorphic filtering transform procedure
The filtering method based on wavelet transform, WT: wavelet transform, IWT: inverse wavelet transform, LF: the novel high-pass filtering.
In order to enhance the local contrast of the image, Liviu et al. proposed the following modified, second order Butterworth filtering function [15]:
1 2
4
1
( )
1 2.145(
)
C
H
ρ
r
r
ρ
ρ
= −
+
(11)
The parameters
r
1 andr
2have added for flexibility. Supposer
H andr
L are the high and low frequency gains. By varyingr
1 andr
2, one can obtain any value betweenr
1 andr
2.When
C
ρ
ρ
>>1, we can derive the relationship:r
H≈
r
1; WhenC
ρ
ρ
<<1, we can getr
L≈ −
r
1r
2.Additionally , the sharpness of the transition between
r
H andr
Lcan be controlled by varying the cutoff frequencyρ
C.In our work, we use this improved as the linear filtering function.For
LH
jandHL
j, we set:2 2 0 0 1 1 2
/
(
)
(
)
M N u v Cu u
v v
σ
ρ
ρ
= =
=
∑∑
−
+ −
(12)here M and N are size of the
j
level sub-band,(
u v
0,
0)
are the center of the sub-band, ,σ
is the standard deviation and get:2 2
0 0
1 1
1 2 4
2 1 2.145 1 ( / ( ) ( )
)
M N u vH r r
u u v v
σ
ρ
= = + − − + − =
∑∑
(13)For
HH
j , we set:1/
(2
j)
C
b
k
ρ
ρ
=
⋅
,herej
is the decomposition level andk
b is the cutoff coefficients, in this paper,k
bis set to be 1/8. The improved Butterworth filtering function is defined as:1 2 4
1 2.145 1 ( 1 2
)
j bH r r
k
ρ
+ − =
(14)For
LL
N, the above equation can be written as:r
1−
r
2 and it can be processed by linear or nonlinear adjust to revise its illumination non-uniformity. Here we use the follow equation to adjust it:(
−
−
+
[image:6.595.89.507.73.115.2]Here
m
is the mean of the coefficient onLL
N,x
is the coefficient onLL
N,k
is the regulatory factor. Whenk
=1, the high frequencies is amplified but the illumination non-uniformity in the spatial domain remain very obviously, it can remain the original appearance of the image well. Whenk
=0, the illumination non-uniformity in the spatial domain can be eliminated but original appearance of the image has been changed greatly for the low frequencies ofLL
N has been completely removed and these low frequencies are not entirely caused by the illumination non-uniformity. Sok
should not to set to be equal to 0 or 1. In this paper, we set k= −1 1 /m to adjust the local contrast and keep the original appearance of the image.As we know the improved Butterworth filtering is a high-pass filter, and the low frequency are participate in the next iteration, As the number of decomposition increase, the high frequencies between two neighboring level are decreased. So we can use larger filtering function values in contrasting higher level. In our paper, we set
r
1 to be j/(j+1) andr
2 to be2 / 5(j j+1) (here j is the decomposition level andj= ⋅ ⋅ ⋅1 J). Here we will get r11
<
r12<
⋅⋅⋅r1J and r21<
r22<
⋅⋅⋅r2J.r
1 andr
2of the highest level are used to calculateJ LL
H .
5. Experiments and Results
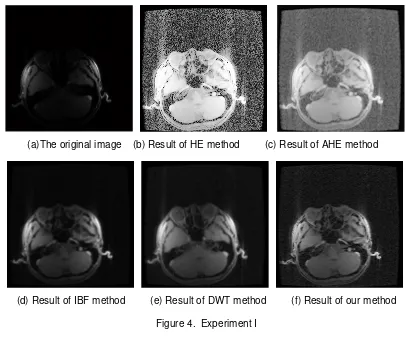
To demonstrate the performance of our algorithm, we carry out several experiments on some low contrast MR images and compare our method and some representative image enhancement algorithm, such as AHE method, the basic Butterworth filtering (BBF) method, the improved Butterworth filtering (IBF) method, and directional wavelet transform based image enhancement (DWT) method. Here we use three level dyadic wavelet transform and in the improved Butterworth filtering method, the cutoff frequency
ρ
Cis set to be 80.
(a)The original image (b) Result of HE method (c) Result of AHE method
[image:7.595.96.502.414.771.2]
(d) Result of IBF method (e) Result of DWT method (f) Result of our method
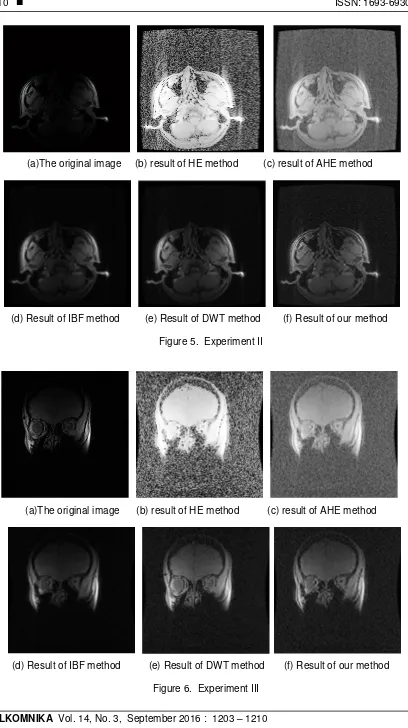
(a)The original image (b) result of HE method (c) result of AHE method
[image:8.595.99.507.60.788.2]
(d) Result of IBF method (e) Result of DWT method (f) Result of our method
Figure 5. Experiment II
(a)The original image (b) result of HE method (c) result of AHE method
[image:8.595.103.505.83.422.2]
From the experiments, we see that as the MR images have large homogeneous regions, the AHE method fails in its enhancing for it has been greatly magnify noise in smooth regions and the brightness has been changed greatly, which makes the enhanced image look rather unnatural. Meanwhile, the improved Butterworth filtering method outperforms the basic Butterworth method. From the image proposed by the basic Butterworth method, we see that images have been blurred and there also exists change in brightness. DWT method can obtain best result in MR image enhancement among these representative methods.
Now, we focus on comparison of our methods and DWT methods. From Figure 4, we can see that the image using our method is much clearer and more subtle tissue that can not be shown by improved Butterworth homomorphic filtering have been presented. In Figure 5, comparison of both methods illuminates that our model can get much exact and concrete tissues. In Figure 6, some tissue has not been correctly enhanced and some weak edges have been smoothed in the image enhanced by DWT method, while our method can keep them well.
6. Conclusion
In order to improve the contrast of MR images for further analysis, in this paper, we have presented a spatial homomorphic filtering algorithm for their contrast enhancement. Images are firstly decomposed by wavelet transform and then different homomorphic filtering is implemented on band-pass sub-band and the low-pass sub-band images. Experiments on MR images of temporomandibular joint (TMJ) soft tissues have shown that our method performs well in enhancing the local contrast of an image while maintaining its global appearance. Its performance has been shown to be much better than some representative image contrast methods in MR image contrast enhancement and may provide some novel solutions for existing problems.
Acknowledgements
The work described in this paper is supported by the National Social Science Fund Projects of China (No.: 13CJY007), the Ministry of Education, Humanities and Social Sciences Research Projects (No.: 12YJAZH216), and the Science and Technology Project of Hunan Province (No.: 2012FJ3058).
References
[1] K.Q.Huang, Z.Y.Wu, Q.Wang. Image enhancement based on the statistics of visual representation. Image and Vision Computing. 2005; 23(1):51-57.
[2] T.Zong, H.Lin, T.Kao. Adaptive local contrast enhancement method for medical images display on a video monitor. Medical Engineering Physics. 2000; 22(2):79-87.
[3] J.Lu, D.M.Healy, et al. Contrast enhancement of medical images using multiscale edge representation. Optical Engineering. 1994; 33(7): 2151-2161.
[4] Y.Yan, Z.Dong. Contrast enhancement of radiographs using shift invariant wavelet transform. Wuhan University Journal of Natural Science. 2006; 5(1): 59-62.
[5] D.Heric, B.Potocnik. Image enhancement by using directional wavelet transform. Journal of Computing and Information Technology. 2006; 14(4): 299-305.
[6] L.Wang, G.Chen, et al. A medical CT image algorithm based on the mixture scope model of wavelet multi-scale transform. Second International Symposium on Intelligence Technology Application. 2008; 1: 310-314.
[7] P.Sake, L.Custar, G. Panay. A wavelet-based spatially adaptive method for mammographic contrast enhancement. Physics in Medical and Biology. 2003; 48(6):787-803.
[8] B.M.Dawant, A.P. Zijdenbos, R,A.Margolin. Connection of intensity variations in MR images for computer-aided tissue classification. IEEE Transactions on Medical Imaging. 1993; 12(4):770-781. [9] C.A.Castano, C.F.Westin, J.R.Alzois. Homomorphic filtering of DT-MRI fields. The 6th International
Conference on Medical Image Computing and Computer-Assisted Intervention. 2003; 1:339-991. [10] K.Dealc, M.Grgic, T.Kos. Sub-image homomorphic filtering technique for improving facial
identification under difficult illumination conditions. International Conference on Systems, Signals and Image Processing. 2006; 1:21-23.
[11] M.J.Seow, V.K.Asart. Ratio rule and homomorphic filter for enhancement of digital color image. Neurocomputing. 2006; 69(7): 954-958.
[13] Z.H.Qi, L.Zhang, et al. X-ray image enhancement based on the dyadic wavelet transform. Journal of X-Ray Science and Technology. 2006; 14(2):83-93.
[14] M.A.Khan, M.K.Khan, et al. A decimation free directional filter banks for medical image enhancement. Information Technology Journal. 2004; 3(2):146-149.