An Improved Dynamic Bayesian for Exchange Rate
Forecasting
Mingjuan Xu, Zhengyu Liu*
School of Information Engineering, West Anhui University, Lu’an, Anhui, 237012, P. R. China
*Corresponding author, e-mail:[email protected]
Abstract
A feasibility study of using of Dynamic Bayesian Networks in combination with ARMA modeling in exchange rate prediction is presented. A new algorithm (ARMA-DBN) is constructed and applied to the exchange rate forecast of RMB. Results show that the improved dynamic Bayesian forecast algorithm has better performance than the standard ARMA model.
Keywords: Dynamic Bayesian Network, ARMA Model, Exchange Rate Forecasting
Copyright © 2016 Universitas Ahmad Dahlan. All rights reserved.
1. Introduction
With exchange rate disputes increasingly intensified in today’s world, the RMB exchange rate is gradually becoming one of the preferred methods by which America competes with China, and the demands of its appreciation are becoming fiercer. In terms of this problem, our state leaders stress that it should be rooted in the Chinese National Condition. Presently, the biggest problem that the Chinese Foreign Exchange Control Administration is facing is how to take actions based on the status at home and abroad.
The ARMA model is an important tool to study time series, which consists of the combination of an Auto-Regression model (AR model) and a Moving Average model (MA model). This model is commonly used in the research of long-term data tracking in market research, and it is also becoming one of the mainstream forecast methods in the financial field in recent years.
The previous currency forecast algorithms often constructed a time series model using a combination of ARMA algorithms. However, these algorithms are based on the forecast of foreign currency market data, which could not make use of domestic data. For instance, a country may publish their CPI today, but whether their CPI data is high or low, the sudden effects of its value on foreign exchange market could not be completed by ARMA.
Bayesian Networks (BNs) are vital tools to express and analyze the dependency relationship between variables in probabilistic problems [1]. Sensitivity Analysis (SA) [2] is a method that investigates the effects of changing model parameters on the output of the model. The main methodology for doing this is Sensitivity Analysis in Bayesian Networks, where parameter values are changed, and the change of the output is recorded. Judged by the consideration of time parameters, Sensitivity Analysis is classified into Static Bayesian Networks (SBNs) and Dynamic Bayesian Networks (DBNs).
Combined with the advantages of the above two algorithms, a new algorithm ARMA-DBN is proposed based on a combination of ARMA and Dynamic Bayesian Networks. Experiments on exchange rate forecast data show that this algorithm achieves good results.
2. ARMA Model and Dynamic Sensitivity Function 2.1. ARMA Model
1
,
0
p
t j t j t j
X
a X
t
,
t~ WN(0,
2)
(1)Here, the
{ }
x
t in the model is the regression between the previous time values of itself, so it is named the Auto-Regression model of p-order, in which p denotes the order number,1
, , ,
2 p
…
are model parameters, and Sequence{ }
t is a random white noise sequence. The white noise is also called a residual sequence, which is generated by measurement uncertainties and errors. For the residual
t, there are two assumptions about AR(p). The first is that since{ }
t is taken as a random residual, values at different time are uncorrelated with each other. The second is that
t is uncorrelated with the sequencex
k(k<t)
at previous times. From the perspective of digital signal processing, for AR(p), if t is in the past, it can be regarded as an regression smoother of order p. If t is the current time, it can be regarded as an auto-regression filter of order p. Finally, if t is in the future, it can be regarded as an auto-auto-regression predictor of order p.For moment estimation and calculation of MA(q) model, when ,
, the time sequence complies with the q-order moving average model whose stationary condition is arbitrary (i.e., under any condition).
2.2. Definition of Dynamic Sensitivity Function
Sensitivity analysis in Static Bayesian Networks focuses on the effects of parameter variation on the conditional probability of goal nodes. Assuming that
(
i|
( )
( ))
iP H
h pa H
pa h
is a parameter, and thath
i is one value of Variable H, then the quantitypa H
(
)
represents a set of values of parent nodes for Variable H. The conditional probabilityP B
(
b E
|
e
)
represents that when the value of evidence variable E is e, theposterior probability of value b for Variable B is
P b e
( | )
. The conditional probabilityP b e
( | )
forthe sensitivity of Parameter
is expressed by the sensitivity functionf
P b e |( )
.The parameters of Dynamic Bayesian Networks change with time, and evidences need to be added in different time points dynamically, to present the problems of information transmission between adjacent time slices. Hence, function of dynamic sensitivity can be defined as below:
1 1
1
( , ,...,
)( )
(
| ,...,
)( )
.
( ,...,
)( )
t
t i T
i T
T
p b e
e
p b e
e
p e
e
(2)where T is the total time slice number, t is the time slice that goal node belongs to,
b
iis ith node, ande
j is the jth evidence node.3 Forecast Model Construction of ARMA Method 3.1. Currency and Selection
In the international market, there are various currencies, e.g., Yen, US Dollar, Euro, Ruble, Indian rupee, Pound, AUD, NZD, CAD, HK Dollar, CHF etc. Some of them are convertible currencies and some are not. The US Dollar is the main currency in international trade settlement, and according to the latest statistics by the International Monetary Fund, US Dollar accounts for 70%, the Euro accounts for 23.1%, and the remaining shares are mainly taken by Yen and Pound, but RMB only accounts for 0.41% in international trade settlement.
1 ,
q
t t j t j
j
X b t N
2
~ WN(0,
)
t
3.2. ARMA Forecast Model
In terms of how to forecast RMB exchange rates, a model is constructed to simulate China’s package monetary policies [3-6].
'
0 0
1 1
( )
(
1) * (1
)
( )
n n
i i i
i i
A t
A t
w
w B t
(3)where,
A
0 represents the dollars 1 Yuan could exchange for,A t
0( )
is the dollars 1Yuan could exchange for at time t, and
B
i represents other monetary values 1 Yuan could exchange for. The variablew
i represents the occupation of currencyB
i in international trade settlement, andA
0'represents its estimated value.Equation (3) is transformed as follows [7]:
'
0 0
1 1
( )
(
1) * (1
/
( ))
n n
i i i
i i
A t
A t
w
w
A t
(4)where
A
i represents the dollar values that 1 unit currencyB
i could exchange for. The possible values forA
i are wide, about 170 kinds of currency all over the world. Here, we take several important currencies with selecting principles [8] as: firstly, it accounts for a large proportion internationally because this can maintain stability for other currencies; secondly, it has close relation with Chinese trade because the rise and fall of this currency exerts a great influence on Chinese export trade. This kind of selection meets the reality that the RMB exchange rate is closely tied with the US Dollar. Due to the above two principles, we finally select Euro and Yen, i.e.,A
1 is the Euro against the US Dollar, andA
2 is the Yen against the US Dollar.ARMA algorithm forecast model is constructed as below: Step 1: Calculate the equation of Euro to US Dollars
Taking the 366 exchange rate values of Euro against US Dollars in 2012 as data (from Chinese Exchange Rate Net), it can be found from the check of its application ADF that Euro against US Dollar does not pass the ADF check. Therefore, Euro against US Dollar does not conform to a stationary sequence, so the Euro’s first-order difference sequence needs to be checked. The results show that the first-order difference sequence belongs to a stationary sequence, so we take the ARMA model to estimate, and q is set to 1 for convenience. It can be determined from the AIC rate and the ADF check that its first-order difference conforms to the adoption of ARMA (1,1). By calculating the coefficients, it is obtained as below:
DERO(t) = 0.1646 * DERO(t-1) + e(t) + 0.1693 * e(t-1), where DERO represents Euro’s first-order difference sequence.
Step 2: Calculate the equation of Yen against US Dollar
After the ADF check of Yen against US Dollar, it does not pass the check. Therefore, Yen against US Dollar does not conform to a stationary sequence, so, as above, the Yen’s first-order difference sequence needs to be checked. The results show that the first-first-order difference sequence belongs to a stationary sequence, so we take the ARMA model to estimate. It can be determined from the AIC rate and the ADF check that its first-order difference conforms to the adoption of ARMA (2,1). By calculating the coefficients, it is obtained as below:
DJPY(t) = -0.0183 * DJPY(t-1) + 0.0075*DJPY(t-2) + e(t)-0.0287*e(t-1), where DJPY represents Yen’s first-order difference sequence.
Step 3: The forecast model is constructed as follows:
4. Construction of ARMA-DBN Algorithm Forecast Model 4.1. Main Economic Data
Based on actual demands, the following seven main economic data are taken as the nodes of the Dynamic Bayesian Networks, with the nodes’ descriptions as below:
1. International trade balance: with the consideration of changes brought by its pressure, if the proportion of the trade surplus/ deficit in total trade is within plus/ minus 2%, it is considered normal behavior.
2. Interest rate: relative to another country’s interest rate, if a country’s key rate is rising, falling or maintaining unchanged.
3. Inflation rate: in general taking 2.5% as the dividing line, if the inflation rate is higher than 2.5%, it belongs to strong inflation, and if between 0% and 2.5%, it belongs to mild inflation.
4. Economic situation [9]: assuming a country’s economic growth rate is approximately 15% higher or lower than last year, it indicates that the economic situation changes, which is likely to lead to capital outflow, even bringing about exchange rate depreciation.
5. Unemployment rate: over 7.9% is a rather large unemployment rate, and under this condition currency is forced to depreciate and labor cost is reduced, so enterprise managers will take advantage of every opportunity in manufacturing industry.
6. Industry order index: taking 0.75% as dividing line, if link index exceeds 0.75 percentage points, it indicates an improvement.
7. Business inventory index: once the link index exceeds 0.5 percentage points, it indicates decline, therefore depreciation is executed to clear inventory.
4.2. Construction of Dynamic Bayesian Network
Combined with the above seven factors and exchange rates, we can develop a Dynamic Bayesian Network. All these data are obtained from the Chinese Economy Net and Chinese Exchange Rate Net, from early 2007 to the end of 2012. Here, one point should be noted that other data could be obtained monthly, and only the exchange rate is different. Therefore, to keep consistency with other data, it is stipulated that, at the beginning and end of a month, the exchange rates must be recorded, and if the exchange rate early in the month is larger than, less than or the same as that of the end of the month respectively, then we denote these situations by exchange rates falling, rising, or unchanged, respectively.
The construction of the Dynamic Bayesian Network is as follows:
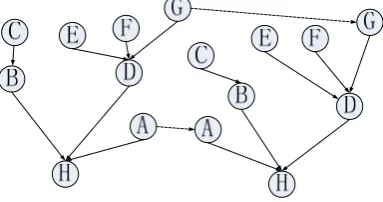
Step 1: Taking the seven factors and exchange rate as the nodes of the Dynamic Bayesian Network, nodes A-H represent respectively: international trade balance, exchange rate, inflation rate, economic situation, unemployment rate, industry bilings index, business inventory index, exchange rate of RMB against US Dollar. The sample data should be processed discretely [10].
Step 2: For each node, the IAMB algorithm [11] is used to learn its Markov blanket [12] [13].
Step 3: For this Markov blanket, EM (Expectation Maximization) [14] is used to learn the conditional probability parameters of the initial network from sample data [15].
Step 4: The DP [16] algorithm (with a threshold value of 0.6) is used to train the network between two adjacent time slices.
Step 5: The EM algorithm is used to train the conditional probability parameters between two adjacent time slices [17].
Step 6: By combining Step 4 and Step 5, DBN is trained as follows:
In the current situation, it is predicted that the probability of serious inflation is y, which may have influence on the following month’s exchange rate, and the sensitivity function can be calculated as:
2
2
0.9358
+1.2270y+0.1612
2.2308y -0.538y+1
y
z
(5)Figure 1. Dynamic Bayesian Network constructed by ARMA-DBN algorithm
4.3. DBN Algorithm Based on ARMA
Based on the above construction of the Dynamic Bayesian Network and the advantages of ARMA, the DBN algorithm based on ARMA is designed as follows:
Step 1: Improve ARMA model as below:
A'(t) = A(t-1) * (1- w1- w2+ w1/JPY(t)+ w2/ERO(t))
+ * * (|max (A(WEEK))-min (A(week))|), where the values of and are determined by DBN model.
Step 2: Adopting the above Dynamic Bayesian Network to forecast exchange rate: if the rising or falling probability of the exchange rate is larger than 66.7%, this conclusion is accepted, i.e., = -1 or 1, otherwise the exchange rate would be considered to be balanced, i.e., = 0. The value is the absolute value of the rising or falling exchange rate in the past month or year. The value Max (A(WEEK)) is the highest value in the past week, while min (A(week)) is the lowest.
Step 3: Combining the above two steps, the DBN algorithm based on ARMA is reached. If the influence of domestic factors on exchange rates is included, this model will be more robust to predict the trend of the exchange rate forecast. If the forecast probability with serious inflation is 80%, according to the calculation in Section 4.2, z is 87.5%, and =-1. Moreover, according to the calculation, is 0.1287, and |max (A(WEEK))-min (A(week))| is 0.042.
5. Results and Discussion
Taking the trend of the RMB in Jan. 2013 as a forecast analysis object, two different models are used to forecast, with results shown in Figure 2.
Figure 2. Accuracy comparison of algorithm forecasts
[image:5.595.168.411.554.669.2]when National Statistics Bureau published industry billings index and inflation data. It shows that the ARMA model is highly insensitive to the effects of domestic factors on exchange rate. By employing the ARMA-DBN model for forecast, it shows that 19 out of 23 days are right and 4 days are wrong, and the accuracy rises to 82.6%. The improved algorithm not only increases the forecast hit rate, but also decreases continuous forecast faults.
6. Conclusions
According to the sensitivity analysis on Dynamic Bayesian Networks, an improved ARMA-DBN algorithm is constructed to forecast exchange rate based on the advantages of ARMA model, and experiment results have shown great application value. However, for a better application prospect, there are still many works in ARMA model to be improved.
Acknowledgements
This work is supported by the National Natural Science Foundation of China (Nos.61375121, 61075049), the Provincial Project of Natural Scientific Research Fund from the Bureau of Education of Anhui Province, China (No.KJ2011Z401), Anhui Provincial Science Funds for Excellent Youths of Universities (No.2011SQRL150), Anhui Provincial Projects of Teaching Quality (Nos.2012jyxm433, 2015jyxm289, 2015zy051). Corresponding author: [email protected] (Z.Y. Liu).
References
[1] Ontrup J, Wersing H, Ritter H. A computational feature binding model of human texture perception. Cognitive Processing. 2004; 5(1): 31-44.
[2] Laskey KB.Sensitivity analysis for probability assessments in Bayesian networks. IEEE Transactions
on Systems, Man, and Cybernetics. 1995, 25(6): 901-909.
[3] Liu M, Zhang G, Song X, et al. Design of the Monolithic Integrated Array MEMS Hydrophone. IEEE
Sensors Journal. 2016; 16(4): 989-995.
[4] Huang JS. Comparative study of ARMA forecast model and smooth ARMA forecast model – based
on annual CPI China of Guizhou Province in 1950-2011. Modern Economic Information. 2012; (1):
134-136.
[5] Cotilla-Sanchez E, Hines PDH, Barrows C, et al. Comparing the Topological and Electrical Structure
of the North American Electric Power Infrastructure. Systems Journal IEEE. 2011; 6(4): 616-626.
[6] Zuhong Feng, Xiujuan Gao, Long Wang. Bayesian Network Structure Learning Based On Rough Set
and Mutual Information. TELKOMNIKA (Indonesian Journal of Electrical Engineering). 2014; 12(2):
1596-1601.
[7] Han MQ. Empirical research of pledge repo rate between banks based on ARMA model.Journal of
Financial Research. 2015; 5(3): 335-341.
[8] Liu P. Comparative study of ARMA modeling methods. National Simulation Technological
Conference. Computer Simulation Press. 2014; 17-22.
[9] Smolczynski S. Abundance of hydrogenic soils of the Vistula River delta in elements soluble in 0.5 m HCL. Computational Intelligence & Neuroscience. 1999; 2015(5): 1-9.
[10] Boudali H, Dugun JB. A Contiuous-Time Bayeshome Network Reliability Modeling, and Analysis
Framework. IEEE Transaction on Reliability. 2014; 55(1): 86-97
[11] Wang ZF, Wang ZH, Fu B. Structure studying method of a kind of partial rating search restrictive
Bayesian network.Journal of Nanjing University (Natural Science Edition). 2014; 51(5): 656-664.
[12] TPennestrì E, Belfiore NP. On Crossley's contribution to the development of graph based algorithms
for the analysis of mechanisms and gear trains. Mechanism & Machine Theory. 2015; 89: 92-106.
[13] Corbier C, Badaoui ME, Ugalde HMR. Huberian Approach for Reduced Order ARMA Modeling of
Neurodegenerative Disorder Signal. Signal Processing. 2015, 113: 273-284.
[14] Timo JTK, John MN. A Review of Bayesian Networks and Structure Learning. Mathematica
Applicanda. 2012; 40(1): 53–103.
[15] Susanto BM. Naïve Bayes Decision Tree Hybrid Approach for Intrusion Detection System. Bulletin of
Electrical Engineering and Informatics. 2013; 2(3): 225-232.
[16] Xin Li, Ting Li. E-commerce System Security Assessment based on Bayesian Network Algorithm
Research. TELKOMNIKA (Indonesian Journal of Electrical Engineering). 2013; 11(1): 338-344.