GROWTH TRAJECTORY OF BODY SIZE IN BADUY PEOPLE
ENENG NUNUZ ROHMATULLAYALY
GRADUATE SCHOOL
BOGOR AGRICULTURAL UNIVERSITY BOGOR
STATEMENT LETTER
I hereby declare that thesis entitled Growth Trajectory of Body Size in Baduy People is original result of my own research supervised under advisory committee and has never been submitted in any form at any institution before. All information from other authors cited here are mentioned in the text and listed in the reference at the end part of the thesis.
Bogor, May 2012
ABSTRACT
ENENG NUNUZ ROHMATULLAYALY. Growth Trajectory of Body Size in Baduy People. Supervised by BAMBANG SURYOBROTO, ACHMAD FARAJALLAH.
The measurenment of body size is the best way to find out the health, nutritional status and quality of life of a population. Many indigenous populations that are local, scattered, and less or not involved in the network of social services, economic and politics, have specific growth trajectories. Baduy people are indigenous population which is more-or-less socially isolated. Marriage is restricted among Baduy people only. Present study aims to determine the growth trajectory of female and male of Baduy people with cross-sectional method. Body size of Baduy people may be categorized as same size as pygmy population. They have a slow growth rate at child to juvenile transition, low and long growth spurt with prolonged growth well beyond reproductive maturation. Low growth spurt, which leads to small body size in the growing period, may be a saving on body maintenance costs. Prolonged somatic growth offset the slow growth rate at child to juvenile transition and low growth spurt. Baduy people older than 30 year are shorter and smaller than younger people, suggesting secular trend.
ABSTRAK
ENENG NUNUZ ROHMATULLAYALY. Lintasan Pertumbuhan dari Ukuran Tubuh Orang Baduy. Dibimbing oleh BAMBANG SURYOBROTO, ACHMAD FARAJALLAH.
Mengukur ukuran tubuh adalah cara yang paling baik untuk melihat tingkat kesehatan, status nutrisi, dan kualitas hidup dari suatu populasi manusia. Banyak penduduk asli dan lokal, tersebar, dan kurang atau tidak terlibat dalam jaringan pelayanan sosial, ekonomi, dan politik, memiliki pola pertumbuhan yang spesifik. Orang Baduy adalah penduduk asli yang kurang lebih hidup terisolasi secara sosial. Pernikahan hanya dilakukan sesama Orang Baduy saja. Penelitian ini bertujuan untuk menentukan lintasan pertumbuhan Orang Baduy yang meliputi wanita dan pria dengan metode cross-sectional. Ukuran tubuh Orang Baduy dapat dikategorikan kedalam populasi Pygmy. Mereka memiliki tingkat pertumbuhan yang lambat pada masa transisi dari anak-anak ke remaja, percepatan pertumbuhan yang rendah dan lama dengan tingkat pertumbuhan lebih panjang daripada masa kematangan reproduksi. Percepatan pertumbuhan yang rendah, menyebabkan ukuran tubuh kecil di masa pertumbuhan, mungkin merupakan cara menyimpan daya untuk pemeliharaan tubuh. Pertumbuhan somatik yang berkepanjangan diimbangi dengan tingkat pertumbuhan yang lambat pada masa anak-anak ke remaja dan percepatan pertumbuhan yang rendah. Orang Baduy yang lebih tua lebih dari 30 tahun, lebih pendek dan kecil dari orang yang lebih muda, hal ini menunjukkan tren sekuler.
SUMMARY
ENENG NUNUZ ROHMATULLAYALY. Growth Trajectory of Body Size in Baduy People. Supervised by BAMBANG SURYOBROTO, ACHMAD FARAJALLAH.
Human life history begins from prenatal life, birth, and then growth and development into infancy, children, juvenile, adolescent, adult and senescence. Growth dominates about two decades after birth. The body height and body weight are the most commonly used anthropometric measurement in growth study. The growth pattern of body size is the best way to find out the health, nutritional status and quality of life of a population. The growth pattern researches in Indonesia are scarce in relation to hundreds of existing tribes and especially to indigenous populations. These populations are socio-cultural groups that are local, scattered, and less or not involved in the network of social services, economic, and politics. Baduy people are indigenous population, live in Kendeng Mountains, Banten Province, Indonesia.
Present study aims to determine the growth pattern of female and male of Baduy people with cross-sectional method. Total subjects were 284 females and 168 males aged 5 to 42 years. The data of body weight (kg), body height (cm), and body mass index (kg/m2) were analyzed using Generalized Additive Models for Location, Scale and Shape (GAMLSS). The median values of growths were used to calculate annual velocity.
Body size of Baduy people may be categorized as pygmy according to Perry
and Dominy’s definition because their average adult height is less than 160 cm.
Being small body, Baduy people have similar body height to the 5th percentile of Purwakarta population. Their body weight was greater than 5th percentile but smaller than 50th percentile of Purwakarta population. On the other hand, Baduy people were consistently smaller than 5th percentile of U.S. population.
GHBP (Growth Hormone Binding Protein), and IGF-I level. However, the level of GH and IGF-I in Baduy people remains to be measured.
Prolonged somatic growth into 30 years of age proceeds well beyond reproductive maturation. This prolonged phase offset the slow growth rate at child to juvenile transition. Age at menarche of Baduy people is similar to other pygmy populations. However, age at first reproduction is slower than Pygmy populations which have early first reproduction to maximize reproductive fitness in a high-mortality environment.
Baduy people older than 30 year are shorter and smaller than younger people. Differences in body size between Baduy people separated in these three decades may suggests secular trend.
Copyright © 2012. Bogor Agricultural University
All Rights Reserved
It is prohibited to cite all or a part of this thesis without referring to and mentioning the source. Citation is permitted for the purposes of education, research, scientific paper, report, or critism writing only; and it does not defame
the name and honour of Bogor Agricultural University.
GROWTH TRAJECTORY OF BODY SIZE IN BADUY PEOPLE
ENENG NUNUZ ROHMATULLAYALY
Thesis
Submitted in partial fulfilment of the requirements for a Master Degree in Animal Bioscience Major of Graduate School of Bogor Agricultural University
GRADUATE SCHOOL
BOGOR AGRICULTURAL UNIVERSITY BOGOR
ENDORSEMENT PAGE
Title : Growth Trajectory of Body Size in Baduy People Name : Eneng Nunuz Rohmatullayaly
Student ID : G352100051 Major : Animal Biosciences
Endorsed by,
Supervisory Committee
Dr. Bambang Suryobroto Dr. Ir. Achmad Farajallah, M.Si
Chair Member
Acknowledged by,
Chair of Major of Animal Biosciences Dean of Graduate School,
Dr. Bambang Suryobroto Dr. Ir. Dahrul Syah, M.Sc.Agr
PREFACE
The title of this thesis is Growth Trajectory of Body Size in Baduy People. The research took place in the Baduy village, Lebak District, Banten Province and Section of Biosystematic and Ecology of Animals, Departement of Biology, Faculty of Matemathics and Natural Sciences, Bogor Agricultural University.
I want to send my gratitude to my supervisor Dr. Bambang Suryobroto and Dr. Achmad Farajallah and to my examiner Dr. Tetri Widiyani for the generous support and great discussion. Especially thank to Jaro Dainah, Pak Marsadi, Bidan Eros, Kang Saidam, Teh Karibah, Teh Eneng, Teh Sodah, Teh Daisah, Teh Adah, Kang Sarpin, Teh Misnah, Jani, Emi, and all subject in Baduy for their help and
permission throughout my study. Thank to all people in Zoo Corner, OWA’s family, Wisma Intan’s family for their supports for my study. Special thank to my
family (H. Mustamin’s family and Sarjapi’s family), my parent, my brother, and
my sister for your love and support. Therefore, above all, I thank God Allah SWT for His almighty.
Bogor, May 2012
CURRICULUM VITAE
Author was born in Pandeglang on 3th of August 1988 as the first child of three from the parent, H. Roharjono and Hj. Ida Masdaiah.
CONTENTS
Page
LIST OF TABLES ... xiv
LIST OF FIGURES ... xiv
INTRODUCTION ... 1
LITERATURE STUDY ... 3
METHODS ... 8
a. Subject ... 8
b. Determination of age ... 8
c. Body size measurement... 11
d. Data analysis ... 11
RESULT ... 12
DISCUSSION ... 18
CONCLUSION ... 20
LIST OF TABLES
Page
1. Sociodemography of indigenous populations ... 5
2. Demography of Baduy people ... 6
3. Name of the village and the number of subjects ... 9
4. Number of subjects by age ... 10
5. Comparison growth of body height diagnostic ... 16
6. Comparison growth of body weight diagnostic and life history ... 17
LIST OF FIGURES Page 1. Baduy Dalam and Baduy Luar ... 5
2. Villages of Baduy people ... 7
3. Location of research sampling (red) ... 9
4. Growth patterns of body height (cm) and velocity (cm/year) ... 12
5. Growth patterns of body weight (kg) and velocity (kg/year) ... 13
6. Growth patterns of body mass index (BMI) (kg/m2) and velocity (kg/m2/year) ... 14
INTRODUCTION
Human life history begins from prenatal life, birth, and then growth and development into infancy, children, juvenile, adolescent, adult and senescence. Growth and developmental processes take place simultaneously. Growth is a process of accretion and the total number of cells or tissues is physically visible and measurable. Development is the process of developing the body structure based on specific function (Bogin 1999).
Growth dominates about two decades after birth. The growth of body height and body weight is the most commonly used anthropometric measurement in the study of body size (Malina et al. 2004). In fact, their measurement is one of the best ways to find out the health, nutritional status and quality of life of a population (Rogol et al. 2000; de Onis & Blössner 2003; Harris et al. 2001).
but number of the subjects was limited. Present study extends his study and aims to determine the growth pattern of female and male of Baduy people.
Baduy people may be categorized as pygmy according to Perry and
Dominy’s definition because their average adult height is less than 160 cm. They
LITERATURE STUDY
Growth and development are regulated by growth hormone/insulin like growth hormone I (GH/IGF-I). IGF-I relates to growth rates and pubertal growth spurt in conjunction with sex steroids. IGFs get low six month after birth and increase again in later infancy (Bogin 1999; Skalkidou et al. 2003; Walker et al. 2006). At puberty, GH/IGF-I is reactivated by hypothalamus (Geary et al. 2003; Bernstein 2010). After puberty, GH decreases but IGF-I level remains elevated though less than maximum (Bernstein 2010). This reactivation is of short duration, being only a few days or weeks. The initial manifestation of puberty is the acceleration of growth (growth spurt), which may be considered as a signal of the maturation of the reproductive system (Bogin 1999).
Optimum living condition and better nutrition result in the optimal growth of body height and weight (Sundquist & Johansson 1998). However, in indigenous population that is local, scattered, and less or not involved in the network of social services, economic, and politics, the biocultural conditions lead to varied growth trajectories. In an environment with fluctuating food availability and epidemiological stress, girls may commit energy to higher growth velocities
as long as conditions are conducive. In Pumė indigenous population of
southwestern Venezuela growth data suggest that early investment in growth and staggered investments in height and weight gains is one response to variable, risky or poor energetic conditions (Kramer & Greaves 2010). Other indigenous population are categorized as Pygmy population because of having an average males height <155 cm or <160 cm (Migliano et al. 2007; Perry & Dominy 2009). Pygmy body size results from a tradeoff between time invested in growth and product of selection for early onset of reproduction (Migliano et al. 2007). Juvenile mortality risks are the main force behind faster and earlier growth that give their adult body size. The larger body size at young ages may be important for combating parasites and infectious diseases (Walker et al. 2006).
They live in farming, foraging, and harvesting natural product. Most of indigenous populations live in the forest or rural area.
Baduy people are indigenous population (Komunitas Adat Terpencil/KAT) acknowledged by Presidential Decree (Keputusan Presiden No. 111/1999) live in Kendeng Mountains, Banten Province, Indonesia. Baduy people occupied an area of 5136.58 ha of hilly areas with altitude 400-600 above sea level. The area comprises of forest preserve (± 3000 ha) and settlement or villages (± 2136.58 ha). Their settlement consists of 60 villages including three Baduy Dalam villages named Cibeo, Cikartawana, and Cikeusik (Kurnia & Sihabudin 2010; Erwinatu 2012).
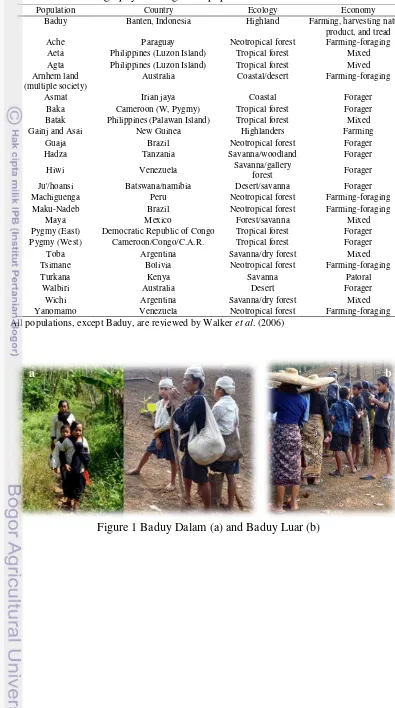
Baduy people are divided into Baduy Dalam and Baduy Luar. Baduy Dalam can be said to be a representation of past cultural heir from their population ancestors. Baduy Luar is prepared as a guard, buffer, protective, and connector to interact with outer population and the state government. Their outlook difference lies in their clothing that is black-white with a white headband and barefoot in Baduy Dalam, while Baduy Luar is all black with batik headbands and may use footware (Figure 1). Baduy Dalam should not use vehicle when traveling (Kurnia & Sihabudin 2010).
Table 1 Sociodemography of indigenous populations
Population Country Ecology Economy
Baduy Banten, Indonesia Highland Farming, harvesting natural
product, and tread
Ache Paraguay Neotropical forest Farming-foraging
Aeta Philippines (Luzon Island) Tropical forest Mixed
Agta Philippines (Luzon Island) Tropical forest Mived
Arnhem land (multiple society)
Australia Coastal/desert Farming-foraging
Asmat Irian jaya Coastal Forager
Baka Cameroon (W, Pygmy) Tropical forest Forager
Batak Philippines (Palawan Island) Tropical forest Mixed
Gainj and Asai New Guinea Highlanders Farming
Guaja Brazil Neotropical forest Forager
Hadza Tanzania Savanna/woodland Forager
Hiwi Venezuela Savanna/gallery
forest Forager
Ju'/hoansi Batswana/namibia Desert/savanna Forager
Machiguenga Peru Neotropical forest Farming-foraging
Maku-Nadeb Brazil Neotropical forest Farming-foraging
Maya Mexico Forest/savanna Mixed
Pygmy (East) Democratic Republic of Congo Tropical forest Forager
Pygmy (West) Cameroon/Congo/C.A.R. Tropical forest Forager
Toba Argentina Savanna/dry forest Mixed
Tsimane Bolivia Neotropical forest Farming-foraging
Turkana Kenya Savanna Patoral
Walbiri Australia Desert Forager
Wichi Argentina Savanna/dry forest Mixed
Yanomamo Venezuela Neotropical forest Farming-foraging
All populations, except Baduy, are reviewed by Walker et al. (2006)
Figure 1 Baduy Dalam (a) and Baduy Luar (b)
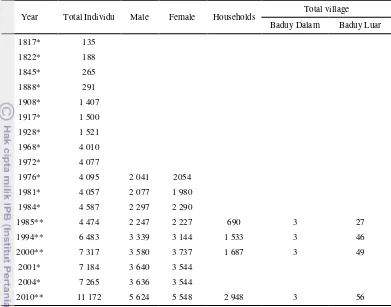
[image:19.595.111.518.98.417.2]Table 2 Demography of Baduy people
Year Total Individu Male Female Households
Total village
Baduy Dalam Baduy Luar
1817* 135
1822* 188
1845* 265
1888* 291
1908* 1 407
1917* 1 500
1928* 1 521
1968* 4 010
1972* 4 077
1976* 4 095 2 041 2054
1981* 4 057 2 077 1 980
1984* 4 587 2 297 2 290
1985** 4 474 2 247 2 227 690 3 27
1994** 6 483 3 339 3 144 1 533 3 46
2000** 7 317 3 580 3 737 1 687 3 49
2001* 7 184 3 640 3 544
2004* 7 265 3 636 3 544
2010** 11 172 5 624 5 548 2 948 3 56
Blank cells : data not available; *data reviewed by Hakim 2006; **data reviewed by Lubis 2009 and Kurnia & Sihabudin 2010
Baduy people have a different calendar system which is not recorded in writing. They have two solar calendar systems that are 366 days and 360 days a year (Kurnia & Sihabudin 2010). The relationship between both systems is not clear, as also both to the international calendar.
Majority of Baduy people live in farming (growing rice) and harvesting of forest products and a few live in trade (Hestiwati 1983; Lubis 2009; Kurnia & Sihabudin 2010; Erwinatu 2012). Most family does not know their income and outcome. Based on foods they eat, it can be calculated that they had outcome in equivalent to less than IDR 1 000 000 for every family (Rohmatullayaly 2010).
year 2012 total village 60 that is consisting of 3 Baduy Dalam and 57 Baduy Luar (Erwinatu 2012).
Distances between villages are far and connected by walkways. Houses are built in cluster forming a village. Each house is facing the same direction aligning to the north and south axis (Kurnia & Sihabudin 2010). Because of their culture forbade the slightest change of land form, the villages are situated between hills, utilizing the existing flat land (Figure 2).
METHODS
The Baduy people live in Desa Kanekes, Kecamatan Lewidamar, Kabupaten Lebak, Provinsi Banten, Indonesia (Figure 3). They live in three villages of Baduy Dalam and 57 villages of Baduy Luar. The research was conducted in July to November 2011. Data analysis was carried out at Section of Biosystematic and Ecology of Animals, Departement of Biology, Faculty of Matemathics and Natural Sciences, Bogor Agricultural University.
a. Subject
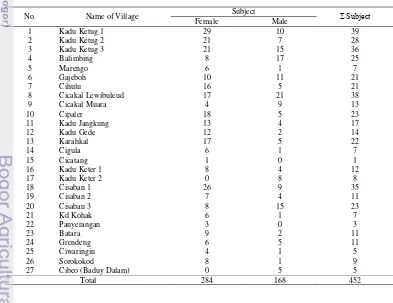
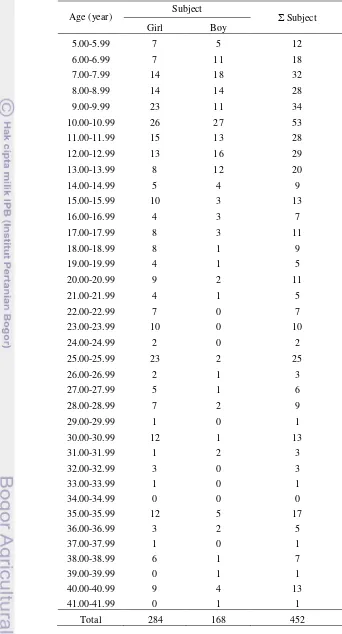
The subjects were sampled in one Baduy Dalam village and 26 Baduy Luar villages of Kanekes using cross-sectional method (Table 3). Before data collection, subjects were given an explanation of the study and they signed an informed consent. The authenticity of the tribe was assessed by asking where the birthplace of their parents. Total subjects were 284 females and 168 males, excluding outliers. Outlier is defined as subjects beyond 2.3 to 97.7 percentile in preliminary analyses (see Data Analysis). The subjects were aged 5 to 42 years old ranging from juvenile through the end stage of adult (Table 4). The subjects in this study shared similar living and economic conditions in which agriculture being their principal source of livehood.
b. Determination of age
Figure 3 Location of research sampling (red)
Table 3 Name of the village and the number of subjects
No. Name of Village Subject Σ Subject
Female Male
1 Kadu Ketug 1 29 10 39
2 Kadu Ketug 2 21 7 28
3 Kadu Ketug 3 21 15 36
4 Balimbing 8 17 25
5 Marengo 6 1 7
6 Gajeboh 10 11 21
7 Cihulu 16 5 21
8 Cicakal Lewibuleud 17 21 38
9 Cicakal Muara 4 9 13
10 Cipaler 18 5 23
11 Kadu Jangkung 13 4 17
12 Kadu Gede 12 2 14
13 Karahkal 17 5 22
14 Cigula 6 1 7
15 Cicatang 1 0 1
16 Kadu Keter 1 8 4 12
17 Kadu Keter 2 0 8 8
18 Cisaban 1 26 9 35
19 Cisaban 2 7 4 11
20 Cisaban 3 8 15 23
21 Kd Kohak 6 1 7
22 Panyerangan 3 0 3
23 Batara 9 2 11
24 Grendeng 6 5 11
25 Ciwaringin 4 1 5
26 Sorokokod 8 1 9
27 Cibeo (Baduy Dalam) 0 5 5
[image:23.595.112.505.426.729.2]Table 4 Number of subjects by age
Age (year) Subject Σ Subject
Girl Boy
5.00-5.99 7 5 12
6.00-6.99 7 11 18
7.00-7.99 14 18 32
8.00-8.99 14 14 28
9.00-9.99 23 11 34
10.00-10.99 26 27 53
11.00-11.99 15 13 28
12.00-12.99 13 16 29
13.00-13.99 8 12 20
14.00-14.99 5 4 9
15.00-15.99 10 3 13
16.00-16.99 4 3 7
17.00-17.99 8 3 11
18.00-18.99 8 1 9
19.00-19.99 4 1 5
20.00-20.99 9 2 11
21.00-21.99 4 1 5
22.00-22.99 7 0 7
23.00-23.99 10 0 10
24.00-24.99 2 0 2
25.00-25.99 23 2 25
26.00-26.99 2 1 3
27.00-27.99 5 1 6
28.00-28.99 7 2 9
29.00-29.99 1 0 1
30.00-30.99 12 1 13
31.00-31.99 1 2 3
32.00-32.99 3 0 3
33.00-33.99 1 0 1
34.00-34.99 0 0 0
35.00-35.99 12 5 17
36.00-36.99 3 2 5
37.00-37.99 1 0 1
38.00-38.99 6 1 7
39.00-39.99 0 1 1
40.00-40.99 9 4 13
41.00-41.99 0 1 1
c. Body size measurement
Body size measurements were body weight (BW) and body height (BH). Body mass index (BMI) (kg/m2) was calculated using formula: BMI (kg/m2) = BW (kg) / BH (m2) (WHO 1995).
d. Data analysis
RESULT
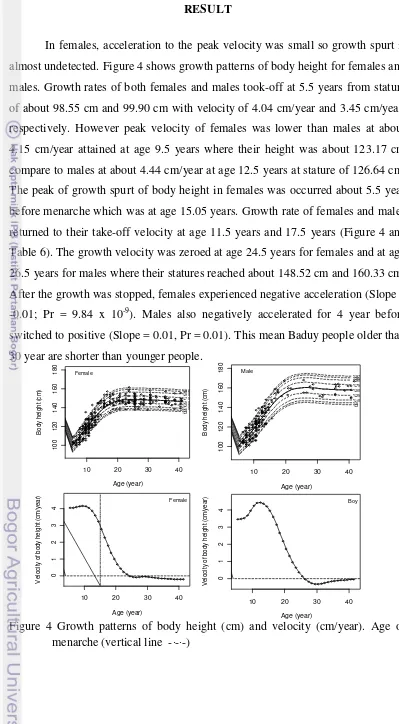
In females, acceleration to the peak velocity was small so growth spurt is almost undetected. Figure 4 shows growth patterns of body height for females and males. Growth rates of both females and males took-off at 5.5 years from stature of about 98.55 cm and 99.90 cm with velocity of 4.04 cm/year and 3.45 cm/year, respectively. However peak velocity of females was lower than males at about 4.15 cm/year attained at age 9.5 years where their height was about 123.17 cm compare to males at about 4.44 cm/year at age 12.5 years at stature of 126.64 cm. The peak of growth spurt of body height in females was occurred about 5.5 year before menarche which was at age 15.05 years. Growth rate of females and males returned to their take-off velocity at age 11.5 years and 17.5 years (Figure 4 and Table 6). The growth velocity was zeroed at age 24.5 years for females and at age 26.5 years for males where their statures reached about 148.52 cm and 160.33 cm. After the growth was stopped, females experienced negative acceleration (Slope = -0.01; Pr = 9.84 x 10⁻⁹). Males also negatively accelerated for 4 year before switched to positive (Slope = 0.01, Pr = 0.01). This mean Baduy people older than 30 year are shorter than younger people.
Figure 4 Growth patterns of body height (cm) and velocity (cm/year). Age of menarche (vertical line -∙-∙-)
10 20 30 40
100 120 140 160 180 Age (year) B o d y h e ig h t ( cm ) Female %97 %95 %90 %75 %50 %25 %10 %5 %3
10 20 30 40
0 1 2 3 4 Age (year) V e lo ci ty o f b o d y h e ig h t ( cm /ye a r) Female
10 20 30 40
100 120 140 160 180 Age (year) B o d y h e ig h t ( cm ) Male %97 %95 %90 %75 %50 %25 %10 %5 %3
10 20 30 40
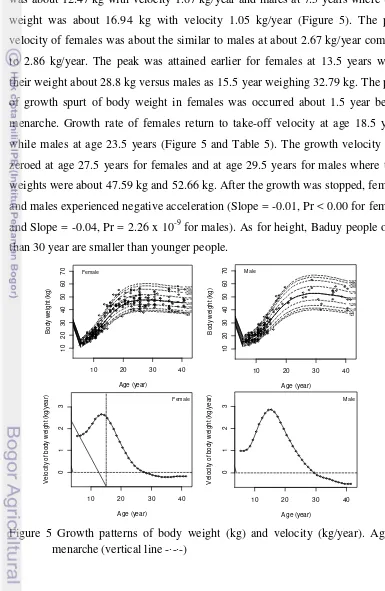
[image:26.595.104.503.83.807.2]Growth patterns of body weight follow the same trajectories as body height but in different tempo. However, the growth spurt of body weight occurred earlier in females than males. Females take-off at age 5.5 years where their weight was about 12.47 kg with velocity 1.67 kg/year and males at 7.5 years where their weight was about 16.94 kg with velocity 1.05 kg/year (Figure 5). The peak velocity of females was about the similar to males at about 2.67 kg/year compare to 2.86 kg/year. The peak was attained earlier for females at 13.5 years where their weight about 28.8 kg versus males as 15.5 year weighing 32.79 kg. The peak of growth spurt of body weight in females was occurred about 1.5 year before menarche. Growth rate of females return to take-off velocity at age 18.5 years while males at age 23.5 years (Figure 5 and Table 5). The growth velocity then zeroed at age 27.5 years for females and at age 29.5 years for males where their weights were about 47.59 kg and 52.66 kg. After the growth was stopped, females and males experienced negative acceleration (Slope = -0.01, Pr < 0.00 for females and Slope = -0.04, Pr = 2.26 x 10⁻⁹ for males). As for height, Baduy people older than 30 year are smaller than younger people.
Figure 5 Growth patterns of body weight (kg) and velocity (kg/year). Age of menarche (vertical line -∙-∙-)
10 20 30 40
10 20 30 40 50 60 70 Age (year) B o d y w e ig h t (kg ) Female %97 %95 %90 %75 %50 %25 %10 %5 %3
10 20 30 40
10 20 30 40 50 60 70 Age (year) B o d y w e ig h t (kg ) Male %97 %95 %90 %75 %50 %25 %10 %5 %3
10 20 30 40
0 1 2 3 Age (year) V e lo ci ty o f b o d y w e ig h t (kg /ye a r) Female
10 20 30 40
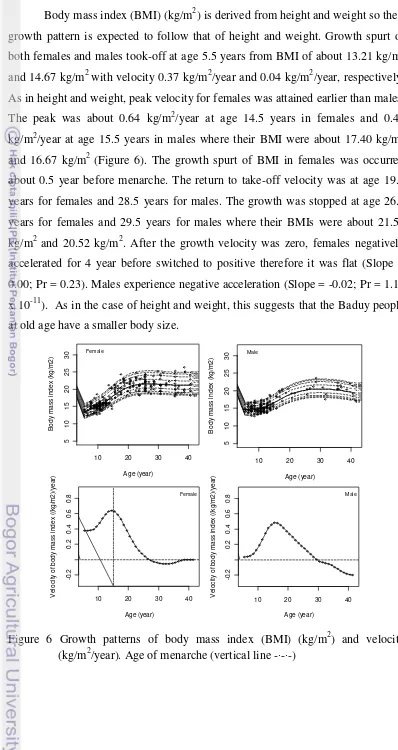
[image:27.595.104.489.155.746.2]Body mass index (BMI) (kg/m2) is derived from height and weight so their growth pattern is expected to follow that of height and weight. Growth spurt of both females and males took-off at age 5.5 years from BMI of about 13.21 kg/m2 and 14.67 kg/m2 with velocity 0.37 kg/m2/year and 0.04 kg/m2/year, respectively. As in height and weight, peak velocity for females was attained earlier than males. The peak was about 0.64 kg/m2/year at age 14.5 years in females and 0.48 kg/m2/year at age 15.5 years in males where their BMI were about 17.40 kg/m2 and 16.67 kg/m2 (Figure 6). The growth spurt of BMI in females was occurred about 0.5 year before menarche. The return to take-off velocity was at age 19.5 years for females and 28.5 years for males. The growth was stopped at age 26.5 years for females and 29.5 years for males where their BMIs were about 21.56 kg/m2 and 20.52 kg/m2. After the growth velocity was zero, females negatively accelerated for 4 year before switched to positive therefore it was flat (Slope = 0.00; Pr = 0.23). Males experience negative acceleration (Slope = -0.02; Pr = 1.14 x 10⁻¹¹). As in the case of height and weight, this suggests that the Baduy people at old age have a smaller body size.
Figure 6 Growth patterns of body mass index (BMI) (kg/m2) and velocity (kg/m2/year). Age of menarche (vertical line -∙-∙-)
10 20 30 40
5 10 15 20 25 30 Age (year) B o d y m a ss in d e x (kg /m 2 ) Female %97 %95 %90 %75 %50 %25 %10 %5 %3
10 20 30 40
5 10 15 20 25 30 Age (year) B o d y m a ss in d e x (kg /m 2 ) Male %97 %95 %90 %75 %50 %25 %10 %5 %3
10 20 30 40
-0 .2 0 .2 0 .4 0 .6 0 .8 Age (year) V e lo ci ty o f b o d y m a ss in d e x (( kg /m 2 )/ ye a r) Female
10 20 30 40
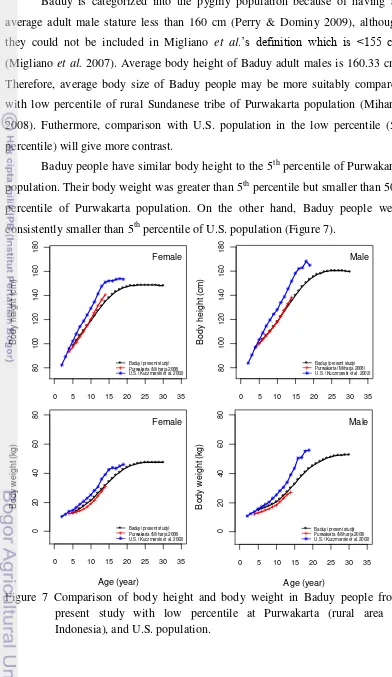
[image:28.595.105.503.77.827.2]Baduy is categorized into the pygmy population because of having an average adult male stature less than 160 cm (Perry & Dominy 2009), although they could not be included in Migliano et al.’s definition which is <155 cm (Migliano et al. 2007). Average body height of Baduy adult males is 160.33 cm. Therefore, average body size of Baduy people may be more suitably compared with low percentile of rural Sundanese tribe of Purwakarta population (Miharja 2008). Futhermore, comparison with U.S. population in the low percentile (5th percentile) will give more contrast.
Baduy people have similar body height to the 5th percentile of Purwakarta population. Their body weight was greater than 5th percentile but smaller than 50th percentile of Purwakarta population. On the other hand, Baduy people were consistently smaller than 5th percentile of U.S. population (Figure 7).
Figure 7 Comparison of body height and body weight in Baduy people from present study with low percentile at Purwakarta (rural area in Indonesia), and U.S. population.
0 5 10 15 20 25 30 35
80 100 120 140 160 180 B o d y h e ig h t (cm ) Female
Baduy (present study) Purwakarta (Miharja 2008) U.S. (Kuczmarski et al. 2002)
0 5 10 15 20 25 30 35
80 100 120 140 160 180 B o d y h e ig h t (cm ) Male
Baduy (present study) Purwakarta (Miharja 2008) U.S. (Kuczmarski et al. 2002)
0 5 10 15 20 25 30 35
0 20 40 60 80 Age (year) B o d y w e ig h t (kg ) Female
Baduy (present study) Purwakarta (Miharja 2008) U.S. (Kuczmarski et al. 2002)
0 5 10 15 20 25 30 35
0 20 40 60 80 Age (year) B o d y w e ig h t (kg ) Male
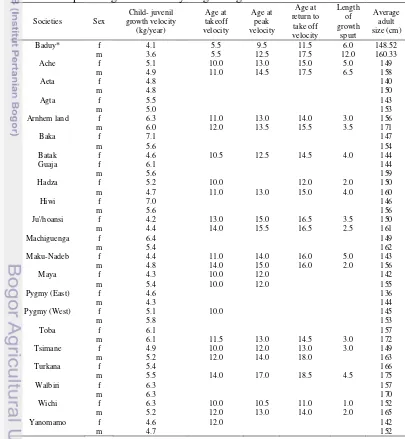
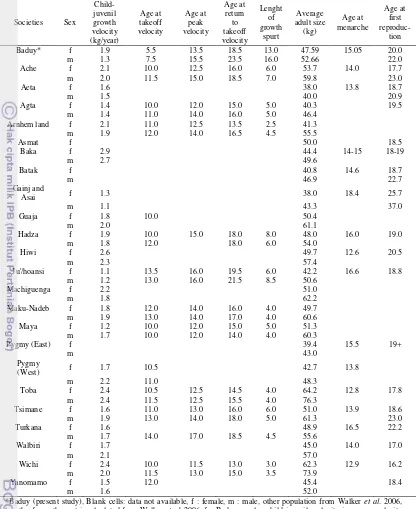
[image:29.595.108.500.91.768.2]*Baduy (present study), Blank cells: data not available, f : female, m : male, other population from Walker et al. 2006; for Baduy people : child-juvenile velocity is average velocity at age 5 to 10 years
[image:30.595.103.508.317.756.2]Baduy people have condition that is similar with other indigenous population from some countries (Table 5). Walker et al. (2006) argued that child to juvenile velocity is a good parameter in growth trajectory. It is measured as the average of growth rates from 3 to 10 years. For our Baduy data, we have 5 to 10 years. For height growth, child-juvenile velocity of Baduy people is slow for their final stature. In fact, they are the slowest of 23 populations. For weight growth, child-juvenile velocity of Baduy girls is at the rate expected for their adult weight, but again, Baduy boys are one of the lowest. Therefore, to attain their adult size, Baduy people prolong their growth. Their length of growth spurt is the longest in record (Table 5 and 6).
Table 5 Comparison growth of body height diagnostic Societies Sex
Child- juvenil growth velocity (kg/year) Age at takeoff velocity Age at peak velocity Age at return to take off velocity Length of growth spurt Average adult size (cm)
Baduy* f 4.1 5.5 9.5 11.5 6.0 148.52
m 3.6 5.5 12.5 17.5 12.0 160.33
Ache f 5.1 10.0 13.0 15.0 5.0 149
m 4.9 11.0 14.5 17.5 6.5 158
Aeta f 4.8 140
m 4.8 150
Agta f 5.5 143
m 5.0 153
Arnhem land f 6.3 11.0 13.0 14.0 3.0 156
m 6.0 12.0 13.5 15.5 3.5 171
Baka f 7.1 147
m 5.6 154
Batak f 4.6 10.5 12.5 14.5 4.0 144
Guaja f 6.1 144
m 5.6 159
Hadza f 5.2 10.0 12.0 2.0 150
m 4.7 11.0 13.0 15.0 4.0 160
Hiwi f 7.0 146
m 5.6 156
Ju'/hoansi f 4.2 13.0 15.0 16.5 3.5 150
m 4.4 14.0 15.5 16.5 2.5 161
Machiguenga f 6.4 149
m 5.4 162
Maku-Nadeb f 4.4 11.0 14.0 16.0 5.0 143
m 4.8 14.0 15.0 16.0 2.0 156
Maya f 4.3 10.0 12.0 142
m 5.4 10.0 12.0 155
Pygmy (East) f 4.6 136
m 4.3 144
Pygmy (West) f 5.1 10.0 145
m 5.8 153
Toba f 6.1 157
m 6.1 11.5 13.0 14.5 3.0 172
Tsimane f 4.9 10.0 12.0 13.0 3.0 149
m 5.2 12.0 14.0 18.0 163
Turkana f 5.4 166
m 5.5 14.0 17.0 18.5 4.5 175
Walbiri f 6.3 157
m 6.3 170
Wichi f 6.3 10.0 10.5 11.0 1.0 152
m 5.2 12.0 13.0 14.0 2.0 165
Yanomamo f 4.6 12.0 142
Table 6 Comparison growth of body weight diagnostic and life history Societies Sex
Child- juvenil growth velocity (kg/year) Age at takeoff velocity Age at peak velocity Age at return to takeoff velocity Lenght of growth spurt Average adult size (kg) Age at menarche Age at first reproduc-tion Baduy* f 1.9 5.5 13.5 18.5 13.0 47.59 15.05 20.0
m 1.3 7.5 15.5 23.5 16.0 52.66 22.0
Ache f 2.1 10.0 12.5 16.0 6.0 53.7 14.0 17.7
m 2.0 11.5 15.0 18.5 7.0 59.8 23.0
Aeta f 1.6 38.0 13.8 18.7
m 1.5 40.0 20.9
Agta f 1.4 10.0 12.0 15.0 5.0 40.3 19.5
m 1.4 11.0 14.0 16.0 5.0 46.4 Arnhem land f 2.1 11.0 12.5 13.5 2.5 41.3 m 1.9 12.0 14.0 16.5 4.5 55.5
Asmat f 50.0 18.5
Baka f 2.9 44.4 14-15 18-19
m 2.7 49.6
Batak f 40.8 14.6 18.7
m 46.9 22.7
Gainj and
Asai f 1.3 38.0 18.4 25.7
m 1.1 43.3 37.0
Guaja f 1.8 10.0 50.4
m 2.0 61.1
Hadza f 1.9 10.0 15.0 18.0 8.0 48.0 16.0 19.0
m 1.8 12.0 18.0 6.0 54.0
Hiwi f 2.6 49.7 12.6 20.5
m 2.3 57.4
Ju'/hoansi f 1.1 13.5 16.0 19.5 6.0 42.2 16.6 18.8 m 1.2 13.0 16.0 21.5 8.5 50.6
Machiguenga f 2.2 51.0
m 1.8 62.2
Maku-Nadeb f 1.8 12.0 14.0 16.0 4.0 49.7 m 1.9 13.0 14.0 17.0 4.0 60.6 Maya f 1.2 10.0 12.0 15.0 5.0 51.3 m 1.7 10.0 12.0 14.0 4.0 60.3
Pygmy (East) f 39.4 15.5 19+
m 43.0
Pygmy
(West) f 1.7 10.5 42.7 13.8
m 2.2 11.0 48.3
Toba f 2.4 10.5 12.5 14.5 4.0 64.2 12.8 17.8 m 2.4 11.5 12.5 15.5 4.0 76.3
Tsimane f 1.6 11.0 13.0 16.0 6.0 51.0 13.9 18.6
m 1.9 13.0 14.0 18.0 5.0 61.3 23.0
Turkana f 1.6 48.9 16.5 22.2
m 1.7 14.0 17.0 18.5 4.5 55.6
Walbiri f 1.7 45.0 14.0 17.0
m 2.1 57.0
Wichi f 2.4 10.0 11.5 13.0 3.0 62.3 12.9 16.2 m 2.0 11.5 13.0 15.0 3.5 73.9
Yanomamo f 1.5 12.0 45.4 18.4
m 1.6 52.0
DISCUSSION
In human, the landmark of growth trajectory is the phase of puberty which is indicated by growth spurt. At puberty, GH/IGF-I hormonal system is reactivated and this increases the overall growth rate of most tissue, including bones (Harrison et al. 1970; Bogin 1999; Geary et al. 2003; Bernstein 2010). Before this acceleration occurs at around 10 years of age, body size increases linearly in the child to juvenile period (Gurven & Walker 2006; Walker et al. 2006). Extensive variation of growth patterns from childhood to adulthood is a reflection of biocultural nature of populations.
Body size of Baduy people may be categorized as pygmy according to Perry
and Dominy’s definition because their average adult height is less than 160cm
(Perry and Dominy 2009). Throughout their growth trajectory they are smaller
than Purwakarta population of the same ethnicity. Compared to our species’
realized potential body size reflected in U.S. population, they are less than the 5th percentile. Growth in body size usually stops at about 16 years of age in girls and about 20 years in boys (Bogin 1999; Malina et al. 2004). However, Baduy people have a prolonged growth until around 30 years of age to reach their size which in fact small. This prolonged phase offset the slow growth rate at child to juvenile transition.
There are several explanations to slow growth rate at child to juvenile transition (Cutting et al. 1987; Walker et al. 2006; Migliano et al. 2007; Perry & Dominy 2009; Bernstein 2010). Prolonged sub-adult period, which leads to small body size in the growing period, may be a saving on body-maintenance costs (Walker et al. 2006b). It confers an advantage in poor environmental condition. On the other hand, slow growth in adolescent and short stature is related to GHR (Growth Hormone Receptor), GHBP (Growth Hormone Binding Protein), and IGF-I level because Pygmies have been shown to have low GH and IGF-I level (Perry & Dominy 2009; Bernstein 2010). Baduy have similar condition with some indigenous population, including pygmy population. However, the level of GH and IGF-I in Baduy people have never been measured.
the prolonged somatic growth into 30 years of age proceeds well beyond reproductive maturation. Age at menarche of Baduy people is similar to other pygmy populations. However, age at first reproduction is slower than Pygmy populations which have early first reproduction to maximize reproductive fitness in a high-mortality environment (Walker et al. 2006; Migliano et al. 2007).
CONCLUSION
REFERENCES
Bernstein RM. 2010. The big and small of it: How body size evolves. Y Phys Anthropol 53:46-62.
Bogin B. 1999. Pattern of Human Growth. 2nd Ed. Cambridge: Cambridge University Press.
Cutting WAM, Elton RA, Campbell JL,Minton EJ, Spreng JM. 1987. Stunting in African children. Arc Disease Child 62:508-509.
de Onis M, Blössner M. 2003. The world health organization global datbase on child growth and malnutrition: methodology and applications. Int J Epidemiol 32:518-526.
Erwinatu. 2012. Saba Baduy Sebuah Perjalanan Wisata Budaya Inspiratif. Jakarta: PT Gramedia Pustaka Utama.
Freedman et al. 2004. Inter-relationships among childhood BMI, childhood height, and adult obesity : the Bogalusa Hearth Study. Int J Obes 28:10-16. Geary MPP, Pringle PJ, Rodeck CH, Kingdom CP, Hindmarsh PC. 2003. Sexual
dimorphism in the growth hormone and insulin-like growth factor axis at birth. J Clin Endocrinol & Metabol 88(8):3708-3714.
Gurven M, Walker R. 2006. Energetic demand of multiple dependents and the evolution of slow human growth. Proc R Soc Biol 273:835-841.
Hakim N. 2006. Cultural and spiritual values of forests In Baduy Region, Banten, Indonesia [Thesis]. Wageningen: Wageningen University.
Harris et al. 2001. Nutritional and health status of tibetan children living at high altitudes. N Engl J Med 5:341-347.
Harrison GA, Weiner JS, Tanner, Barnicot NA. 1970. Human Biology:An Introduction to Human Evolution, Variation and Growth. London: Oxford University Press.
Hermawan C. 2007. Pola Pertumbuhan anak usia 4 sampai 13 tahun di wilayah Karawang [Skripsi]. Bogor: Institut Pertanian Bogor.
Hestiwati D. 1983. Pola produksi dan konsumsi pangan keluarga masyarakat Baduy Dalam dan Baduy Luar di Desa Kanekes, Kecamatan Leuwidamar, Kabupaten Lebak, Jawa Barat [Skripsi]. Bogor: Institut Pertanian Bogor. [IFAD] International Fund for Agricultural Development. 2011. Indigenous
Peoples: Valuing, Respecting and Supporting Diversity. Italy: IFAD.
Indra. 2010. Pola pertumbuhan pria usia 4 sampai 21 tahun di Suku Baduy, Desa Kanekes, Kecamatan Leuwidamar, Kabupeten Lebak, Banten [Skripsi]. Bogor: Institut Pertanian Bogor.
[INKOSBUDPAR] Informasi Komunikasi Sosial Budaya dan Pariwisata. 2004. Membuka Tabir Kehidupan Tradisi Budaya Masyarakat Baduy dan Cisungsang Serta Peninggalan Sejarah Situs Lebak Sibedug. Lebak: INKOSBUDPAR.
Kaur M. 2009. Age changes in somatotype components of rural and urban Punjabi Brahmin females. J Hum Ecol 25:167-173.
Kementrian Sosial Republik Indonesia. 2012. Keputusan Presiden Nomor 111 tahun 1999 [terhubung berkala]. http://www.depsos.go.id/modules.php? name=Kat [January 12th 2012].
Kuczmarski RJ, Ogden CL, Grummer-Strawn LM, Flegal KM, Guo SS, Wei R, Mei Z, Curtin LR, Roche AF, Johnson CL. 2002. 2000 CDC growth charts for the United States: Methods and development. National Center for Health Statistics. Vital Health Stat 11(246). Hyattsville, Maryland: Centers for Disease Control and Prevention/National Center for Health Statistics.
Kurnia A, Sihabudin A. 2010. Saatnya Baduy Bicara. Jakarta: Bumi Aksara. Lubis D. 2009. Memberdayakan Suku Baduy. Bogor: Penerbit Buku Ilmiah
Populer.
Malina RM, Bouchard C, Bar-Or O. 2004. Growth, Maturation and Physical Activity. America: Hum Kint.
Migliano et al. 2007. Life history trade-offs explain the evolution of human Pygmies. PNAS 104(51):20216-20219.
Miharja EA. 2008. Besar tubuh anak usia 4 sampai 14 tahun di wilayah Purwakarta [Skripsi]. Bogor: Institut Pertanian Bogor.
Perry GH, Dominy NJ. 2009. Evolution of the human pygmy phenotype. Trends in Ecol and Evol 24(4):218-225.
Puspita T.2004. Pola pertumbuhan tinggi badan, berat badan dan indeks massa tubuh anak bogor usia 5 sampai 15 tahun [Skripsi]. Bogor: Institut Pertanian Bogor.
Rahmawati NT, Hastuti J, Aschizawa K. 2004. Growth and somatotype of urban and rural Javanese children in Yogyakarta and Bantul, Indonesia. Anthropol Sci 112:99-108.
R Development Core Team. 2010. R: A language and environment for statistical computing. R Foundation for Statistical Computing, Vienna, ISBN 3-900051-07-0. http://www.R-project.org/ [July 10th 2011].
Rogol AD, Clark PA, Roemmich JN. 2000. Growth and pubertal development in children and adolescents : effects of diet and physical activity. Am J Clin Nutr :512S-518S.
Rohmatullayaly EN. 2010. Jangka reproduksi wanita Suku Baduy, Kabupaten Lebak, Provinsi Banten [Skripsi]. Bogor: Institut Pertanian Bogor.
Skalkidou A, Petridou E, Papathoma E, Salvanos H, Trichopou-los D. 2003. Growth velocity during the first postnatal week of life is linked to a spurt of IGF-I effect. Paediatr Perinat Epidemiol 17:281-286.
Stasinopoulos DM, Ridby RA. 2007. Generalized additive models for location scale and shape (GAMLSS) in R. J Stat Software :1-64.
Sunduquist J, Johansson SE. 1998. The influence of sosioeconomic status, ethnicity and lifestyle on body mass index in a longitudinal study. Int J Epidemiol 27:57-63.
Venables WN, Ripley BD. 1999. Modern Applied Statistic with S-Plus. New York: Springer Inc.
Walker R, Hill K, Burger O, Hurtado AM. 2006b. Life in the slow lane revisited : ontogenetic separation between Chimpanzees and Humans. Am J Phys Anthropol 129:577-583.
[WHO] World Health Organization. 1995. Physical status: The use and interpretation of anthropometry. Report of a WHO Expert Committe, WHO Technical Report Series 854.Geneva: WHO.
Widiyani T, Suryobroto B, Budiarti S, Hartana A. 2011. The growth of body size and somatotype of Javanese Children at age 4 to 20 years. Hayati J Bio Sci 4:182-192.