GIS APPROACH TO DETERMINE THE EARTHQUAKE
HAZARD AREAS IN FEASIBILITY SITE FOR NUCLEAR
POWER PLANT IN BANGKA ISLAND
AJAT SUDRAJAT
GRADUATE SCHOOL
BOGOR AGRICULTURAL UNIVERSITY BOGOR
STATEMENT
I, Ajat Sudrajat hereby stated that this thesis entitled:
GIS APPROACH TO DETERMINE THE EARTHQUAKE HAZARD AREAS IN FEASIBILITY SITE FOR NUCLEAR POWER PLANT IN
BANGKA ISLAND
is a result of my own work under the supervision of advisory board during the period January until July 2013 and that it has not been published ever. The content of this thesis has been examined by the advisory board and external examiner.
Thesis submitted to the Bogor Agricultural University in partial fulfillment of the requirement for the degree of Master of Science in Information Technology for Natural Resources Management.
Bogor, January 2014
ABSTRACT
Ajat Sudrajat. GIS Approach To Determine The Earthquake Hazard Areas in Feasibility Site for Nuclear Power Plant in Bangka Island. Under Supervision of Suria Darma Tarigan and Antonius Bambang Wijanarto.
Bangka Island is an area that had been assessed to be a feasibility site for nuclear power plant in Indonesia. Although the area is located far from the ring of
fire’s the impact of an earthquake is still felt, however needed to be examined.
There were not many earthquake epicenters that occurred in this island. The purpose of this study is to determine earthquake hazard areas using Geographical Information System model. The methodology used to determine earthquake hazard areas is based on Simple Additive Weighting (SAW) analysis model which requires different input variables that were implied. The model inputs include slope, earthquake intensity, predominant period, amplification factors, lithology and fault distance. The weight and rank values are assigned to the layers and to the classes of each layer respectively. Based on the final earthquake hazard areas map, hazardous areas in Bangka Island are located in north and south parts of the study area. The areas belong to the feasibility site for nuclear power plant is categorized moderate earthquake damage areas. The results cannot be expected to be completely accurate but can provide a good representation of the process. Validation of results will inevitably be difficult and should be measured in the field. The information resulting from this study could be useful for raising awareness about hazard and possible mitigation measure, a key component of disaster risk reduction planning.
SUMMARY
Ajat Sudrajat. GIS Approach To Determine The Earthquake Hazard Areas in Feasibility Site for Nuclear Power Plant in Bangka Island. Under Supervision of Suria Darma Tarigan and Antonius Bambang Wijanarto.
The Indonesian government is planning to build four nuclear power plants (PLTNs) until 2025 to meet domestic demand for electricity based on Presidential DecreeNo. 5/2006on national energy policy. In accordance with Act No. 10 Year 1997 on Nuclear Energy and the latest Presidential Decree No. 64 Year 2005, BATAN has been stipulated as a Non Departmental Government Institution which is under and responsible to the President. Indonesia is located in triple junction of tree mega plates, the site of a large number of earthquakes and volcanic eruptions, has heighted risks and popular concerns about nuclear power. The most important seismic activity which could affect the area is Sumatra Fault. Therefore, earthquake hazard analysis is very important for evaluating the safety of existing critical structures and for estimating the possible risk to critical structures in planning stages of Nuclear Power Plant.
The main objective of this research is to identify the earthquake hazardous areas in feasibility site for Nuclear Power Plant in Bangka Island. This research was conducted from January to June 2013 including the data preparation, data processing, and developing Method. The processing of this data was being conducted in the Tsunami and Earthquake Centre BMKG, Jakarta. The study area is located at the Bangka Island between the latitudes of -1.30° and -3.30° and longitudes of 105° and 107°. The study area includes four regencies totally and partially.
Weighted overlay analysis is the methodology of choice in this study. Weighted overlay is a well known for combining multiple criteria for identifying a earthquake hazard areas. The simple additive weighting (SAW) method was chosen based on incorporation of GIS and Multi Criteria Decision Analysis. While weighted overlay procedure helps including criteria together with certain ranking or rating factors can be utilized for determine earthquake hazard areas for the construction of Nuclear Power Plant. The methodology used in the study consists of: (a) Data collection, (b) Data preparation and (c) Simple Additive Weighting Method. In this study, important factors closely related to earthquake hazards such as seismicity, geology, slope, earthquake intensity, soil distribution and amplification factors data were compiled for spatial database using GIS, and ranked by relative susceptibility of earthquake hazards.
earthquake hazard is dominantly found on Bangka Island with 809.735 Ha or 69.35 % totally of study area. Earthquake prone area distributed at the east part of Bangka islands. Exactly earthquake prone area is located in several districts such as Bangka Barat, Bangka Selatan and Bangka with totally 221.692 Ha. The areas belong to the feasibility site for nuclear power plants were created using Simple Additive Weighting method located in moderate earthquake affect damage areas.
Copyright @2014, Bogor Agricultural University Copyright are protected by law,
1. It is prohibited to cite all of part of this thesis without referring to and mentioning the source:
a. Citation only permitted for the sake of education, research, scientific writing, report writing, critical writing or reviewing scientific problem b. Citation does not inflict the name and honor of Bogor Agricultural
University
GIS APPROACH TO DETERMINE THE EARTHQUAKE
HAZARD AREAS IN FEASIBILITY SITE FOR NUCLEAR
POWER PLANT IN BANGKA ISLAND
AJAT SUDRAJAT
A Thesis submitted for the degree Master of Science in Information Technology for Natural Resources Management
MASTER OF SCIENCE IN INFORMATION TECHNOLOGY FOR NATURAL RESOURCES MANAGEMENT
GRADUATE SCHOOL
BOGOR AGRICULTURAL UNIVERSITY BOGOR
Research Title
Student Name Student ID Study Program
:
: : :
GIS Approach To Determine The Earthquake Hazard Areas in Feasibility Site for Nuclear Power Plant in Bangka Island
Ajat Sudrajat G051110021
Master of Science in Information Technology for Natural Resource Management
Approved by, Advisory Board
Dr. Ir. Suria Darma Tarigan, M.Sc. Supervisor
Dr. Antonius Bambang Wijanarto Co-Supervisor
Endorsed by,
Program Coordinator
Dr. Ir. Hartrisari Hardjomidjojo, DEA
Dean of Graduate School
Dr. Ir. Dahrul Syah, M.Sc.Agr
ACKNOWLEDGEMENTS
I would like to express my highest gratefulness to Allah SWT for His blessing, His will, His power, His help and His guidance to me during my study.
I would like to express my thanks and sincere appreciation to Indonesia Agency for Meteorological, Climatological and Geophysical (BMKG) for giving me the opportunity to continue my studies.
I would like to sincerely thank my supervisor Dr. Ir. Suria Darma Tarigan, M.Sc. and my co-supervisor Dr. Antonius Bambang Wijanarto for their patience, guidance, advices, valuable inputs, time, support, encouragement and constructive criticisms during the supervision of my research. Moreover, I would like to express my gratitude to the external examiner Dr. M. Buce Saleh for giving advice and valuable correction to make my thesis acceptable.
I would like to thank to Pak Hadi (BATAN) for supporting in obtained field data during my research.
I also wish to thank and give highest appreciation to MIT students batch 2011 for their friendliness, togetherness and best years in study time, and also to all MIT students generally. I thank also MIT secretariat and staffs for their cooperation and friendliness during study. Moreover, to all MIT lectures, I really appreciate for their sharing of valuable knowledge and experiences.
Finally, very special thanks to my wife Rian Anggraeni, for her continued support and encouragement. I would like to thank her for showing me the beauty and opposite side of life and making my mind relax during the hard times of my thesis. I owe so much thanks to my parents, my children, and all family members who were continuously supporting me throughout my life and leaving me free in all my decisions. And the others that cannot be written in here thank you very much.
.
Bogor, January 2014
CURRICULUM VITAE
TABLE OF CONTENTS
Page
LIST OF TABLES ... xi
LIST OF FIGURES ... xii
1. INTRODUCTION ... 1
Background ... 1
Objective ... 4
Problem Statement ... 4
Scope of Study ... 4
Benefits ... 4
2. METHODOLOGY ... 5
Time and Location ... 5
Materials ... 5
Methods ... 6
Data Collection ... 6
Data Preparation ... 7
Simple Additive Weighting (SAW) ... 13
3. RESULTS ... 15
Data Evaluation ... 15
Analysis ... 23
4. CONCLUSION ... 30
5. RECOMMENDATIONS ... 30
LIST OF TABLES
Page
1 Earthquake Intensity Classification (FEMA,2001) ... 9
2 Site Class Definition Based on Predominant Period (Molas,et.al, 2005) 11
3 Ranking of Ground Shaking Hazard Based on Amplification Factors (Kamal, et,al,2006) ... 12
4 Slope Classification (Andrian, 2009) ... 12
5 Classification Fault Based on Distance ( Mohsen,et.al., 2012) ... 13
6 Classification of Lithology (Bealand, 1996) ... 13
7 Classes produced for slope according to the earthquake hazard Areas ... 15
8 Fault distance area ... 16
9 Lithology of research area ... 18
10 Classification of earthquake intensity area ... 19
11 Predominant period area ... 21
12 Amplification factor area ... 22
13 Classification of Weight Values (Malczewski, 1999)... 24
14 Classification of Rank Values ... 24
15 Assigned Weight and Rank Values For the Classes of the Study Area ... 25
16 Standardized Rank Values and Normalized Weight Values ... 26
17 Total Scores Classes ... 27
LIST OF FIGURES
Page
1 Location Interest Areas of Nuclear Power Plant in Bangka ... 1
2 Earthquake Distribution in Bangka Island and Surrounding From 1963 – 2012 (BMKG) ... 2
3 Location of Study Areas ... 5
4 General Framework of This Study ... 7
5 Location of Microtremor Measurement ... 11
6 Classes determined for slope according to earthquake hazard areas ... 16
7 Fault distance map ... 17
8 Lithology map ... 18
9 Earthquake intensity map ... 20
10 Predominant period map ... 21
11 Amplification factor map ... 22
12 Earthquake hazard areas map ... 28
13 Google Earth image feasibility site for Nuclear Power Plant in West Bangka ... 29
1
1. INTRODUCTION
Background
The Indonesian government is planning to build four nuclear power plants (PLTNs) until 2025 to meet domestic demand for electricity based on Presidential Decree No. 5/2006 on national energy policy. With increasing number of population and efforts to provide sufficient power supply to run its growing industry sector, Indonesia needs to have efficient power plant to cope with growing energy needs at home. Nuclear power plant is the most possible option to fulfill those needs due to its reliable and low-cost operation character. In accordance with Act No. 10 Year 1997 on Nuclear Energy and the latest Presidential Decree No. 64 Year 2005, BATAN has been stipulated as a Non Departmental Government Institution which is under and responsible to the President. The main duties of BATAN are to conduct research, development and the beneficial applications of nuclear energy in accordance with the laws and regulations.
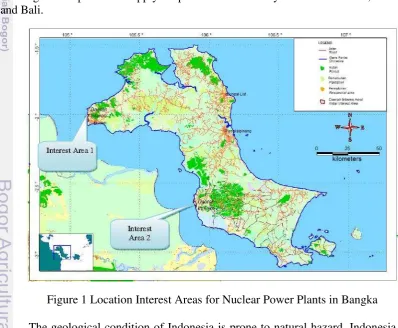
According to the result of the study, BATAN has selected two sites for two nuclear power plants; it would recommend sites in Muntok, West Bangka, and Permis, South Bangka (Figure 1). Bangka was chosen for its relative proximity to Indonesia's most populous islands of Java and Sumatra. The nuclear power plant in Bangka is expected to supply 40 percent of electricity needs in Sumatra, Java and Bali.
Figure 1 Location Interest Areas for Nuclear Power Plants in Bangka
2
westward with the average velocity of 6 cm a year, and the Indo-Australian plate that moves northward 4 cm a year, collides with Eurasia plate in Indonesian region. Areas located in the edge of Earth’s tectonic plate tend to have high earthquake susceptibility. Because of the frequency and magnitude of earthquakes in Indonesia, particular attention is paid to seismic issues in the sitting, design and construction of nuclear power plants.
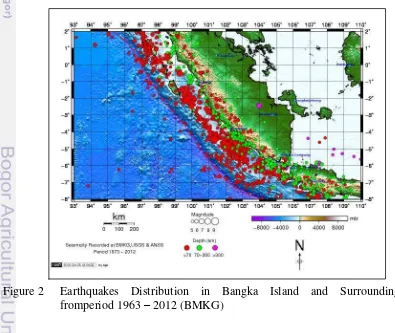
The Bangka is not an island generally associated in the public mind with the earthquakes. However, the Bangka Island is nowhere near in the same as high seismicity areas such as Sumatera and Java Island, it nevertheless has a moderate rate of seismicity, sufficiently high to pose a potential hazard to sensitive installations such as dams and nuclear power plants. The main earthquake events are along Sumatera Island at the western part as Semangko fault manifestation and their presence has significant affects to Bangka Island (Figure 2). Based on historical main earthquakes were occurred the June 1914 which destruction reached the very end of the Malayan Peninsula, Singapore, Bangka and Belitung and historical devastating a big earthquake were also occurred in September 12, 2007 with magnitude of 8.4 within more than 200 km radius of Bangka Island in Bengkulu. And the last event BMKG recorded the magnitude 4.9 earthquake occurred in north part Bangka Island at 18:41:22 UTC on 1 December 2007 18 kilometers northeast of the Jebus City based on earthquake historical data that Bangka Belitung had a moderate risk for earthquakes. This is the same level of risk that it assessed for the region of Fukushima caused by the Great Tohoku earthquake on March 11, 2011. As a result, the last years have seen a large effort by Indonesia nuclear agency (BATAN) and BMKG to improve instrumental monitoring of earthquakes and to research and revise the historical seismicity.
3
Experience of the March 11 2011, Great Tohoku earthquake clearly demonstrated that the earthquakes might be the dominating contributors to the overall risk of nuclear power plants. The information of earthquake vulnerability areas may indicate historical data concerning phenomena that have potential produces adverse effects on safety areas. Engineering solution is needed to mitigate some potential effects of external events through design, particularly for a nuclear power plant that is located in an earthquake prone area. When solutions either are practicable or can demonstrate as being adequate for mitigation of the effect of earthquake phenomena, it may be a good selection for an alternative nuclear power plant site. Future earthquake loss potential is even greater with population growth and economic development in this earthquake prone country. Therefore, earthquake hazard analysis is very important for evaluating the safety of existing critical structures and for estimating the possible risk to critical structures in planning stages of Nuclear Power Plant.
With geographic information systems (GIS) based multi criteria decision analysis, analysis of area/location of hazards can be performed using multiple seismic data and data geological more quickly and accurately. Multi criteria decision analysis in this study using a model Simple Additive Weighting (SAW). The next process is the integration of data interpretation results which was done by using geographic information systems.
Determining the earthquake hazard areas is very important to decision makers for planning and management of activities. Decision making is actually a choice or selection of alternative course of action in many fields, both the social and natural sciences. The inevitable problems in these fields necessitated a detailed analysis considering a large number of different criteria. All these criteria need to be evaluated for decision analysis. Geographic Information System (GIS) provides more and better information for decision making situations. It allows the decision makers to identify a list, meeting a predefined set of criteria with the overlay process, and the multi-criteria decision analysis within GIS is used to develop and evaluate alternative plans that may facilitate compromise among interested parties. Moreover, overlay weighted model method was used in analyzing and finding the earthquake hazard areas in Bangka Island. The approach proposed here allows planners and housing developers to examine the susceptible areas for information about the risk areas likely to be earthquake. Therefore, the actual purpose of this study depending on geologic conditions, some combination of ground shaking, surface faulting, and micro tremor data to identify which may be the most serious potential earthquake-related hazard in an area.
Therefore, based on Simple Additive Weighting (SAW), the weight and rank value are assigned to criteria (layer) and alternatives (classes) of each criterion respectively. Then the earthquake susceptibility hazard areas map is prepared using Arc GIS platform and special analyst extension and weighted overlay technique.
4
area based on experience Yogyakarta earthquake, various studies have employed geographic information systems (GIS) to determine earthquake hazard areas problems. Setiawan (2009) applied GIS approach to produce seismicity microzonation map based on Simple Additive Weighting (SAW) and Analytical Hierarchical Process (AHP) models in Yogyakarta and surrounding. Nugroho (2011) used GIS and Multicriteria Decision Analysis to determine the area of hazard, vulnerability, and risk based on the occurrence of the earthquake in Bantul Regency, Yogyakarta Province. Previous research by the method of GIS analysis in Yogyakarta showed that the accurate this method relative closely with damage caused by Yogyakarta earthquake. An interesting fact of map results if we compare with the damage area caused of earthquake year 2006 showing the relevant. There is a significant spatial relationship between the patterns of the total damage to buildings on the Yogyakarta earthquake of 2006 with the zoning earthquake hazard areas value.
Objective
The main objective of this research is to identify the earthquake hazardous areas in feasibility site for Nuclear Power Plant in Bangka Island
.
Problem Statement
Bangka and Belitung Islands are located on the area with relatively low seismicity. There are no significant earthquakes occurred in Bangka-Belitung Islands Province. The main earthquake events are along Sumatera Island at the western part as Semangko Fault manifestation. In Bangka Island, no casualty or damage was reported caused by earthquake. However, it is necessary to take action to prevent any damages occurred by earthquake in future. The problem in this study is to identify potential damage that can be caused by earthquake in Bangka Island, although there is no previous damage data found.
Scope of Study
This research is focusing how to determine earthquake hazard areas with simulation in GIS. GIS spatial analysis is used to simulate for hazard map model which represent geological and geophysical information combination. The Earthquake hazard areas maps applying by simple overlay weighted model.
Benefits
5
2. METHODOLOGY
Time and Location
This research was conducted from January to June 2013 including the data preparation, data processing, and developing Method. The processing of this data was being conducted in the Tsunami and Earthquake Centre Agency for Meteorological, Climatological and Geophysical, Jakarta.
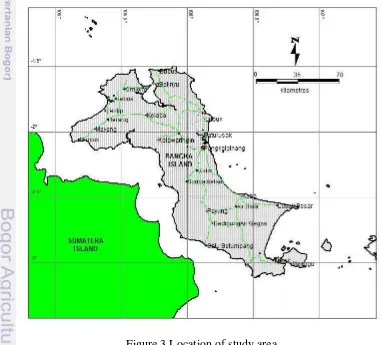
The study area is located at the Bangka Island between the latitudes of -1.30° and -3.30° and longitudes of 105° and 107°, bordered by the following areas: Bangka strait in the west, Karimata strait in the east, Natuna Sea in the north and java Sea in the south. The study area includes 5 regency totally and partially. The total area is 11.676,05 km2 or 1.167.605 Ha. Figure 3 illustrates the location of the study area.
Materials
The data in the research came from several sources. Some information were collected by conducting interview, questionnaire and discussion with expert from Indonesia agency for Meteorological, Climatological and Geophysical (BMKG) and National Nuclear Energy Agency of Indonesia (BATAN).
6
The basic materials which are used and considered in this research are listed as follow:
Earthquake Catalog from 1973 to 2012, source Indonesia Agency for Meteorological, Climatological and Geophysical
Microtremor Data From year 2011, source National Nuclear Energy Agency of Indonesia
Digital Elevation Model SRTM resolution of 90m produced by NASA source downloaded from http://www.cgiar-csi.org
Geological map from the year 1994 and 1995 At scale 1:250.000, source Geological Research and Development Centre, Bandung.
Administration boundary map scale 1:250.000 sources BAPPEDA Bangka-Belitung and Geospatial Information Agency (BIG).
Methods
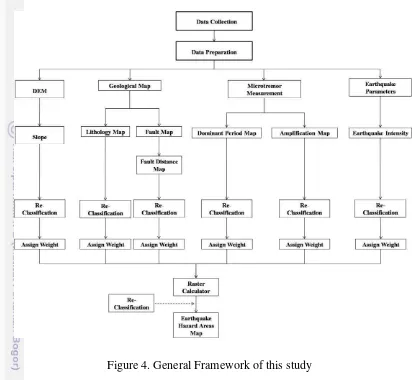
Hazard is a dangerous phenomenon, substance, human activity or condition that may cause loss life, injury or other health impacts, property damage, loss of livelihoods and services, social and economic disruption, or environmental damage (Guzey, et.al, 2013) Determining earthquake hazard areas is a procedure for estimating the total earthquake damage effect from ground shaking and related phenomena by taking into account the effects of local site condition. The subsurface and topographic condition can amplify or reduce the ground shaking acceleration at a site with respect to what would be expected for feasibility site of nuclear power plant ground at that location. In this research, the determining hazard areas associated with the damage in case of earthquake method was presented for related to Nuclear Power Plant site selection. In this study, important factors closely related to earthquake hazards such as seismicity, geology, slope, earthquake intensity, soil distribution and amplification factors data were compiled for spatial database using GIS, and ranked by relative susceptibility of earthquake hazards.
7
Figure 4. General Framework of this study
Data Preparation
8
1. Calculate Earthquake Intensity
Earthquake intensity is a measure of the degree of damage caused by an earthquake at a given place (UNDP, 1994). It describes the effect of an earthquake on the surface of the earth and integrates numerous parameters such as ground acceleration, earthquake duration and subsoil condition (Munich Re, 2000). It depends upon the strength of the earthquake, the distance of the location from the hypocenter and local subsoil condition. For historical event, for which there are no instrumental records, but only information concerning the damage they caused, the intensity are either estimated directly from data, or taken from catalogues. There are many empirical formula concerning the relationship of intensity, magnitude and hypocentral distance have been proposed by many investigator. Earthquake intensity in the study area was determined using an official Earthquake and Tsunami center BMKG Modified Mercalli Intensity (MMI) scale map. The MMI scale is divided into 12 continuous categories (Wood and Neumann 1931). The lower degrees of the MMI scale generally deal with the manner in which the earthquake was felt by people. The higher degrees are based on observed structural damage.
For estimation of earthquake intensity in this study was used empirical formula from the attenuation formula of Modified Mercalli intensity proposed by Dowrick et.al (1998). Dowrick et.al developed Modified Mercalli (MM) intensity attenuation relationships from observed intensities in New Zealand earthquakes. The MM intensity (MMI) scale measures the earthquake effects at a site in terms of the effect it has on the natural and built environment. The model calculates the intensity using the Dowrick attenuation function and they are predict the intensity on the Modified Mercalli Intensity (MMI) scale as a function of the distance from the earthquake.
The estimated earthquake intensity calculated for each point from the earthquake parameter and described as follows below:
a) The first step is to set the range area interest to be estimated of the initial calculation, in this study used the rectangular area of 2 x 2 degree per range area.
b) Set calculation grid, we set the calculation grid at 0.25 degree.
c) Area sources are geographical areas within which an earthquake of a given magnitude is equally likely to occur at any time or location,
d) Calculate the distance between two locations from epicenter to certain location each of grid point using the Spherical formula:
∆ = acos(sin(lat1).sin(lat2)+cos(lat1).cos(lat2).cos(long2−long1)).R (1)
Where: lat1 = Latitude of epicenter lat2 = Latitude of location x long1 = Longitude of epicenter long2 = Longitude of location x
R = Earth’s radius (mean radius = 6,371km)
∆ = Distance between epicenter and location x in km
9
(2)
Where R is hypocentral distance, h is epicentral depth and ∆ Distance
between epicenter and location x in km.
f) Calculate estimation of maximum intensity in location x using Dowrick Empirical formula:
I = 1.41 M - 1.18 ln R - 0.0044 R + 2.18 (3) Where R is hypocentral distance, and M is magnitude we replace Ms with M.
Seismic intensity are estimated using an empirical attenuation relationship, which is for describing the attenuation of intensity with distance. To derive maximum seismic intensity every location based on seismic intensity attenuation formula used the visual basic program to calculate the hypocentral distance and intensity. All the spatial data were processed using GIS Tools software used to plot contour of seismic intensity at the area interest. The analyses used in this research are descriptive analysis. The descriptive analysis were using super imposed method of maps to describe the characteristic and facts of destructive earthquake based on distance to epicenter, seismic intensity value in the study area. Earthquake intensity classification can be description in Table 1.
Table 1 Earthquake Intensity Classification (FEMA,2001)
MMI Description potential Damage
10
a. Microtremor Measurements
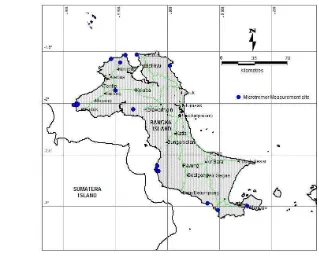
Microtremor measurements were carried out by using very high sensitive seismometers with servo system. The Seismometer short period type DS-4A 3 components dan TDL 303 portable digital seismograph, with sampling rate frequency100 Hz, can be observing ground motion for the period ranging from 0.1 Hz to 50 Hz. More than 19 points microtremor measurements were conducted in Bangka Island. For each point of measurement 20 minutes of ambient noise recorded. We have conduct 2 to 3 records in each site for verifying the stability of microtremors. Figure 5 shows the locations of microtremor measurements represented on administration map of Bangka Island.
b. Microtremor Processing
In processing data we used Geopsy software,. This software contains information of recording time, the amount of data and other supporting data. The result is a spectrum at each point will then be analyzed to obtain HVSR peak value (A) and predominat frequency (fo). The data processing to obtain the HVSR at each site was performed in the following way:
1. Fourier transformation: firstly, Fourier spectra of the selected segments of two horizontal and the vertical components are calculated using the fast Fourier Transform (FFT) algorithm. As the Fourier spectra of the two horizontal components looked alike, their horizontally combined spectra were calculated to obtain the maximum Fourier amplitude spectrum as a complex vector in the horizontal plane, while the one vertical component provided the vertical motion spectra.
2. Smooting of the spectra: Secondly, digital filtering has been employed on the combined horizontal and vertical spectra applying a logarithmic window with a bandwidth coefficient equal to 15 . This filtering technique is applied to reduce the distortion of peak amplitudes.
3. Calculation of transfer functions: the smoothed combined horizontal spectrum are divided with the vertical spectrum using equation 1 given below, which provided the soil response in term of amplified periods of the investigated portion (20.48s) of records.
R (f) =
√
FNS (f) * FEW(f) / FUD(f) (4)4. Where R(f) is the horizontal to vertical spectral ratio and FNS(f), FEW(f) and FUD(f) is the Fourier amplitude spectra in the North South components(NS), East West (EW) and Up Down Directions respectively.
11
Based on the microtremor measurements analysis (HVSR) determine the predominant frequency (fo) and amplification factor (Am).
In addition to assigning a predominant period class to each recording site, we also classify each site to the four classes as rock, hard soil, medium soil, and soft soil as defined by Molas & Yamazaki (2005). See also Table 2, which shows the approximately corresponding site classes defined by the Japan Road Association (1980) and the approximate correspondence with NHERP site classes (2000).
Table 2. Site Class Definition Based on Predominant period (Molas et.al,2005)
Description Natural Period
Rock Hard Soil Medium Soil
Soft soil
T < 0.2 sec
0.2 ≤ T < 0.4 sec
0.4 ≤ T < 0.6 sec T ≥ 0.6 sec
Soil amplification is a main factor influencing the distribution of damage and causalities in urban areas when large earthquake occur. Thus, it is important to define how the seismic waves are affected by recent and non –consolidated geological deposits to better quantify the ground motions at surface. The higher amplification factors of a soil type under a certain frequency of seismic wave, the higher the degree of hazard for the structures of that frequency. Therefore, the ranks of the seismic hazard have been differentiated into four classes based on the amplification factors which are given in Table 3.
12
Table 3 Ranking of ground shaking hazard based on amplification factors (Kamal,et.al,2006)
Slope is defined by a plane tangent to a topographic surface, as modeled by the DEM at a point (Burrough, 1986). Slope presents the percent change in elevation over a certain distance. The output slope can be calculated as either the percent or degree slope. In this study, percent of slope was chosen.
Slope is an important factor while considering the ease of engineering construction and susceptibility land sliding cause by earthquake. Slopes are particularly vulnerable to bedrock failures. Keefer(1984,1993) noted that more than 90 percent of earthquake induced slope failures on rock slopes were rock falls and rock slides. The physical characteristics of the rock masses underlying steep slopes are of fundamental importance in evaluating their susceptibility to slope failure. Therefore, the slope layer will only contribute to determine the earthquake hazard areas in ease of engineering constructions, since steep slopes interfere with excavation processes. The slope map was prepared in degrees using DEM of the study area. Afterwards, the slope values were subdivided into four main classes according AGS Sub-Commite Australian Geomechanics (2002) Slopes between 0 and 9% were assigned as the flat class, slopes between 10% and 15 % were assigned as moderately steep class, slopes between 16% and 20% were assigned as very steep class and slopes greater than 20% were assigned as the extremely steep class. Table 4 shows the degrees and description of slope class.
Table 4 Slope Classification (Andrian, 2009)
Percent of Slope Information Hazard Categories 0 – 9 %
A fault is a break in the rocks that make up the Earth’s crust, along which
13
Table 5 Classification fault based on distance (Mohsen et.al., 2012)
Distance Earthquake hazard areas. Construction of some buildings for nuclear plant in these zones can prevent by identifying risk zones in cities in low risk areas of vital arteries decided. Fault as seismic sources, including plate movement and withdraw are major factors, thus, away from the faults could be considered as one of main parameters of determine earthquake hazard areas. Classification fault for significant level of earthquake hazard based on distance from the fault defined by Mohsen et.al,2012 shown in Table 5.
5. Lithology
Lithology is the description of rock composition and texture. The geological formations type and condition are closely related to the landslide after earthquake occurrence. Lithology data was extracted from geological map. This data had been prepared for common geological functions without take into account the special needs of the earthquake hazard evaluation. The geological units were regrouped based on lithological attributes rather than their stratigraphic content and age.
Geology units strongly influences slope stability and it is clear that there exists an associated between types of lithology material. However, this association may be strong or weak largely depending upon the type of lithology material. Lithology is one main factors influencing the type and the intensity of the earthquake ground shaking. Based on the geological map scale 1: 250,000 published by Geological Research and Development Centre of Indonesia, various rock formations in the study area have been grouped to prepared the lithology data layer. The lithology classification for determine earthquake hazard areas is shown in table 6
Table 6 Classification of Lithology (Bealand, 1996)
Lithology Age Hazard Level
14
are also concurrently considered while assigning rank values. As a result, six weight values were assigned to the six layers.
Simple Additive Weighting which is also known as weighted linear combination or scoring methods is simple and most often used in multi attribute decision technique. The method is based on the weighted average. An evaluation score is calculated for each alternative by multiplying the scaled value given to the alternative of that attribute with the weights of relative importance directly assigned by decision maker followed by summing of the products for all criteria.
Simple Additive Weighting (SAW) is calculated using the following formula:
A
i =Ʃ
W
j *X
ij (5)Where Xij is the score of the ith alternative with respect to the jth attribute and Wj
is the normalized weight. The weights represent the relative importance of the attributes. The most preferred alternatives is selected by identifying the maximum value of Ai, i = 1, ….,m.
The SAW methods can be implemented using GIS having overlay capabilities. The GIS based Simple Additive Weighting method involves the following steps (Malczewski, 1999):
1. Definition of the set of evaluation criteria (map layers) and the set of feasible alternatives,,
2. Standardization of each criterion map layer,
3. Definition of the criterion weights; that is, a weight of “relative importance”
is directly assigned to each criterion map; that is, multiply standardized map layers by corresponding weights,
4. Construction of the weighted standardized map layers,
5. Generation of the overall score for each alternative using the overlay operation on the weighted standardized map layers,
6. Ranking of the alternatives according to the overall performance; the alternative with highest score is the best alternative.
Simple Additive Weighting method is the most often used method in multi attribute decision rules. The method can be operationalized using any GIS system having overlay capabilities. The overlay techniques allow the evaluation criterion map layers (input maps) to be aggregated in order to determine the composite map layer (output map).
15
3. RESULTS
Data Evaluation
To determine earthquake hazard areas relevant literatures were sought. Several factors were considered in arriving at the determine earthquake hazard areas in feasibility site for nuclear power plants. This is of great importance to consider the nature of what is to be sited. In this study, by taking into account the conditions of Bangka Island, six criteria were selected, they are:
1. Slope map
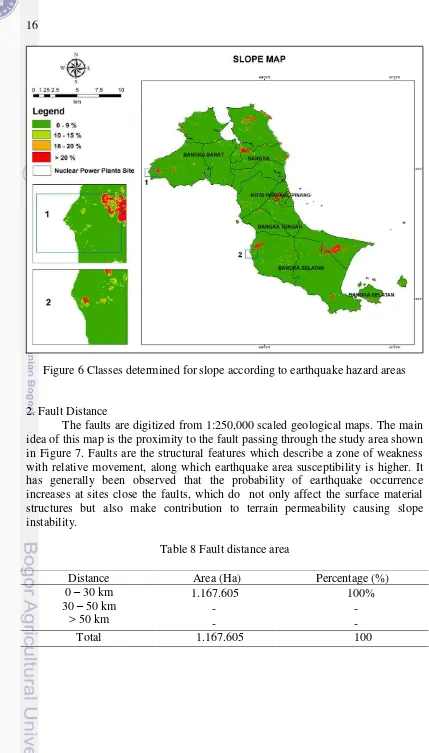
Slope is an important factor while considering the ease of engineering construction and susceptibility to landsliding caused by earthquake. The slope map was produced from SRTM Digital Elevation Model (DEM) of the study area. By considering the suggestions in the literature, slope map is classified into four groups. The groups and related rankings are shown in Table 7. The final map ready for analysis is shown in Figure 6.
According to Table 7, Bangka Island are dominantly located on slopes between 0 and 9% , and were assigned as the flat class by approximately 93.68% from slope area total. By using slope map, area identified as earthquake hazardous areas can be determined. Related to earthquake hazard areas, slope between 16% and greater 20 % are classified as high to very high hazard areas.
Table 7 Classes produced for slope according to the earthquake hazard areas
Slope Area (Ha) Percentage (%)
16
Figure 6 Classes determined for slope according to earthquake hazard areas
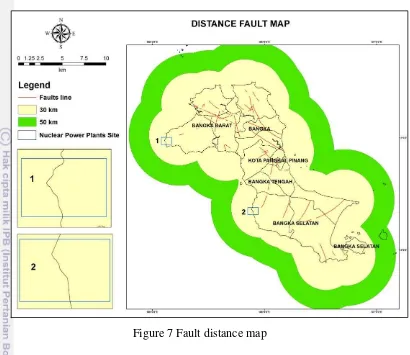
2. Fault Distance
The faults are digitized from 1:250,000 scaled geological maps. The main idea of this map is the proximity to the fault passing through the study area shown in Figure 7. Faults are the structural features which describe a zone of weakness with relative movement, along which earthquake area susceptibility is higher. It has generally been observed that the probability of earthquake occurrence increases at sites close the faults, which do not only affect the surface material structures but also make contribution to terrain permeability causing slope instability.
Table 8 Fault distance area
Distance Area (Ha) Percentage (%)
0 – 30 km 30 – 50 km
> 50 km
1.167.605 - -
100% - -
17
Figure 7 Fault distance map
Locations which are far from the fault line are safer than closer ones relatively, in the scope of nuclear power plant. Buffer zone is considered for each distance level and they are converted into raster data having fault distance classification values. Based on the vector layer of faults from geological map, the distance of all pixels from nearest fault was calculated, and then the earthquake hazard areas as a function of fault distance. Three different buffer areas were identified within study area to determine the degree to which the faults affected the earthquake hazard. The hazard areas percentage in each buffer zone is given in Table 8 which shows that 100 percent of the Bangka Island is closely located within 30 km of the buffer zone.
3. Lithology
18
Table 9 Lithology of research area
Lithology Age Area (Ha) Percentage (%) Quarternary (< 2.5 Myrs)
Tertiary (2.5 ≤ Age ≥ 75 Myrs)
Basement Rock (> 75 Myrs)
359.592 768.424 39.589
30.80 65.81 3.39
Total 1.167.605 100
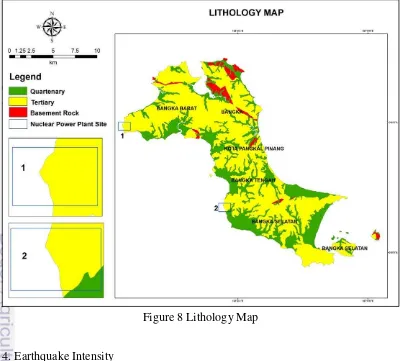
According to Bealand, 1996, Lithology are grouped into 3 (three) classes: Quartenary in age less than 2.5 million ( least hazardous), Tertiary in age from 2.5 million years to 75 million years (Quite hazardous) and Basement rock in age more than 75 million years (Not very hazardous).
Based on Table 9 earthquake hazard areas highly concentrated in the tertiary age (65.81 %) and hazardous areas is less in the basement rock category (3.39 %) and in the quatenary rock age classes (30.80 %). Figure 8 showing that the Bangka Island most dominant lithology tertiary age, where hazard level is quite hazardous scattered throughout the island.
Figure 8 Lithology Map
4. Earthquake Intensity
Earthquakes occur when stresses in the Earth exceed the rock’s strength to
19
earthquake rupture. Energy from the fault rupture is transmitted as seismic waves that cause nearly all damaging earthquake effects.
The earthquake intensity scale is the most familiar index to indicate the strength of ground shaking and/or how an area will be affected by an earthquake. Descriptions of the severity of earthquake ground shaking at any place may be given using intensity scales such as the Modified Mercalli Intensity scale. The Modified Mercalli (MM) scale describes the strength of shaking by categorizing the effects of an earthquake through damage to buildings, landsliding, liquefaction, soil cracking and other types of ground failure, and the reactions of people and animals.
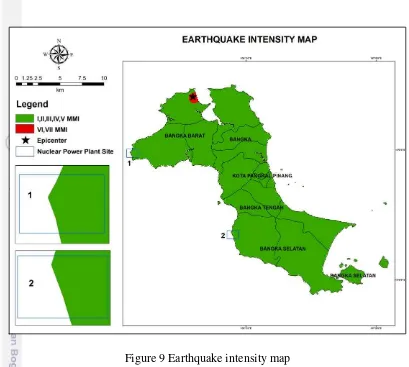
It is very important to estimate the distribution of seismic intensities for regional earthquake damages prediction about future big earthquake. The seismic intensity is strongly influenced by subsurface ground condition and basement irregular boundary condition. The distributions of the estimation maximum earthquake intensity in Bangka Island based on calculate using Dowrick attenuation is shown in Figure 9. Figure 9 shows the maximum intensity earthquake which can occur and indicates that most of Bangka Island is at none to very light damage risk.
It can be seen from the figure that the characteristics of intensity distribution in Bangka Island are that the intensity was high in the north (0.79%) and most of the Island is almost low (99.21%). The general trend of earthquake damage in the Bangka area was that damage was more serious in the plain area and less in the hilly area.
Estimation of earthquake intensity has been used by the formula provided by Dowrick et.al.(1999) by decreasing intensity with epicentral distance. The zone of maximum intensity 6 (MMI) was located at the nort part Bangka Island. Intensity zone was calculated for 1.167.605 Hectare in an area having 1.158.307 Hectare with maximum intensity V, 9.298 Hectare with intensity 6, respectively (Table 10).
The distribution of earthquakes is called seismicity. Seismicity is highest along relatively narrow belts that coincide with plate boundaries. This makes sense, since plate boundaries are zones along which lithospheric plates move relative to one another.
Table 10 Classification of earthquake intensity area
20
Figure 9 Earthquake intensity map
5. Microtremor
Classification or zoning of ground conditions is important in the earthquake damage estimation because ground conditions directly affect seismic amplification of ground shaking. This study adopts ground condition based on the microtremor measurement. These measurement correspond to the predominant period and amplification factors of each soil type. It is very effective to consider ground conditions when conducting precise damage estimation.
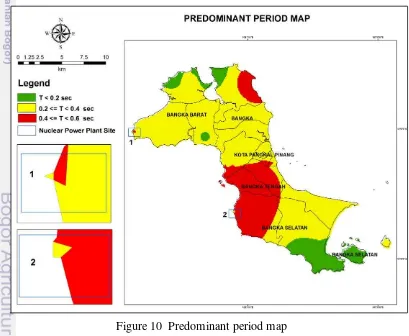
Horizontal vertical spectral ratio (HVSR) spectrum obtained from analysis of microtremor signal recording using geopsy software. This process can be determined values A (Amplification factor) and fo (predominant period) for each measurement point. The dominant period map is classified into 4 (four) classes:
rock (T < 0.2 sec), hard soil (0.2 ≤ T < 0.4 sec), medium soil (0.4 ≤ T < 0.6 sec)
21
Table 11 Predominant period area
Natural Periods Area (Ha) Percentage (%) T < 0.2 sec
0.2 ≤ T < 0.4 sec
0.4 ≤ T < 0.6 sec T ≥ 0.6 sec
139.426 780.082 248.097
-
11.94 66.81 21.25
-
Total 1.167.605 100
Dominant frequency value (fo) is useful parameter in planning and development. In building planning fo values should not be equal to the frequency of the building so that the building can withstand from an earthquake. Fo value from structures must be estimated properly so as not to have the same fo value from the site, as it will resonance during the earthquake. This will lead to an increase in the vibration caused by earthquake. In addition, the very low value of fo will be very susceptible to high-rise buildings of the vibration waves of long period earthquakes. Results of this study shown that fo values are relatively low because it has a value less than 10 Hz. However, to prevent the damaging effects of earthquakes, development in nuclear power plant should consider the value of the existing dominant frequency.
22
Soil amplification is a main factor influencing the distribution of damage and causalities in urban area when large earthquake occur. In this research, the classification of amplification factors is grouped into 4 (four) classes: very low hazard, low hazard, moderate hazard and relative high hazard based on amplification factor (A) or peak ratio HVSR spectrum. Very low hazard is the region of amplification factor from 1.0 to 2.5, low hazard is the region of amplification factor value from 2.5 to 3.5, and moderate hazard is the region of amplification factor with value ranging from 3.5 to 4.5 and relative high hazard amplification factor or peak HVSR spectrum ranging from 4.5 to 7.0.
Table 12 Amplification factor area
Amplifications Area (Ha) Percentage (%) 1.0 – 2.5
2.5 – 3.5 3.5 – 4.5 4.5 – 7.0
110.638 203.753 248.581 604.635
9.48 17.45 21.29 51.78
Total 1.167.605 100
23
Table 12 shows that the most amplification factor is located in 4.5-7.0 region (51.78%) followed by 3.5-4.5 region (21.29%), 2.5-3.5 region (17.45%) and 1.0-2.5 region (9.48%). From the analysis of the spectrum of H/V can be seen that he study are has a peak value HVSR at intervals of values from 0.8 to 1.5. Contour map HVSR peak value (A) is shown in Figure 11. High amplification factor was found almost all area. Figure 11 described that the highest amplification factor are distributed in the southern area and northern area. This map shows areas where the earthquake hazard is increased due to amplification of ground motion.
HVSR peak value or amplification factor (A) correlated with the damage caused by the earthquake. If an area has a low predominant period value and high value of amplification factor will produce a high level of damage to buildings. From the data obtained, the values of amplification factor and predominant period at all points of measurement are values varied. It is pointed out that the areas of nuclear power plant not have high levels building damage that caused by an earthquake.
Analysis
In order to determine earthquake hazard areas of the study areas Simple Additive weighting (SAW) method was applied. Simple additive weighting also known as weighted linear combination or scoring method is a simple and the most often used multi attribute technique. The six map layers, each of which defines a criterion necessary to be considered in determine earthquake hazard areas were prepared. Combining and weighting the six layers was accomplished using the raster calculator.
Simple Additive Weighting (SAW) is found easy to apply and it is quite widely applied in real world, however, it is criticized for having little theoretical foundation and its ignorance of the definition of the units of measurements. The first step is to give identifying the criteria and decision rules of each thematic map. Such criteria were used as indicators for determine earthquake hazard areas that are prone to future earthquake damage. A set six criteria and decision rules are derived from field survey data, cartographic maps and literature review. Such criteria were classified into geological, geophysical and terrain characteristic. The selected geological criteria are the rock type and the faults. The geophysical criteria are the dominant periods and amplification factors. The terrain characteristic criterion is represented by the slope. The selected set of criteria and decision rules are explained in bellow:
- Lithology : The younger age of rock is more damage effect to earthquake hazard (Bealand,1996)
- Fault distance : Closely fault distance is more damage effect to earthquake hazard (Mohsen, et.al.,2012)
- Earthquake Intensity : Higher earthquake Intensities are more damage effect to earthquake hazard (FEMA, 2001)
- Dominant Period : Higher natural periods are more damage effect to earthquake hazard (Molas, et.al,2005)
24
- Slope : Steeper slope angles are more damage effect to earthquake hazard (Andrian,2009)
After the decision rule and criteria are designed, the assigned weight and rank values for the layers/classes of each layer/classes, according to relative importance of that layer/classes to earthquake hazard areas map. In the assigning of weight and rank values, inverse weighting and ranking criteria is used as given in table below:
Table13 Classification of weight values (Malczewski,1999)
Weight Classification
Table 14 Classification of rank values
Rank Classification
The assigned weight and rank values for the layer/classes of the study area
based on geological and geophysical expert’s judgment are given in Table 13. As
can be observed from the table, the most important layer was defined as the fault distance followed by the earthquake intensity, dominant period, amplification factors, lithology and slope layer in decreasing order of importance. In the determination of the weight values, the fault distance layer has been given the greatest value because of an earthquake is caused by the sudden release of slowly
accumulating strain energy along the a fault within the earth’s crust. It means that
25
a. The ranking values for the classes of fault distance layer are 4 for very high earthquake hazard potential, the ranking for the high earthquake hazard potential classes as 3, since there is still a danger of earthquake hazard, but no as the very high earthquake hazard potential class.
b. The rank values for the classes of the earthquake intensity are assigned as 4 to the prone areas and 1 to the safe areas, so that the most favorable class is ranked far from unsafe class.
c. In the dominant period layer the classed are sorted according to their soil behavior as rock, hard soil, medium soil and soft soil. The rangkings are given 4,3,2, and 1 respectively.
d. In the amplification layer, the classes are ranked as 4, 3,2 and 1 for high hazard, moderate hazard, low hazard and very low hazard classes, respectively.
e. The ranking values for the classes of the lithology layer are 4 and 1 for the most and the least hazardous classes respectively. The ranking of the intermediate lithology class is assigned as 3, since, with the simple additional precautions, this class can also be suitable for determine earthquake hazard area.
f. The ranking values for the classes of slope layer are given as 4 and 1 for the high and low hazard slope classes respectively.
Table 15 Assigned weight and rank values for the classes of the study area
26
values are given on different scales, they must be standardized to a common dimensionless unit. The simplest formula for standardizing the raw data is to divide each raw score by the maximum value for a given criterion (Malezewski, 1999). Standardization is important, because the scores of the criteria are given on different scales, they must be standardized to a common dimensionless unit. Hence, the rank values of the classes were standardized according to the relative distance between the origin and the maximum rank value, using the following formula:
X
ij =X
ij /X
jmax (6)Where
X
ij is the standardized rank value for the ith class for the jth layer.X
ij isthe rank value, and
X
jmax is the maximum rank value for the jth layer.On the other hand, the weight values were normalized by dividing each weight by the sum of the weights. Thus the sum of the normalized weight values was equal to 1. After the standardization of values in each map layer, the criterion weights and ranks were defined as shown in Table 16.
27
To obtained the determine earthquake hazard areas map; the technique of overlaying of index maps was used. When overlaying the index maps, equation 2.3 was used and the earthquake hazard areas map was obtained for the study area with index values ranging from 0.25 ( low earthquake hazard areas) to 1 (very high hazard areas to earthquake).
The earthquake hazard areas map of the study area was categorized in three resultant classes as: High damage areas, moderate damage areas and low damage areas (Table 17). Areas of high damage are those with slopes steeper, high amplification factor, high period dominant, quarternary litology,high earthquake intensity or short fault distance. The boundary conditions for three categories were evaluated according to the expert judgment taking into consideration the score distribution by means of discrete histograms. The output map produce by the method of SAW is given in Figure 12. The even weighted approach yielded a classification of earthquake hazardous areas over the study area. In the varied weighted approach, a total weight was computed from the sum of three respective components for each polygon (Slope, Lithology, Fault distance, Amplification Factors, Predominant period and earthquake intensity) making up the study area.
Table 17 Total Score Classification of Earthquake Hazard Areas
Classification of Earthquake moderate level of earthquake hazard is dominantly found on Bangka Island with 809.735 Ha or 69.35 % totally of study area. Earthquake prone area distributed at the east part of Bangka islands. Exactly earthquake prone area is located in several districts such as Bangka Barat, Bangka Selatan and Bangka with totally 221.692 Ha.
Table 18 Classification of earthquake hazard areas
Classification of earthquake
hazard areas Area (Ha) Percentage (%) High Damage areas
28
minor. For the feasibility site for nuclear power plants were created using Simple Additive Weighting method describe the areas is categorized moderate earthquake affect damage.
The objective of this map is to show areas of Bangka Island where the earthquake hazard is likely to be increased due to the presence of potentially unstable slopes, and soils susceptible to amplification of ground motion.
Many seismologists have said that "earthquakes don't kill people, buildings do". This is because most deaths from earthquakes are caused by buildings or other human construction falling down during an earthquake. Earthquakes located in isolated areas far from human population rarely cause any deaths. Figure 13 is taken from a Google earth, 2011, satellite image showing the location of the proposed nuclear power plant in South Bangka Regency. In Figure 13 an image of feasibility site for nuclear power plant it are very clear low human population, far from volcano can be easily distinguished.
Figure 12 Earthquake hazard areas map
29
Comparison result of earthquake hazard areas map (Figure 12) with the satellite image showing the candidate sites for nuclear power plant in Bangka Island are located in areas of no significant earthquake risk.
The important of this model is that we can identify the areas which will be affected if the earthquake occurrence in Bangka Island. Such maps normally aim providing a document that depicts the likelihood or possibility of new earthquake occurring on this island, and therefore helping to reduce futures damages.
Figure 13 Google earth image feasibility site for nuclear power plant in West Bangka
30
4. CONCLUSSION
In the scope of this study, the weight and rank values which are used in the SAW method are assigned properly according to the geological and geophysical
expert’s judgment. On the other hand, the SAW method definitely has an
advantage in rapidity. In applying this method, the result can be realized quickly with the contribution of a qualified expert. However, since SAW method uses direct assignment of the weights/ranks, the qualification of the expert needed is much more.
Determine earthquake hazard areas can be modeled using GIS technologies. There are several factors that can be used to determine earthquake hazard areas, such as earthquake intensity, slope, predominant period, amplification factors, lithology and fault distance. The assignment of the weight and rank values and the analysis was performed by application of the SAW method. As a result, the study area was categorized into three different zones regarding the foundation determine earthquake hazard areas as: 1) Low Damage Areas; 2) Moderate Damage Areas; 3) High Damage Areas. According to this final map, the majority of the study area was been found to be in the Moderate Damage Area zone.
Based on the final earthquake hazard areas map, the determination of hazardous areas in feasibility site for nuclear power plant are located in areas categorized moderate earthquake affect damage.
5. RECOMMENDATIONS
Recommendations as the result of this study are as follows:
1. According to the result of this study, the GIS approach can be used for next prediction determine earthquake hazard areas in Indonesia Region
2. Since this analysis is truly dependent on data accuracy, reliability, and validity. On the other words, the result accuracy is really dependent on the data being inputted. Therefore, the availability of data accuracy, reliability, and validity are required.
3. To obtain accurate results in spatial analysis, data used must have more detailed information
31
REFERENCES
Ali Zadeh Mohsen et.al. 2012. Application of Spatial Multicriteria Evaluation (SMCE) in Classification of Earthquake Hazard (Case Study: Amol County). International Journal of Engineering Research and Technology (IJERT), Vol. 1 Issue 7.
Andi dan Djamal. Peta Geologi Lembar Bangka Utara, Sumatera, Skala 1: 250.000 (1994).
Ayalew, Luseged., Yamagishi, Hiromitsu., Ugawa, Norimitsu. 2004. Landslide susceptibility mapping using GIS-based weighted linear combination, the case in Tsugawa area of Agano River, Niigata Prefecture, Japan. Landslides 1, 73-81.
BAPETEN, 1999, Keputusan Kepala Badan Pengawas Tenaga Nuklir No: 01/Ka-BAPETEN/V1-99, Pedoman Penentuan Tapak Reaktor Nuklir, Badan Pengawan Teknik Nuklir, Jakarta.
Bakun, W.H., Johnston, A.C. and Hoper, M.G.. 2003. Estimating Locations and Magnitudes of Earthquakes in Eastern North America from Modified Mercalli Intensities, Bulletin of Seismological Society of America (BSSA). Bealand, S. et.al. 1996. Earthquake Hazard Analysis of Waikato Regional Council
Area. Client Report 1996/3359n. Istitute of Nuclear and Geological Sciences.
Bulcock, Andrian. 2009. Geotechnical Investigation. Final Report Steep and Unstable Land Study. Toowoohaba Regional Council.
Centre for Nuclear Energy Development National Nuclear Energy Agency of Indonesia. 2010.Terms of Reference (TOR) of Nuclear Power Plant Sitting in Bangka Island of Bangka Belitung Province (2011-2013)
Centre for Nuclear Energy Development National Nuclear Energy Agency of Indonesia. 2010. Annex Terms of Reference (TOR) of Nuclear Power Plant Sitting in Bangka Island of Bangka Belitung Province (2011-2013)
Chavez David, E. & Presttley Keith, F.,1985. ML Observations in The Great Basin and Mo Versus ML relationships for the 1980 Mamoth Lakes, California Earthhquake Sequence. Bulletin of Seismological Society of America (BSSA).
Dowrick, D.J.1992. Attenuation of Modified Mercalli Intensity in New Zealand Earthquakes. Earthquake Engineering and Structural Dynamics, 21:181-196 Dowrick, D.J & Rhodes, D.A..1999. Attenuation of Modified Mercalli Intensity in
New Zealand Earthquakes. Bulletin of The New Zealand Society for earthquake Engineering, 32:55-89.
Duval A.M., Bard P.Y., Meneroud J.P.,Vidal S., 1994, “Usefulness of
microtremor measurements for site effect studies, Proceedings of the Tenth European Conference on Earthquake Engineering, Vienna, Austria, Balkema, Duma Ed., I, 521-528.
Duval A.M., Bard P.Y., Meneroud J.P.,Vidal S., 1995, Mapping site effects with microtremors, Proceedings of the Fifth International Conference on Seismic Zonation, October 17-19, Nice, France,Ouest Ed. II, 1522-1529.
32
Fukushima Yoshimitsu, Bonilla Fabian, Scotti Oona and Douglas John. 2007. Site Classification Using Horizontal to vertical Response Spectral Ratios & Its Impact When Deriving Empirical Ground Motion Prediction Equation. Journal of Erathquake Engineering 11,5.
Ivis Frank. 2006. Calculating Geographic Distance Concepts and Methods. Canadian Institute for Health Information. NESUG, Geog 271.
Japan Road Association. 1990. Specification for Highway Bridges Parts V Seismic Design. Maruzen Co.,LTD.
Kayal,J.R. 2006. Seismic Waves and Earthquakes Location. Geological Survey India. http://wwwescweb.wr.usgs.gov/Share/money/SriII2.pdf
Maksud Kamal, A.S.M. & Midorikawa Saburah.2006. Geomorphological Approach for Seismic Microzoning Within Dhaka City Area, Bangladesh. The Geological Society of London. IAEG Paper Number 457.
Mwemezi Jovin J. & Huang Yonfang. 2011. Optimal Facility Location on Spherical Surfaces: Algorithm and Application. New York Science Journal, a(7):21-28 ISSN:1554-0200
Malczewski, Jacek. 1999. GIS and Multicriteria Decision Analysis. New York: John Wiley & Sons, Inc., 182-187.
Nakamura, Y., 2000, Clear identification of fundamental idea of Nakamura’s
technique and its applications: Proceedings of the 12th World Conference on Earthquake and Engineering, 2656-2664.
Peraturan Presiden Republik Indonesia Nomor 5 Tahun 2006 Tentang Kebijakan Energi
Nasional.www.prokum.esdm.go.id/perpres/2006/perpres_05_2006.pdf Peraturan Presiden Republik Indonesia Nomor 64 Tahun 2005 Tenatang
Perubahan Keenam Atas Keputusan Presiden Nomor 103 Tahun 2001 Tentang Kedudukan, Tugas, Fungsi, Kewenangan, Susunan Organisasi dan Tata Kerja Lembaga Pemerintahan Non Departemen.
http://www.batan.go.id/peraturan/download/1140695225Perpres64_2005.pdf Sitharam, T.G. and Anbazhagan,P.2008. Seismic Microzonation: Principles,
Practices and Experiments. The Electronic Journal of Geotechnical Engineering (EJGE) Special Volume Bouquet 08, online. Bangalore City, India. Map Asia Forum. Kualumpur, Malaysia.
Undang-Undang Negara Republik Indonesia Nomor 10 Tahun 1997 Tentang Ketenaganukliran. http://www.jdih.den.go.id/download/17/undangudang-no-10-tahun-1997
Tsutomu SATO, Yutaka NAKAMURA and Jun SAITA, Evaluation of The Amplification Characteristics of Subsurface Using Microtremor and Strong motion, - The Studies at Mexico City -, 13th World Conference on Earthquake Engineering, Vancouver, B.C., Canada August 1-6, 2004, Paper No. 862
U.Margono, RJB. Supandjono dan E. Partoyo, (1995). Peta Geologi Lembar Bangka Selatan, Sumatera, Skala 1: 250.000, (1996)
http://www. quakeinfo.ucsd.edu http://www.embc.gov.bc.ca