i
PROJECT’S TITLE
AN ANALYSIS OF LARD BY USING DIELECTRIC SENSING (IMPEDANCE)
CHIN KAH YIN
This Report Is Submitted In Partial Fulfillment Of Requirement For The Bachelor Degree of Electronic Engineering (Industrial Electronic)
Fakulti Kejuruteraan Elektronik dan Kejuruteran Komputer Universiti Teknikal Malaysia Melaka
ii
DECLARATION
UNIVERSTI TEKNIKAL MALAYSIA MELAKA
FAKULTI KEJURUTERAAN ELEKTRONIK DAN KEJURUTERAAN KOMPUTER
BORANG PENGESAHAN STATUS LAPORAN PROJEK SARJANA MUDA II
Tajuk Projek : An analysis of lard by using dielectric sensing (Impedance)
Sesi Pengajian : 1 5 / 1 6
Saya CHIN KAH YIN……….……… (HURUF BESAR)
mengaku membenarkan Laporan Projek Sarjana Muda ini disimpan di Perpustakaan dengan syarat-syarat kegunaan seperti berikut:
1. Laporan adalah hakmilik Universiti Teknikal Malaysia Melaka.
2. Perpustakaan dibenarkan membuat salinan untuk tujuan pengajian sahaja.
3. Perpustakaan dibenarkan membuat salinan laporan ini sebagai bahan pertukaran antara institusi pengajian tinggi.
4. Sila tandakan ( √ ) :
SULIT* *(Mengandungi maklumat yang berdarjah keselamatan atau kepentingan Malaysia seperti yang termaktub di dalam AKTA RAHSIA RASMI 1972)
TERHAD** **(Mengandungi maklumat terhad yang telah ditentukan oleh organisasi/badan di mana penyelidikan dijalankan)
TIDAK TERHAD
Disahkan oleh:
__ _________________________ ___________________________________
(TANDATANGAN PENULIS) (COP DAN TANDATANGAN PENYELIA)
iii
“I hereby declare that the work in this project is my own except for summaries and quotations which have been duly acknowledge.”
iv
DEDICATION
“I acknowledge that I have read this report and in my opinion this report is sufficient in term of scope and quality for the award of Bachelor of Electronic Engineering
(Industrial Electronics) with Honours.”
v
vi
ACKNOWLEDGEMENT
vii
ABSTRACT
viii
ABSTRAK
ix
TABLE OF CONTENT
CHAPTER CONTENTS PAGE
PROJECT’S TITLE ... i
DECLARATION ... ii
DEDICATION ... iv
ACKNOWLEDGEMENT ... vi
ABSTRACT ... vii
ABSTRAK ... viii
TABLE OF CONTENT ... ix
LIST OF TABLES ... xii
LIST OF FIGURES ... xiii
LIST OF ABBREVIATIONS ... xv
I INTRODUCTION ... 1
PROJECT OVERVIEW ... 1
PROBLEM STATEMENT ... 2
OBJECTIVE OF STUDY ... 2
SIGNIFICANCE OF THE STUDY ... 3
x
II LITERATURE REVIEW ... 4
LARD DETECTION TECHNIQUES ... 4
2.1.1 Polymerase chain reaction (PCR) ... 4
2.1.2 Electronic Nose (E- Nose) ... 5
2.1.3 Gas liquid chromatography (GLC) ... 7
2.1.4 Fourier Transform infrared Spectroscopy (FTIR) ... 8
2.1.5 Differential scanning calorimetry ... 10
INTERDIGITATED ELECTRODE (IDE) ... 19
2.2.1 Introduction ... 19
2.2.2 Electrode material ... 20
2.2.3 Parameters in electrode design ... 21
2.2.4 Equivalent circuit analysis ... 21
III METHODOLOGY ... 28
TAGUCHI METHOD ... 29
3.1.1 Identification of the main function and side effect ... 30
3.1.2 Identification of the control factors and levels ... 31
3.1.3 Identification of orthogonal array ... 31
3.1.4 Matrix experiment expected outcome ... 33
EXPERIMENT PROCEDURE ... 35
3.2.1 Fabrication of IDE ... 35
xi
3.2.3 Preparation of LARD ... 38
3.2.4 Experiment set-up ... 41
LINEAR REGRESSION ... 42
IV RESULT AND DISCUSSION ... 44
TAGUCHI METHOD ... 44
IMPEDANCE MEASUREMENT ... 44
LINEAR REGRESSION DATA ANALYSIS ... 50
DISCUSSION ... 54
V CONCLUSION AND RECOMMENDATION ... 56
CONCLUSION ... 56
RECOMMENDATION ... 57
xii
LIST OF TABLES
NO TITLE PAGE
2.1 Master table for lard detection technique 12
2.2 Master table for interdigitated electrode 23
3.1 Control factors and levels 31
3.2 Orthogonal array of �9 32
3.3 Orthogonal array �9 with defined control factor 33 3.4 Predicted measured value impedance from the statistical analysis 34 3.5 Signal to ratio value of predicted measured value 34 3.6 Specification of interdigitated electrode sensor (IDE) 35
4.1 Specification of IDE design 44
4.2 Adjusted R square value of sample of IDE 30 51
4.3 Adjusted R square value of sample of IDE 34 52
4.4 Adjusted R square value of sample of IDE 38 53
xiii
LIST OF FIGURES
NO TITLE PAGE
2.1 Previous study of lard detected at band 387 bp 5
2.2 Working principle of E-Nose 6
2.3 Previous study of VaporPrint of aroma pattern 6
2.4 Gas Liquid Chromatography working principle 7
2.5 Block diagram of FTIR method 9
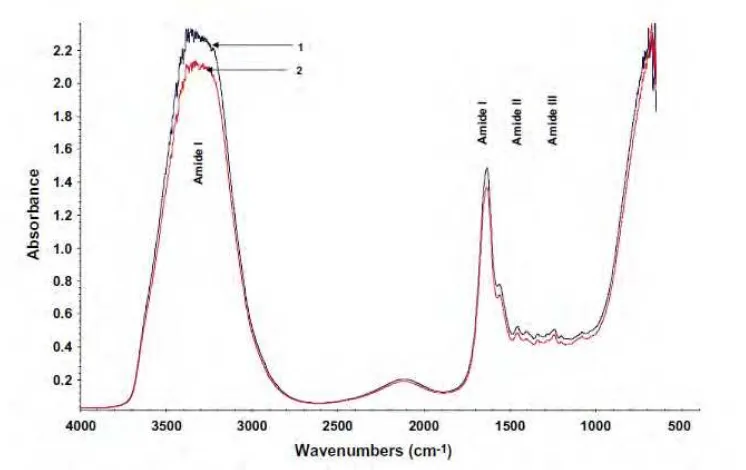
2.6 Previous studies of FTIR result where 1 is bovine gelatin and 2 is porcine gelatin 9
2.7 Differential scanning calorimetry design 10
2.8 Previous studies of DSC heating thermograms (A and B) and cooling thermograms
(C and D) 11
2.9 Design of Interdigitated electrode 19
2.10 Equivalent circuit of IDE 21
3.1 Steps for Taguchi method 30
3.2 IDE 42 electrodes design in CorelDRAW 35
3.3 Design in COMSOL multiphysic of 42 electrodes 36
3.4 Positive mask for IDE design 36
3.5: IDE design on PCB 37
3.6 LCR meter test clip with 4 BNC cable 37
3.7 Calibration set-up 38
3.8 Extraction of lard 39
3.9 Lard after heated two hours 40
3.10 Lard extraction from aluminium container 40
3.11 Lard filtration 40
3.12 Experiment set-up 41
3.13 No reheating 42
xiv
3.15 Reheating 4 hours 42
3.16 Reheating 6 hours 42
4.1 SNR level of control factors 45
4.2 IDE 30 measurement for (a) Impedance of lard sample 1; (b) Impedance of lard
sample 2; (c) Impedance of lard sample 3 46
4.3 IDE 34 measurement for (a) Impedance of lard sample 1; (b) Impedance of lard
sample 2; (c) Impedance of lard sample 3 47
4.4 IDE 38 measurement for (a) Impedance of lard sample 1; (b) Impedance of lard
sample 2; (c) Impedance of lard sample 3 48
4.5 IDE 42 measurement for (a) Impedance of lard sample 1; (b) Impedance of lard
sample 2; (c) Impedance of lard sample 3 49
4.6 Impedance measurement of 1000Hz regressed to reheating hours by using IDE30 50 4.7 Impedance measurement of 1000Hz regressed to reheating hours by using IDE34
51 4.8 Impedance measurement of 1000Hz regressed to reheating hours by using IDE38
52 4.9 Impedance measurement of 1000Hz regressed to reheating hours by using IDE 42
xv
LIST OF ABBREVIATIONS
E-NOSE - Electronic Nose
FTIR - Fourier Transform infrared Spectroscopy GLC - Gas Liquid Chromatography
IDE - Interdigitated Electrode SNR - Signal to Noise ratio
PCR - Polymerase Chain Reaction PCB - Printed Circuit Board
1
CHAPTER 1
INTRODUCTION
1
This chapter gives an overall overview of the project which including problem statement, objective, significance of study and scope of project.
Project overview
Lard is a form of fat which in the saturated or unsaturated form that extract from the fatty acid tissue of pigs. Usually it is extracted from back skin, muscle, surrounding digestive organs, surrounding the kidneys of pig[1]. Scientifically, lard is known as triglyceride, it is mainly consisting fats or fatty acid. Culinary use lard to enhance the flavor and crispiness of food. In addition, lard consisting 48% of monosaturated fat that able to reduce the risk of depression and cholesterol compare to other type of fat.
However, it become a main concern in cuisine where chef and baker use lard as shortening or cooking oil. This had increased the risk of consumption of pork content. Foods which contain lard or pig content is non-permissible for Muslim and vegetarian. In the Islamic religious, halal is which mean permissible or allowed. In Islamic law, there are emphasizing prohibited in sources of food which contain pork or lard.
2
different forms which is lard adulteration in shortening, lard adulteration with different type of meat, lard adulteration with canola oil and lard adulteration with RBD palm oil. The available lard detection method is sufficient to test the lard adulteration yet it is time-consuming and expensive.
The new lard detector sensor design by using interdigitated electrode circuit. Interdigitated electrode is a circuit which combine two comb-shape like form. Design of interdigitated electrode is simple and effective. From the design, it able to generate capacitive sensing field when supply with a small voltage. The spacing in between of each line on sensing layer are able to measure the changes of dielectric of material.
Problem statement
Food is necessary for a human and at the same time the enhancement in food science technologies is getting complicated. So that, the origin ingredient of foods are difficult to understand by consumer. Moreover, Chinese cooking culinary including lard as cooking oil or shortening to enhance the flavor is general. In Islamic law, there are impermissible (non-halal) of food which having lard content. Furthermore, Muslim is the religious second most number of people in the world belief and the number is increasing day by day.
Current available lard detection technique are more than five types which including gas chromatography (GC), Electronic nose, Fourier Transform Infrared (FTIR) spectroscopy, etc. However they are huge, time consuming and expensive.
This project is proposed a first stage screening of lard to overcome the problem encountered with rapid speed, cheaper and more portable size.
Objective of study
3
Significance of the study
This project is to analyze a possible method of rapid first stage screening for lard which able detect lard rapidly compare to previous lard detection technique can be implement in a food laboratory for food content verification.
Scope
This project is to analyze a first stage screening lard detector by using dielectric sensing technique. This project will start by using Taguchi method to optimize the design of sensor probe. Next, the result will further analyse by using Minitab software DOE (Design of experiment) to obtain the parameter of most sensitive design. Apart of it, the design will be simulate by using COMSOL Multiphysics and lastly fabricate the layout design by using Corel Draw.
After the optimization the design of sensor by using software, the sensor probe or also known as interdigitated electrode will fabricate and connect with LCR meter. The sensor probe will measure the impedance of lard at different reheated hours at room temperature 25 Celsius.
This project is divided into three stages:
- Research on related topics and optimize the sensitivity of sensor - Fabrication of sensor and verify the functionality
- Measure impedance of lard at different reheated hours
The result obtained will finalize in a graph to show the relationship of impedance and different number of reheated lard.
4
CHAPTER 2
LITERATURE REVIEW
2
This chapter will highlight the past studies which related with lard detection technique, and interdigitated electrode design.
Lard detection techniques
In previous studies, there is some achievement of lard detection for halal authentication. The current issue exists is ingredient label does not include the adulteration of food origin[15], and thus causing the worries of consumers. Therefore, there are methods to identify the adulteration by determining the ratios of different type of chemical composition, and analyze the chemical properties of food in the market. The methods used including Polymerase Chain Reaction (PCR) analysis, Electronic Nose (E-Nose), Gas liquid chromatography (GLC), Fourier Transform infrared Spectroscopy (FTIR), Differential scanning calorimetry and Interdigitated Electrode Sensor.
2.1.1 Polymerase chain reaction (PCR)
This method is a highly sensitive method of extracting the tissue and obtain the information of deoxyribonucleic acid (DNA). Sample species is capable to identify by using this method. Deoxyribonucleic acid (DNA) is a type of genetic form molecule which carries the important unique information of cell[4]. In addition, DNA is stable and non-destructive which brings advantages in the analysis. Therefore, PCR is a high sensitivity method for lard detection.
5
sustainable for repeated analysis. The advantage of this method over others when the pattern of samples obtained, the references are not needed. Moreover, identification of samples species can achieve by PCR primer combine with few enzymes.
Previous achievement of this method in lard detection is band of 387bp yield when amplification of PCR on 125rRNA gene[7] as shown in Figure 2.1. Apart of it, there are not detected of Mt-DNA on reheated food, hydrolyzed plant proteins and purify oil.
Figure 2.1: Previous study of lard detected at band 387 bp[7]
2.1.2 Electronic Nose (E- Nose)
6
Figure 2.2: Working principle of E-Nose
From Figure 2.2, it shows the working principle of this method in block diagram. The sensor array is used to detect the samples and it will computed in a pattern recognition system.
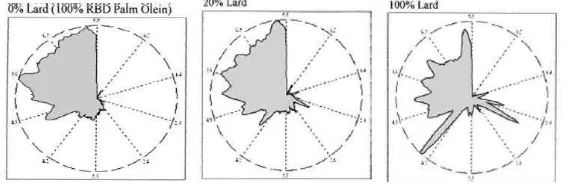
This method is rapid, simple and easy to handle. Previous studies had discussed about this method by comparing lard adulteration with palm olein. The samples had been added iodine volume to indicate the saturation of lard fatty acid[5]. This sensor is sensitive to volatile compounds. In this study, they found the differences of aroma pattern by using VaporPrint as shown in Figure 2.3. Apart of it, there are higher saturated fatty acid compare lard to palm oil.
Figure 2.3: Previous study of VaporPrint of aroma pattern [5]
[image:21.612.186.470.431.525.2]7
2.1.3 Gas liquid chromatography (GLC)
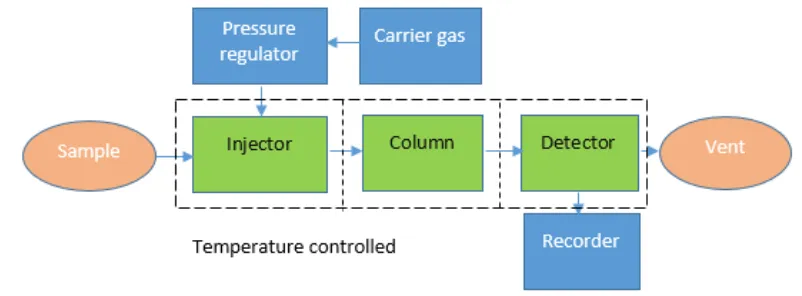
Gas liquid chromatography is chromatography used to analyze the samples that can evaporate without decomposition state. This method able to separate material into two phases, where one phase is in mobile and another in stationary. Liquid is represent the stationary phase where gas is represent the mobile phase. GLC is applicable to complex analysis, which can respond rapidly, high accuracy and high sensitivity. The working principle of GLC is as shown in Figure 2.4.
Figure 2.4: Gas Liquid Chromatography working principle
From Figure 2.4, it shows the flow of GLC work. The sample which is the fat in liquid state will solute into the heated injector tube to vaporized the liquid and mixed with helium gas (carrier gas) then only send to the column. Next, in column path, it will distribute in between of two phases: liquid and gaseous. Some part of pressure in solute vapor exist gaseous phase will depend on the solubility of the liquid phase.[13]
This method only needed a small amount of sample to be analyzed. This method focuses on the sample’s percentage distribution of fatty acids in lard or other type of fats. Therefore, the previous studies had been taken, the percentage distribution of fatty acids in lard or other type of fats tested by using a flame ionization detector.
8
palmitooleostearin (POS), and palmitoolepalmitin (POP)[6]. By using this method, it can clearly differentiate the lard by using triacylglycerol (TAG) composition in level of palmitoolepalmitin (POP), palmitooleoolein (POO) and palmitooleostearin (POS). The level of lard composition in this three type of fatty acid had been identified which is POP = 5.10±0.04%, POO = 21.55±0.08 and POS = 14.08±0.04.
2.1.4 Fourier Transform infrared Spectroscopy (FTIR)
Infrared spectrum of sample can be obtain by using method of Fourier transform infrared spectroscopy (FTIR) either in solid, liquid, or gas state. This method is used to identify the chemical, physicochemical and morphological properties of samples. The basic working principle of this method is measures the amount of light absorbed by a sample used in terms of wavelength. The motion of molecules in samples affected the wavelength and frequencies measured. The wavelength spectrum shows the sensitivity and capabilities of FTIR to differentiate the concentration of the sample. [8]
This method is rapid, accurate, and environmental friendly which able to differentiate the sample according to their wavelength. Apart of it, this technique is very useful for food analysis that able to differentiate the chemical composition as well as the functional group of food.
From Figure 2.5, it shows the basic working principle of FTIR technique. The source will generate the radiation that sends the sample across the desired spectrum. Next, the sample will pass through interferometer and reaches the detector. The incident radiation travels through the sample will emit wave front into component frequencies. After that, the signal receives will amplify by analog to digital converter into digital signal form. Lastly, it will signal will reach computer were able to further analysis.
9
Figure 2.5: Block diagram of FTIR method
[image:24.612.144.517.326.561.2]![Figure 2.1: Previous study of lard detected at band 387 bp[7]](https://thumb-ap.123doks.com/thumbv2/123dok/470202.51382/20.612.132.522.229.458/figure-previous-study-lard-detected-band-bp.webp)