DI YOGYAKARTA : PERIODE 2012-2015
Written By:
Finartih Alfiani Saifun
20110430040
FACULTY OF ECONOMICS
INTERNATIONAL PROGRAM FOR ISLAMIC ECONOMICS AND FINANCE (IPIEF) UNIVERSITY OF MUHAMMADIYAH YOGYAKARTA
i
DI YOGYAKARTA : PERIODE 2012 - 2015
UNDERGRADUATE THESIS
Submitted as fulfillment on the requirement for the degree of Bachelor of Economics at Faculty of Economics on the Department of International Program
for Islamic Economics and Finance (IPIEF)
Written By
Finartih Alfiani Saifun 20110430040
FACULTY OF ECONOMICS
UNIVERSITAS MUHAMMADIYAH YOGYAKARTA
ii
DI YOGYAKARTA : PERIODE 2012 - 2015
Proposed by
Finartih Alfiani Saifun
Agreed By
Supervisor 1
Agus Tri Basuki, SE.,M.Si. NIK: 143 04
Supervisor 2
iii
: PERIODE 2012-2015
Proposed By:
Finartih Alfiani Saifun
20110430040
This Undergraduate thesis has been revised and validated before the Examination Committee of the International Program for Islamic Economic and Finance
(IPIEF),
Department of Economics, Faculty of Economics, Muhammadiyah University of Yogyakarta
August 22nd, 2016
The Examination Committee
Dr. Masyhudi Muqorobin, S.E.,Akt.,M.Ec Chief, Examiner
Dr. Imamudin Yuliadi, S.E.,M.Si. Ayif Fathurrahman,
iv Student Number : 20110430040
I hereby declare that this undergraduate thesis entided “DETERMINANTS
OF RURAL BANK PROFITABILITY IN YOGYAKARATA
: Period
2012-2015 ”
does not consist of any content that ever being proposed for any degree inother university, ideas of any research and publication of other, in exception all quotes and ideas which zre purposely taken are considered as the research references and listes in the references list. Therefore, if any violation of intellectual right is found in this study I agree to accept any relevant academic consequences.
Yogyakarta, 22nd of August 2016
v
(
ه ور
م س م
)
Barang siapa yang menempuh suatu jalan untuk menuntut ilmu, Allah akan memudahkan baginya jalan ke surga
(HR Muslim).
Tidak ada yg terlalu tinggi untuk dicapai manusia, tapi ia harus memanjatnya dengan hati-hati & penuh keyakinan
(H.C.Andersen)
Dunia hanya bisa digenggam dengan tindakan, buka dengan pikiran. Tangan adalah perpanjangan pikiran.
vi
vii
Bank Perkreditan Rakyat Konvensional di Daerah Istimewa Yogyakarta periode Desember 2012-Desember 2015. Sampel dalam studi ini adalah seluruh Bank Prekeditan Rakyat yang beroperasi di kabupaten dan kota Daerah Istimewa Yogyakarta yakni (Bantul, Gunung kidul, Kulon progo, Sleman, Yogyakarta). Penelitian ini menggunakan data panel dari data laporan keuangan tahunan yang pada kabupaten / kota di Yogyakarta dari tahun 2012 hingga 2015. Hasi studi menunjukkan bahwa tingkat kecukupan modal (Capital Adequacy Ratio) berpengaruh positif dan signifikan terhadap kinerja keungan sementara tingkat likuiditas dan penyaluran kredit (Loan to Deposit Ratio) berpengaruh tidak signifikan terhadap kinerja keuangan, tingkat kualitas asset (Non Performing Loan) dan tingkat efisiensi operasional (BOPO) berpengaruh negatif dan signifikan terhadap kinerja keuangan.
viii
bank profitability in yogyakarta period 2012-2015. Rural Bank is a financial institution whose main activity accept demand deposits, savings and deposits to society so helps rationalize the developing regions or developing country to finance their progress. As it is necessary to control the quality of rural bank performance which is to see the level of profitability by using Return on Assets ratio. This study uses panel data from annual financial statement data published in in districts / cities from 2012 to 2015. The result shows that capital rate (capital adequacy ratio) has positive and significant impact to ROA. liquidity rate and credit distribution rate (loan to deposit ratio) is not significant to ROA. Asset quality rate (Non- Performing Loan) and operational efficiency rate (BOPO) has significantly negative influence to ROA.
ix
All Praises be to Allah SWT, the Almighty God, The Only One God, He has no partners, The Creator of everything in this Universe, and none Creature stand against Him. Who has given his Gracing for health and Opportunity Till I Can Finish And Complete Writing This Undergraduate Thesis Entitled: “
Determinants Of Rural Bank Profitability In Yogyakarta : Period
2012-2015
And also Peace and Salutation always delivered to our bestmessenger Muhammad Peace be upon Him. Who has become Uswatun Hasanah for all of us.
This Undergraduate Thesis has been structured in partial fulfillment for the requirement for the degree of Bachelor of Economics on Economic Department in Muhammadiyah University of Yogyakarta. With expectations, this Undergraduate Thesis can be used as input for related parties in region to promote the basic sector.
The completion of structuring this Undergraduate Thesis is cannot be separated from the guidance and support of various parties. Therefore, in this opportunity author would to say a lot of thanks to:
x
and I do promise to always make them proud of me. And also to My young brother Muhammad Sahidu Saifun, little brother Abdul Syukur and My little sister Salma Nurmalida.
3. The Honorable Prof. Dr. Bambang Cipto, M.A., as the Rector of Muhammadiyah University of Yogyakarta.
4. Dr. Nano Prawoto, SE.,M.Si., as a Dean of Economic Faculty.
5. Dr. Masyhudi Muqorrobin, S.E., Akt., M.Ec., as the Director of International Program for Islamic Economics and Finance. Muhammadiyah University of Yogyakarta.
6. Dr. Imamudin Yuliadi, S.E., M.Si., as the Head of Economic Department. Muhammdiyah University of Yogyakarta.
7. Mr. Agus Tri Basuki, S.E., M.Si., and Dr. Masyhudi Muqorrobin, S.E., Akt., M.Ec., as my supervisor in writing this Undergraduate Thesis.
8. All Lectures and staff for Economics and IPIEF Dear all IPIEF lectures and IPIEF staff: Dr. Wahdi Yudhi, Diah S Dewanti, M.Sc., Yuli Utami, M.Ec., Dr. Firman Pribadi, Dr. Jaka Sriyana, Dr. Abdul Hakim, Mr. Hudiyanto, Dr. Endah Saptuti, Hendrianto, M.Ec, Anggi Rahajeng, M.Ec, Mr. Umar, MA, Mr. Sahlan, Mrs. Linda Kusumastuti, SE.
xi
10. Big Family of Himpunan Mahasiswa Ilmu Ekonomi (HIMIE) UMY.
11. My beloved friend Riski Maulana for all support and pray
12. My Friends ( Mahrus Lutfi, Ery Dwi Pintari, Ika lailatul Jannah ,Herika Jenifer, Caca, Yusuf, Ambar ).
13. My girls from Kos Amelia (Lia, Ayu, Tias,Windi, Nungki, Eca).
Hopefully, this research will give benefits to anyone who needs, and there are still more weakness and mistakes, therefore, it required to criticism and best suggestions for any better results.
Yogyakarta, 22nd of August 2016
xii
TITTLEPAGE ……….i
SUPERVISORS AGREEMENT PAGE ………..ii
AUTHORIZATION PAGE ……….iii
DECLARATION………iv
MOTTO PAGE ………v
TRIBUTE PAGE ………vi
ABSTRAK ………vii
ABSTARCT ………viii
ACKNOWLEDGEMENT ……….ix
CONTENTS ………xii
LIST OF TABLE ………xiv
LIST OF FIGURE ………xiv
CHAPTER I INTRODUCTION A. Background………...1
B. Research Limitation………7
C. Research Question ………..7
D. Research Objectives ………8
E. Research Benefit ………9
xiii
D. Hypothesis ……….28
CHAPTER III RESEARCH METHODOLOGY
A. Subject and Object Research ………..29 B. Type and Source of Data ………..29
C. Population and Sample ………30
D. Data Collection Techniques ………..……28
E. Definition Variable Operational Research ………..31
F. Analysis Method ………..………32
CHAPTER IV RESEARCH FINDINGS A. General Overview ……….45 B. Data Quality Test………....…..48 C. Selection Model ………51
D. Analysis of Panel Data Model ………...53
E. Estimation Results of Panel Regression Model ……… 54 F. Theory Test (Economic Interpretation) ………. 62
CHAPTER V CONCLUSION A. Conclusion ………67 B. Suggestion ……….68
C. Limitations ……….69
xiv
LIST OF TABLE
1.1ROA of Rural Banking Yogyakarta Province ………5
3.1 Variables Operational Definition ………..….31
4.1 Yogyakarta Special Region ………...45 4.2 Heteroscidasticity Test with Park Test ………50
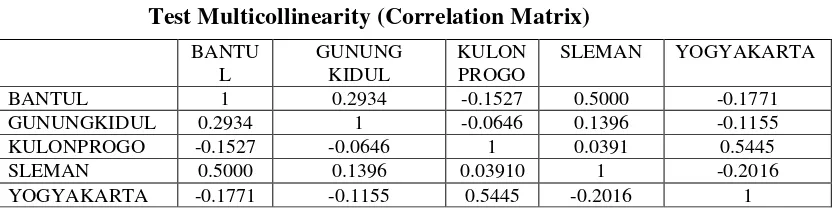
4.3 Test Multicollinearity (Correlation Matrix) ………..50
4.4 Chow Test (Test Likelihood)………..47
4.5 Hausman Test………...…………...………52
4.6Results Estimate ………..……….49
4.3 Fixed Effect Model Estimation Results …....…...………....…………...51
4.4 Statistical test ………..……….55
LIST OF FIGURE
2.1 Research Framework ………27
The main objective of this study is to find out the determinants of rural bank profitability in yogyakarta period 2012-2015. Rural Bank is a financial institution whose main activity accept demand deposits, savings and deposits to society so helps rationalize the developing regions or developing country to finance their progress. As it is necessary to control the quality of rural bank performance which is to see the level of profitability by using Return on Assets ratio. This study uses panel data from annual financial statement data published in in districts / cities from 2012 to 2015. The result shows that capital rate (capital adequacy ratio) has positive and significant impact to ROA. liquidity rate and credit distribution rate (loan to deposit ratio) is not significant to ROA. Asset quality rate (Non- Performing Loan) and operational efficiency rate (BOPO) has significantly negative influence to ROA.
dalam studi ini adalah seluruh Bank Prekeditan Rakyat yang beroperasi di kabupaten dan kota Daerah Istimewa Yogyakarta yakni (Bantul, Gunung kidul, Kulon progo, Sleman, Yogyakarta). Penelitian ini menggunakan data panel dari data laporan keuangan tahunan yang pada kabupaten / kota di Yogyakarta dari tahun 2012 hingga 2015. Hasi studi menunjukkan bahwa tingkat kecukupan modal (Capital Adequacy Ratio) berpengaruh positif dan signifikan terhadap kinerja keungan sementara tingkat likuiditas dan penyaluran kredit (Loan to Deposit Ratio) berpengaruh tidak signifikan terhadap kinerja keuangan, tingkat kualitas asset (Non Performing Loan) dan tingkat efisiensi operasional (BOPO) berpengaruh negatif dan signifikan terhadap kinerja keuangan.
1
The increasing amount of travelers and total immigrants who attend school, provides an opportunity for people to open and develop business. Micro, small and medium enterprises (SMEs) have very important role in economic growth and to overcome the unemployment problem. The development of micro enterprises make it as strategy to government efforts in the fight against poverty and unemployment in the region of Yogyakarta. Especially in this case, the necessary support of the government and financial institutions moreover from Bank and Rural Bank is required. Commercial and rural banks, in the economic system, serve as the provider of services of payment transactions, both domestically and abroad. The funds are derived from the public in the form of deposits or certificates of deposit, checking accounts, and of other savings. While RB (Rural Bank) itself served as the lender, providing funds and financing placement in accordance with Islamic principles. It can be widely understood that BPR has an active role to the development of UMKM.
the global crisis, now able to survive the aftermath of Merapi eruption that occurred in 2010 with reference to its financial results.
In fact the development of UMKM in Indonesia have not been optimized maximally due to various constraints. There are several major factors that influenced the development of UMKM; capital, marketing, government policies and undergoing production systems. These four relate to each other in its influence to the development of UMKM in Indonesia. Therefore, UMKM require the role of financial institution in its development. Based on Government Regulation in Lieu of Law No.10 In 1998, the structure of banking in Indonesiaconsists of commercial and rural banks. In terms of developing UMKM, Rural Bank has a very active and supportive role. The existence of Rural Bank in Indonesia is adjuvant to economic sector, either nationally or in smaller region. And Yogyakarta is one of them. Rural Bank in Yogyakarta (DIY) is considered to be able to survive the global crisis that stroke the banking world of Indonesia in early 2008.
can not be separated from the ability to obtain profits financially. Barnekel (2012) said that a company can achieve high profits with strong internal processes in managing the available assets and debts. Asset and debt management is recognizable from the financial and non financial capabilities provided to public so as to contribute to the profitability of BPR.
Profitability as a basis for sound bank assessment conducted by Bank Indonesia is also measured from the aspect of profitability done by using ROA indicator. ROA, the greater it is the greater the level of profit which the bank will achieve and lead to the better the bank's position will reach in terms of using its assets (Dendawijaya, 2009: 118). The profitability according Munawir (2010: 33) is the company's ability to generate profits for a certain period. Profitability of a company can be determined by comparing the income earned in a given period by the total assets and total capital of the company ". Aremu et al. (2013) declared the ultimate goal to be achieved as a company's most importanceis to obtain the maximum profit or gain. The profitability can be used as an illustration of how the companyability achieve its objectives (Raheem and Malik, 2013).
Below is a list of developments ROA of BPR in 5 areas in Yogyakarta, namely :
Table 1.1.
ROA of Rural Banking Yogyakarta Province (%) Period 2012-2015
Source: Indonesian Bank 2012-2015
In above table can be seen that Rural Bank in 2012 by 1.74%, in 2013 to 2014 which is 2.24% and 1.66%, and then by 2015 of 2.25%. In the district of Gunung kidul ROA of years 2012 and 2013 increased 2.69% and 2.72%. then increased again in 2014 to 2.88%, ie 2015 at 1.13%. In Kulon progo Regency at 2012 is 2.30% and 2013 years is 2.54% a year later 2014 by 1.57 % and 2015, namely 1.84%.
Rural Bank in Sleman district has a value of ROA in 2.96% in 2012 and then in 2013 to 2014 was 3.01% and 2.95% and 2015% is 2.19%. In the city of Yogyakarta ROA at 2012 is 3.47% and then in 2013 and 2014 decreased 2.43% and 3.31% and 2015 to 2.56%.
This shows the the fluctuating levels of ROA. ROA indicated the occurrence of issues relating to the profitability of the Rural Bank in Yogyakarta. ROA is also used to measure the ability of bank management in
gaining profits as a whole. The bigger the ROA of a bank is, the bigger the level of profit will be achieved by the bank and so on.
Based on the above background, referring to the ongoing fluctuating ratios of Return on Assets (ROA) in Rural Bank in Yogyakarta, it is necessary to study the factors affecting ROA of Conventional Rural Bank in Yogyakarta as the implementation of bank’s measurement performance in managing and using its assets to generate profit by taking a case study on Conventional BPR spread throughout the cities in the Special Region Yogyakarta where the sample used is entire Conventional BPR in Bantul, Gunung kidul, Kulon progo, Sleman and Yogyakarta.
Where as in this study, the profitability is represented by Return on Assets (ROA) by examining the impact of profitability (ROA) towards CAR (Capital Adequacy Ratio), NPL (Non Performing Loan), and Cost of Operating Income (BOPO) in five districts in Yogyakarta namely districtof Bantul, Gunung kidul, Kulon progo, Sleman and Yogyakarta from 2012-2015.
The study is entitled "Determine of Rural Bank Profitability in Yogyakarta : Period 2012-2015 '' and use annual time series data published from financial statements of eight Rural Banks in yogyakarta as registered in Bank Indonesia. This study also uses multiple regression analysis.
B. Research Limitation
The scope of this research is the area that includes the district of Bantul, Gunung kidul, Kulon progo, Sleman, and Yogyakarta. This research uses method of panel data in the time period of 2012-2015.
C. Research Question
Based on the above explanation, the problems encountered in this paper include the following:
1. How does CAR (Capital Adequacy Ratio) influence to profitability (ROA) of Rural Bank in Yogyakarta ?
2. How does LDR (Loan to Deposit Ratio) influence to profitability (ROA) of Rural Bank in Yogyakarta ?
3. How does BOPO (Operating Income Operating Costs Against) influence to profitability (ROA) of Rural Bank in Yogyakarta ?
4. How does NPL (Non-Performing Loan) influence to profitability (ROA) in Rural Bank Yogyakarta ?
D. Research Objectives
E. Research of Benefits.
In general, this research is expected to increase knowledge about economics to make decisions on policies and to increase local revenue. 1. As specific benefit for science, this research is expected to be a source
of new data that could be further developed in conducting future research.
2. As a reference for researchers who are interested to study in the same field with the different approach and scope.
10
A. Theories
1. Rural Bank (BPR)
The Bank as it has been known by many to be known as a financial institution whose main activity accepts demand deposits, savings and deposits. In addition the bank is also known as a place to borrow money (credit) for the people who need them. Bank is also known as the place to exchange money, move money or accepting all forms of payment and deposit such as payment of electricity, telephone, water, taxes, tuition and other payments.Based on the Law of the Republic of Indonesia Number 10 of 1998 (PPSK,2003) bank consist of two types, are commercial banks and rural banks (RB). Commercial Banks and rural banks is different in its own activities which commercial banks may provide services in payment traffic, while rural bank may not provide services in payment traffic.
sectors that go hand in hand. Up to this time the four sectors of the economy began to grow very rapidly. Judging from the increasing number of objects several new tourism, the construction of several new hotels or inns, many businesses mushrooming in the field of trade and services, micro and medium scale.
The existence rural bank in the Yogyakarta area is very supportive to the capital of 4 sectors of the economy. Rural Bank's role in this is to help capital in the form of credit or loans to support the operational of the business areas. Rural Bank of financing procedures are still simple an alternative choice of the debtor either micro and intermediate businesses.In addition the process is very fast in terms of credit disbursement also be hallmarks of Rural Banks. Increasing number of loans disbursed by the Rural Bank, the higher the ability of banks in generate income in the form of interest income from loans disbursed by the given asset of the most productive in the Rural Bank are the in the form of loans extended to the debtor so that the profit generated Rural Banks also higher.
a. The target of Rural Banks
distribution, and in order that they do not fall into the hands of the release money (loan sharks).
b. The effort of rural bank
Rural Bank’s efforts include efforts to raise and distribute
funds with the aim of getting profit. Rural Bank’s advantages obtained from the spread effects and interest income.
c. The efforts of Rural Bank are :
1) Collects funds from society in the form of deposits in the form of time deposits, savings, and / or other equivalent form with it. 2) Give credit
3) Provider of financing for customers based on the principle of profit sharing in accordance with the provisions stipulated in Government Regulation.
4) Placing funds in Bank Indonesia Certificates (SBI), time deposits, certificates of deposit and / or savings in other banks. SBI are the offered by Bank Indonesia certificates to the Rural Bank when the Rural Bank experienced a liquidity.
d. The Businesses which don't be done of Rural Bank 1) Accepting deposits comprising of demand deposits 2) Conducting of business activities in foreign currencies. 3) Conducting of insurance business.
e. Rural Bank of Credit Allocation
In allocating of credit, there are some things that must be considered by Rural Bank, namely:
1) In providing of credit, Rural Bank required to have belief in the ability and willingness by debtor repay its debts in accordance with the agreement.
2) In giving of credit, Rural Bank shall comply with the provisions of Bank of Indonesia concerning lending limits, guarantees, or other things that are similar, which can be done by the Rural Bank to the borrower or a group of related borrowers, included for companies in the same group with Rural Bank. The maximum limits are the not exceeded 30% of capital in accordance with the provisions stipulated by Bank Indonesia.
limit does not exceed 10% of the capital conform with the provisions stipulated by Bank of Indonesia.
2. Profitability
The financial performance of the bank is a picture of the financial condition of banks in a given period either covering aspects of fund raising and channeling funds. Assessment of the performance of a bank can be done by analyzing the it’s financing report. Banking profitability is a measure of the success of a bank in gain (spread).
Profitability of a bank can be measured by using ROA. ROA is used as a measure of good or poor performance of the bank, the bank managed to make a profit from the business essentially mean capable as an intermediary institution that collect funds from the public and then distribute to those in need, so that it can be a motivator and a dynamic increase in economic activity, and increasing the efficiency of money for productive activities.
Letter No.6/23/DPNP dated 31 May 2004. The Bank said profit high enough when the ROA ratio in the range between 0.5% up to 1.25%.
Factors which affect the profitability of the bank can be sourced from a variety of performance indicators indicated profitability. (Nasser & Aryati, 2000). Important profitability ratio for banks is the Return On Asset (ROA). ROA is important for banks because of ROA is used to measure the effectiveness of the company in generating profits by exploiting its assets. ROA is the ratio between profit after tax to total assets. Mathematically ROA can be formulated as follows:
�
3. Capital Adequacy Ratio (CAR)
Capital Adequacy Ratio is the ratio used to measure the bank's ability to maintain sufficient capital and the ability of banks to identify, measure, monitor, and control risks that arise that could affect the amount of capital banks (Mudrajad Kuncoro and Suhardjono: 2002).
Indonesia, the Capital Adequacy Ratio (CAR) has a value of at least 8%. Bank capital consisted of two components: core capital and supplementary capital. The core capital is capital that comes from the owners of the bank, which consists of the capital subscribed by the shareholders, reserves and retained earnings. Where as supplementary capital consisted of revaluation reserves of fixed assets, allowance for uncollectible accounts, loan capital, and subordinated loans.
Minimum capital requirement is calculated based RWA (Risk Weighted Assets) which is the sum risk weighted assets risk weighted assets balance sheet assets and administrative assets. Risk weighted assets (RWA) balance sheet assets is obtained by multiplying the nominal value of the related assets with a risk weighting of each asset. risk weighted assets administrative assets obtained by multiplying the nominal value of off-balance sheet concerned with risk. The higher the CAR, the better the condition of a bank (Achmad, 2003). If the CAR high means that the bank is able to finance the operations of bank, the bank's favorable circumstances will contribute significantly to the profitability (Kuncoro and Suhardjono, 2002).
means the company will increase but the increase in capital will not increase sales mean no profits also experienced an increase.
Capital adequacy ratio (CAR) where capital by (Darmawi: 90, 2012) can be used for:
1. Protecting Depositors, the primary function of the bank's capital is to protect depositors against loss and protection of depositors when banks in liquidation.
2. Nurturing Depositors Trust, the function of bank capital used to keep banks remain open and operating so that the time and income to cover bank losses and boost confidence of depositors and bank supervisors have regard to the bank.
3. Functions of Operations, is used as the provision of funds for the purchase of land, and machinery as well as equipment and supplies buffer to absorb operating losses occur.
4. Regulator Function Indirectly, the bank's capital is used as the minimum requirements necessary to obtain a permit the establishment of a new bank and branch out, limiting bank lending, investments and takeover.
The value of a bank's CAR can be calculated by the formula:
4. LDR (Loan to Deposit Ratio)
The liquidity ratio or Loans to Deposit Ratio (LDR) is the ratio of loans to deposits. The greater this ratio indicates that more aggressive bank of its liquidity, whereas the smaller the ratio is also greater third-party funds that are not used for the placement of credit (much idle funds) (Taswan, 2010). Loan to deposit ratio states how much of the bank's ability to repay the withdrawal of funds by depositors by relying on loans as a source of liquidity (Dendawijaya, 2003).
Loan to deposit ratio (LDR) describe the amount of third party funds are distributed in the form of credit or in other words, the liquidity ratio shows the ability of banks to make credit as a source of liquidity, the higher this ratio, the lower the liquidity of banks (Dahlan, 1993). The high LDR shows the bank's ability to distribute the funds in the form of loans that will increase the profitability of banks, but on the other hand the liquidity level decreases (unsafe). Meanwhile, if the low LDR mean banks are not able to market its credit so many unproductive idle funds and thus reduce the level of profitability of banks on the other hand the high of liquidity of security is maintained.
5. BOPO (Operating Income Operating Costs Against)
BOPO is the ratio between operating expenses to revenues operating. Cost surgery is the cost incurred by the bank in order to run its core business activities such as interest expenses, marketing costs, labor costs and other operating costs. Operating income is the main income of the bank that is the income earned from the placement of funds in the form of credit and other operating income. The smaller the bank's BOPO indicates more efficient in carrying out its business activities.
According by Dendawijaya (2000) argued that the ratio of operating expenses are used to measure the efficiency and ability of banks to carry out operations . BOPO indicate the operational efficiency of the bank. The higher this ratio indicates more inefficient the operational costs of the bank (Taswan, 2010), so the chances of getting bank profitability is getting smaller. Through Circular Letter No.3/30 DPNP dated December 14, 2001, BI makes provision that BOPO maximum of 90%. Therefore in order to obtain a high profitability of banks to make efficiency against operating costs.
2001, BI makes provision that BOPO maximum of 90%. Therefore in order to obtain a high profitability of banks to make efficiency against operating costs.
6. NPL (Non-Performing Loans)
One of the risks that arise due to the increasing complexity of banking activities was the emergence of non-performing loan (NPL) is the greater. The other words the greater scale of operations of a bank, the oversight of decreases, so the greater the NPL or the greater credit risk (Vishnu Mawardi, 2005). NPL is the ratio of nonperforming loans to total NPL credit. NPL good is that has a value of less than 5%. Non-performing loan (NPL) reflects the credit risk, the smaller the NPL the less the credit risk borne by the bank. Banks with high NPL provisioning will increase the cost of both productive assets and other costs, so the potential for bank losses (Wishnu Mawardi, 2005). According by Tri Basuki (2014)Effect of Non-Performing Loans to Financial Performance (Return On Asset) is variable or non-performing loan ratio of default loans with loans had a negative and significant effect on financial performance (return on assets) RBs in DIY.
B. Previous Studies
1. Adyani&Sampurno,MM (2011). This research used multiple regression analysis, The result of research showed variable CAR and FDR did not have a significant positive effect on profitability (ROA) of banks. And variable BOPO, NPF and significant negative effect on profitability (ROA) of banks.
2. Murdiyanto (2012), This research used multiple regression analysis CAR significant positive effect on the variable ROA. NPL significant negative effect on ROA. BOPO significant negative effect on the variable ROA. Influence LDR to ROA negative effect.
3. Fauzia(2014) ,This research multiple regression analysis The third-party funds a not effect on the profitability banking companies,Non Performing Loan a significant negative effect on the profitability of the banking,Operation Efficiency a significant negative effect on the profitability of banking.
5. Wibowo & Syaichu (2013) This research multiple linear regression analysis, The results of this study indicate that the interest rate variabel has no effect on ROA, inflation had no effect on ROA, CAR had no effect on ROA and neither did NPF. While BOPO variabel had significant influence with negatif direction.
6. Narayana (2013) This research used proporsive sample from this study, can be discerned that the cash flows, loan-to-deposit ratio and the level of capital has a positive effect on profitability, while leverage has no effect on the profitability of BPR in the Denpasar
7. Wulandari & Sudjarni (2013). This research used Panel Multiple Regression, The conclusion from the testing shows the independent variable, capital adequacy ratio and the cash ratio has no effect on profitability, while the non-performing loan has a negative and significant impact on profitability.
8. Agustini1 & Budiasih (2014) This research used Multiple linear regression analysis The results obtained that CAR has a positive effect on ROA, LDR has a positive effect on ROA and NPL negative effect on ROA.
10.Pertiwi1 & Suardikha (2015) This research used purposive sampling and The result of the analysis get credit turnover rate and growth of the amount of credit customers partially positive effect on profitability at BPR in Gianyar Regency.
The previous studies provide relevant information and motivate future research as enrichment of the empirical study to rural bank. Therefore, the author distinguishes this study by offering these following particular differences:
1. Case study of research
This study will cover the rural bank in Yogyakarta from 2012 - 2015 that consist from 5 district/city in Bantul, Gunung kidul, Kulon progo, Sleman, Yogyakarta.
2. Variables
Independent variables that used in this study are profitability that projected with ROA (Return On Assets), Capital Adequacy Ratio(CAR), Loan to Deposit Ratio (LDR), Operating Expense To Operating Income (BOPO), Non-Performing Loan(NPL).
3. Research Period
C. Theoritical framework and Hypothesis
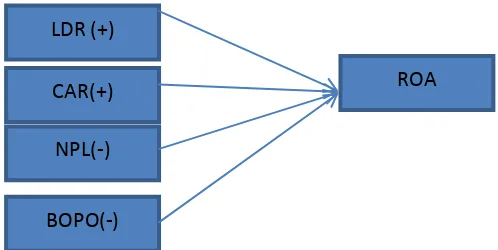
1. Influence Of Capital Adequacy Ratio (CAR) to Profitability
Capital adequacy ratio is the ratio that takes into account how far the entire assets of the bank that contain risks (credit, investments, securities, bill on other banks). Join funded bank's own capital in addition to obtaining funds from sources outside the bank, such as the public loans (debt), and others (Dendawijaya, 2005). Increasingly high CAR means demonstrating the ability of the bank, the better the risk of each loan/assets at risk. If the high CAR means the bank is able to finance its activities for the benefit so as to contribute to improved profitability. The results of previous studies conducted by Suyono (2005), Sudiyatno and Jati Suroso (2010) showed that CAR is positive and significant effect on ROA.
H1: CAR predicted positive effect on credit ROA.
2. Influence Of Loan to Deposit Ratio (LDR) to Profitability
certain limit, the more funds are channeled in the form of credit will increase interest income so that the higher the ROA. Desfian (2005) stated that in accordance with the theory that an increase in LDR due to an increase in lending or withdrawals by communities where this may affect the liquidity of banks to the level of public trust.
H2 : Rasio LDR is positively and significant effect on ROA.
3. Influence Of Operating Income Operating Costs Against (BOPO)
According by Suyono (2005) showed that the BOPO (Operating Income Operating Costs Against) variable is the variable most dominant and consistent in affecting ROA. Besides, BOPO is also a variable that is able to distinguish between banks that have above-average BOPO and BOPO of banks that have below average. In the management of bank's operating activities efficient by minimizing operational costs of banks would greatly affect the level of bank profits is reflected in ROA as an indicator that reflects the company's effectiveness in generating profits by utilizing the entire assets owned.
Mawardi (2005) argued that in line with the above two studies. Research results show that the greater comparison the total operating costs with operating income result in a decrease ROA. Thereby operating efficiency proxied by BOPO negatively affect bank performance proxied by the ROA. The hypothesis of this study on the effect of BOPO on the performance of the bank as measured by ROA is as follows:
H3: The ratio BOPO is negative effect on ROA.
4. Influence Of Non-Performing Loans (NPL) to Profitability.
NPL (Non-Performing Loans) is the ratio of total non-performing loans compared to total loans granted third party. Mawardi (2005), NPL is a proxy of the credit risk contained in the published financial statements. The Bank may conduct its operations properly if having NPL below 5%. Increase in NPLs of the higher causing reserves Allowance for Assets (PPAP) there is insufficient so that the credit crunch has to be taken into account as an expense (cost) that would directly affect bank profits and for profits or accumulated profits too exhausted, then it must be charged to capital ( Z. Dunil, 2005).
He said this happens because Bank Indonesia regulation regarding NPL provides that any increase in this loan is granted, it should be covered by reserve assets produktif by debiting cost of reserve assets and crediting the reserve account is uncollectible, so any increase in outstanding loans granted will increase the cost of reserves assets which ultimately affect the bank ROA. The hypothesis of this study on the effect of NPL on the performance of the bank as measured by ROA is as follows:
H4: The NPL ratio is negatively affect on ROA.
D. Research framework
Figure 2.1 Research framework
ROA CAR(+)
LDR (+)
E. Hypothesis
According to Hasan (2000) hypotheses is a statement that is still weak and needs to be proven true or conjecture that are still provisional. After specified then held testing hypotheses about the truth by using empirical data from research results. Based on the above framework, the author makes a hypothesis in this study are:
29
A. Subject and Object Research
The covered research area is the entire Yogyakarta province which consists of Bantul, Gunung kidul, Kulon progo, Sleman, Bantul and Yogyakarta. An object in this study is using the dependent variable profitability (ROA) whereas the independent variables used are CAR, LDR, BOPO and NPL.
B. Type and Source of Data
The type of data that is needed in this study includes secondary data. Secondary data is data obtained indirectly from the source, such as quotes from books, literature, scientific literature, journals and so on that have peculiar relevance to the theme research. Secondary data in this study is also obtained from a variety of required documents, sourced from Bank Indonesia and supported by the journal, or the previous studies and the relevant literature. This research is conducted in Yogyakarta which covers six districts items, namely from Bantul, Gunung kidul, Kulon progo, Sleman, Bantul, and Yogyakarta. This secondary data is in the form of time series and cross section.
1. Profitability (ROA) Rural Bank in entire Yogyakarta province includes Bantul, Gunung kidul, Kulon progo, Sleman, and Yogyakarta city 2012-2015.
2. CAR of Rural Bank in entire Yogyakarta province includes Bantul, Gunung kidul, Kulon progo, Sleman, and Yogyakarta city 2012-2015 3. LDR of Rural Bank in entire Yogyakarta province includes Bantul,
Gunung kidul, kulon progo, Sleman, and Yogyakarta city 2012-2015 4. BOPO of Rural Bank in entire Yogyakarta province includes Bantul,
Gunung kidul, Kulon progo, Sleman, and Yogyakarta city 2012-2015. 5. NPL of Rural Bank in entire Yogyakarta province includes Bantul,
Gunung kidul, KulonProgo, Sleman, and Yogyakarta city 2012-2015.
B. Population and Sample
Population is the subject of research. If someone wants to examine all elements within the study area, the research is the study population. The research subject covering all contained in the population (Arikunto, 2002).
The population of this research is the BPR in 5 regions in the province of Yogyakarta (Bantul, Gunung kidul, Kulon progo, Sleman and Yogyakarta), from the population, the researchers took data for the research sample that is from 2012 to 2015.
C. Data Collection Techniques
agency who published the data. The data is derived from Bank of Indonesia, as well as other literature sources associated with this research. The collected data are Development Profitability (ROA), CAR, LDR, BOPO and NPL in five districts in Yogyakarta province consisting of Bantul, Gunung kidul, Kulon progo, Sleman, and Yogyakarta.
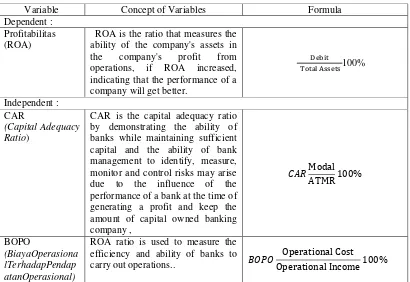
D. Definition Variable Operational Research
This study uses two variables: the dependent variable and independent variables. The dependent variable in this study is Rural Bank of profitability (ROA), whereas the independent variables are the CAR, LDR, BOPO and NPL. Here is an operational definition of each variable.
Table 3.1.
Variables Operational Definition
E. Analysis Methode
1. Panel Data Regression Model
To achieve the objectives of research and testing hypothesis, then in this research used multiple regression analysis to determine whether there is a significant effect of the independent variable to dependent variable or not. Data used in this research is panel data then, it used multiple linear regression panel data models which formulated as follows:
b(1….3) = Regression coefficient on each independent variable e = Error term are experiencing congestion in callable that occur because of intentional or external factors.
2. Metode Estimasi Model Regresi Panel
In the method of estimation models for the data panel can be done through two approaches that are fixed effect and random effect.
a. Common Effect Model
Panel data model approach is the simplest because it combines data time series and cross section. In this model neglected dimension of time as well as individuals, so it is assumed that the behavior of the data the same company in different periods. This method can use the approach Ordinary Least Square (OLS) or a least squares technique to estimate the panel data model.
Panel data model approach is the simplest because it combines data time series and cross section. In this model neglected dimension of time as well as individuals, so it is assumed that the behavior of the data the same company in different periods. This method can use the approach Ordinary Least Square (OLS) or a least squares technique to estimate the panel data model.
b. Fixed Effect
may occur due to differences in work culture, managerial, and intensive. However, the slop is same among the companies. This model is also called as Least Squares Dummy Variable technique (LSDV).
c. Random Effect
This model will estimate panel data where the disturbance variable may be related among the time and among the individual. In random effect model the intercept differences accommodate by error terms of each companies. The advantage using random effect model is to eliminate heteroscedasticity. This model is also called as Error Component Model (ECM) or Generalized Least Square technique (GLS).
3. The Selection of Estimation Method
In this research, data panel is the model to test whether independent variables influence the dependent variable. There are two approaches to estimate the regression model namely Fixed Effect Model and Random Effect Model. To select the best model, it is needed to do the specification test namely Chow Test and Hausman Test.
a. Uji Chow
Chow test is testing to determine the appropriate model among Fixed Effect or Random Effect that used to estimate Panel data. This testing is done with the hypothesis as follows:
H1 : Model Fixed Effect (Unrestricted)
From rejected to H0 is used F-statistic like this formula Where:
RSS = Restricted Residual Sum Square (Sum Square Residual is obtained from panel data estimation with pooled least square method / common intercept).
N = Number of cross section data T = number of time series data
K = The number of explanatory variables
This test follows the distribution of the F statistic is FN-1, NT-NK if the value of F-test or Chow Statistic (F statistic) test results greater than F-table, it is enough to reject the null hypothesis that the model to be used is the model fixed effect.
b. Uji Hausment
Hausman test aimed to compare the fixed effect method with random method effect. The result of this test is to determine which method should be selected. The hypotheses that used in this test are: H0: Random effects method
H1: Fixed effects method
If p-value > 0.05, then H0 accepted and H1 rejected
If p-value < 0.05, then H0 rejected and H1 accepted
To find out if the model is better than the Random Effect Effect Common method (OLS) test was used Lagrange Multiplier (LM). LM test is based on the distribution of Chi-Squares with degrees of freedom (df) equal to the number of independent variables. Nulnya hypothesis is that the right model for panel data regression is Common Effect, and the alternative hypothesis is the right model for panel data regression is Random Effect. If the value of LM count is greater than the critical value, the Chi-Squares null hypothesis is rejected, which means the right model for panel data regression model is Random Effect. And conversely, if the value of LM count is smaller than the critical value, the Chi-Squares null hypothesis is accepted which means the right model for panel data regression model is Common Effect.
4. Mechanical Estimating Model
To test the effect estimation CAR, LDR, BOPO to ROA Yogyakarta area used tool panel data regression model. There are two approaches used in mengalisis panel data. Approach Fixed Effects and the Random Effect. Before the estimation model with an appropriate model, first tested the specification whether the Fixed Effects and the Random Effect or both give the same result.
Featuring a translation for GLS method (Generated Least Square) selected in this study because of the value that is owned by GLS than OLS in estimating the regression parameters. Gujarati (2003) mentions that the OLS common method assumes that the variable variance is heterogeneous, in fact variations on pooling the data tend to be heterogeneous. GLS method already take into account the heterogeneity contained in the independent variables explicitly that the method is able to produce an estimator which meet the criteria BLUE (Best Linear Unbiased Estimator).
Unbiased Estimator).GLS (Generated Least Square) selected in this study because of the value that is owned by GLS than GLS in estimating the regression parameters. GLS method already take into account the heterogeneity contained in the independent variables explicitly that the method is able to produce an estimator which meet the criteria BLUE (Best Linear Unbiased Estimator).
From some of the variables used in this study, it can be made a model research which is then transformed into the equation,
namely:Yit =β0+β1X1it+ β2X2it +β3X3it +β4X3it ε
Information :
Yit = ROA
β0 = Konstanta
β123 = Koefisien variabel 1,2,3,4
X1 = Car X2 = Ldr X3 = Bopo X4 = Npl
i = Regency / City t = Period Waktu ke-t ε = Error Ter
5. Quality Test Data
Multikolinearitas is a state where the independent variables in a multiple regression model found a correlation (correlation) between one another. Multicolinearity test aims to test whether the regression found the correlation. In the event of multikolinearitas, the regression coefficients of the independent variables will not be significant and have a high standard error. One way to detect their multikolinieritas namely:
R2 is quite high (0.7 to 0.1), but the t-test for each of its regression coefficient R2 signifikan.Tingginya not a sufficient condition (sufficent) but not a necessary condition (Necessary) for the multikolinearitas, because on the lower R2 <0.5 can also occur multikolineraritas.
• Regressing independent variable X with the independent
variables to another, then in his R2 calculated by F test;
• If F* > F table means H0 is rejected, there multikolinearitas • If F*< F table means H0 is accepted, there is no
multicollinearity.
GLS method, this model has been anticipated from multikolienaritas.Uji Heteroskedastisitas
Heteroskidastity is detection to see whether a variable is not constant interruption or change. Heteroskedastisitas test aims to test whether the regression model occurred inequality residual variance from one observation to another observation. If the variance of the residuals of the observations to other observations remain, then called Homoskedastisitas and if the variance is not constant or variable is called Heteroskidastity.
A good regression model is that homoskedastisitas or did not happen heteroskedastisitas. To detect the problem of heteroscedasticity in the model, the authors use the park test is often used in reference. In the method, Park suggests a specific function between the variant form of the error and the independent variables were expressed as follows:
= ………. (1)
linear equations
Ln = α + β Ln Xi + vi ………..(2)
Because the error variance () was not observed, it is used as a replacement. So the equation becomes:
Ln = α + β Ln Xi + vi ………...(3)
If the parameter β coefficients of the regression equation is
heteroscedasticity. Conversely, if β is not significant, then the
assumption homokedastisitas the data can be received. (Park in Sumodiningrat, 2010).
• Significant correlations> 0.05 means free from
heterokedastisitas.
• Significant correlations <0.05 means exposed
heterokedastisitas
6. Test Statistic Regression Analysis
Significance test is a procedure used to examine errors or correctness of the results of the null hypothesis of the sample.
a. Test Coefficient of Determination (R-Square)
when evaluating the best regression model. Unlike the value of R2, adjusted R2 value can rise can be dropped if the independent variables are added in the model. This test is essentially the measure of how far the ability of the model to explain variations in the independent variables.
A model has goodness and weakness when applied to different problems. To measure the goodness of a model (goodnes of fit) used the coefficient of determination (R2). The coefficient of determination is a measure of the great contribution of the independent variable on the dependent variable, or in other words the variation coefficient of determination shows the decline in Y explained by the influence of linear X.
Determinant coefficient value between 0 and 1. The determinant coefficient value close to 0 (zero) means the ability of all the independent variables in explaining the dependent variable is very limited. Determinant coefficient value close to 1 (one) means the independent variables described nearly giving information to predict what the variation of the dependent variable.
b. The F-statistics
1) H0: b1: b2: b3 = 0, meaning that together there is no independent effect on the dependent variable.
2) H0: b1: b2: b3 ≠ 0, meaning that together there is the influence of the independent variable on the dependent variable.
This test was conducted to compare the value of the count the F-table. If the F-count is greater than F-table then H0 is rejected, which means that the independent variables jointly affect the dependent variable.
If the probability of independent variables> 0.05 then H0 accepted, meaning that the independent variables simultaneously (together) do not significantly affect the dependent variable.
If the probability of independent variables <0.05 then H0 is rejected, meaning that the independent variables simultaneously (together) influence on the dependent variable.
c. T-statistics (Partial Test)
T statistical test is basically to show how far the influence of the independent variables individually in explaining the variation of the dependent variable with the following hypotheses (Imam Ghozali in Bethany, 2014). This test can be done by comparing t arithmetic with t table.
As for the formula to get the t is as follows: t = (bi - b) / SBI
bi = coefficients of the independent variables to-i b = the value of the null hypothesis
Sbi = standard deviation of the independent variable to-i At the 5% significance level with the testing criteria are used as follows:
1) If t <t table then H0 is accepted and H1 rejected which means that one of the independent variables (independent) does not affect the dependent variable (dependent) significantly.
45
A. General Overview of Research Object
Yogyakarta Province is located in south-central Java Island bordered by the Indian Ocean in the south and Central Java Province in the other sections. Boundaries with the Province of Central Java include:
- Wonogiri district in the southeastern part
- Klaten district in the northeast
- Magelang District in northwest
- Purworejo regency in the west
Figure 4.1
Administrative Map of Central Java
ranging between 150-700 meters, Unit Merapi Volcano with altitude ranging between 80-2911 meters, Unit Plains low that stretches between the Southern Alps and Kulonprogro Mountains at a height of 0-80 meters, and Kulonprogro Mountains with an altitude of up to 572 meters.
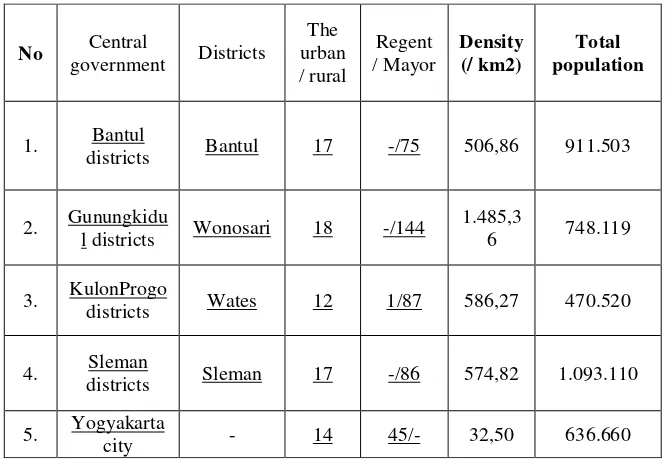
Tabel 4.1.
Yogyakarta Special Region consists of 4 districts and 1 city. Its capital is Yogyakarta. Here is a list of countries and cities in Yogyakarta,
along with the district capital.
Investments in DIY implemented through increased promotion and investment cooperation as well as the investment climate improvement programs, and actual investments. The achievement of total investment in 2010 reached Rp 4580972827244.00 with details of domestic investment of Rp 1884925869797.00, and FDI by 2696046957447.00. DIY business unit in 2010 there were about 78 122 units with employment of 292 625 people, and the investment value of Rp. 878,063,496,000.00. Varian DIY mainstay export products include processed leather products, textiles, and wood. Apparel
textiles and wooden furniture is a product that has the highest export value. But in general the export to foreign countries is dominated by products that are produced with artistic, creative and high labor intensive (labor intensive). The construction program to develop cooperatives and SMEs in the province, one of which is to empower micro, and small and medium synergized with the program policies of the central government. One effort is the development of SMEs through the groups (centers) because these efforts are more effective and efficient, in addition to centers will involve micro, and small. In 2010 as many as 1,926 active cooperatives registered cooperatives and SMEs registered 13 998 business units. The number of SMEs supported by the RB to help the public in developing a business.
bank performance in managing and using its assets to generate profit by taking a sample of the overall Conventional BPR in Bantul, Gunung kidul, Kulon progo , Sleman and Yogyakarta.
This study analyzes the effect of CAR, LDR, BOPO, NPL to Profitability f BPR in regencies in Yogyakarta which covers Bantul, Gunung kidul, Kulon progo, Sleman, and Yogyakarta during 2012-2015. Tool analysis used in this study is by the panel data analysis model of Fixed Effect and completed through computer statistics program, namely Eviews7.0. Furthermore, the results of the processing of the data presented in this chapter are considered the best estimate of the results because it can meet the criteria of economic theory, statistics and econometrics. The result of this estimation is expected to answer the hypothesis proposed in this study which is based on panel data regression model consisting of two approaches, that is the Fixed Effect model and Random Effect models.
B. Data Quality Test
Test of the data quality this study is using classic assumption test. Classical assumptions used in this research are Heteroscedasticity and Multicollinearity.
1. Heteroscedasticity Test
cross-sectional that includes heterogeneous units, Heteroscedasticity may be a custom (rules) of the exclusion (Gujarati, 2006).
Heteroscedasticity test aims to test whether in the regression model occurred inequality residual variance from one observation to another observation. A good regression model is that homoscedasticity or absent of heteroscedasticity. Heteroscedasticity symptoms are more common in cross section (Ghozali, 2005: 28).
Based on the Park Test, the probability value of all the independent variables are not significant at the level of 5 percent. This situation shows that the presence of the same variant or occurrence of homoscedasticity between the values of the independent variables with the residuals of each variable itself (VarUi = σ_u ^ 2). Here is the output of Heteroscedasticity
test results using the Park Test:
Table 4.2.
X3 = NPL
From the above table, it can be concluded that all the data used as independent variables are free from Heteroscidasticity as known on the outcome of the probability that all independent variables used in this case is the CAR, LDR, BOPO, and NPL greater than 5%, α = 0:05.
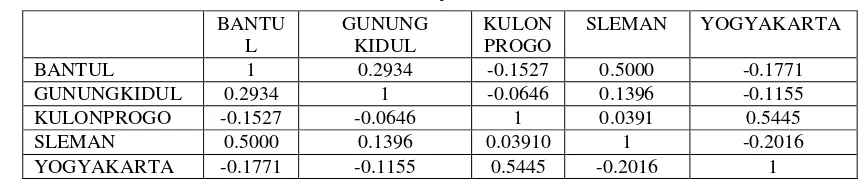
2. Multicollinearity Test
In a test of classic assumption deviation, to approach multicollinearity is applied with an approach over �2 value and significance of the variables used. The elaboration is by analyzing the data used by every variable and resulted of the existing data. The data used include data time series and cross section. However multicollinearity occurs usually on time series data (time series) on the used variables. Rule of Thumb also said that if the high R2 obtained while there is a majority or all of partially insignificant variables, multicollinearity then allegedly occurred on that model (Gujarati, 2006).
Source: Modified data, 2016 (Appendix 3)
Based on Table 5.2, testing method partial correlation between above districts shows there are no multicollinearity problems in the model. That' is due to the value of the correlation matrix (matrix correlation) is less than 0.9.
C. Selection Model
In the estimation method regression model using panel data can be performed through three approaches, among others Common Effect Model by using the approach of Ordinary Least Square (OLS) or the technique of least squares, Fixed Effect Model that often called the technique of Least Squares Dummy Variable (lSDV) and Random Effect model is also called the Error Component Model (ECM) or technique Generalized Least Squares (GLS).
Testing can be done in the first time to choose a model that will be used in managing data panel that is Chow Test, which is a test to determine the model of Fixed Effect or Common Effect most appropriately used in estimating panel data. The results of the statistical test are as follows:
1. Chow test
In testing Chow Test, panel data is estimated using fixed effects specification. This test aims to determine whether to use a fixed effect models or common effect.
If the result of chi-square probability is less than 5% alpha then Ho is rejected, so the model uses a fixed effect. The results of the estimation using fixed effects specifications are as follows:
Table 4.4.
Chow Test (Test Likelihood)
Effects Test Statistic d.f. Prob. Cross-section F 20.737426 (4,176) 0.0000 Cross-section Chi-square 71.437724 4 0.0000
Source: Data processing results panel using the program Eviews 7 (Appendix 4).
According to the above Chow Test table, both probability values of Cross Section F and Chi Square is 0.0000 lesser than Alpha 0.05 to reject
the null hypothesis. According to the Chow test, the best model used is fixed effect. Based on the results of the chow test, then the data test continues to Hausman Test.
2. Hausman test
Hausman test is aimed to find out whether the Random Effect Model (REM) is better than Fixed Effect Model (FEM).
H0: Random effect H1: Fixed effect
If the probability of Chi-square is bigger than alpha of 5%, then model is preferably using Random Effect. The results of estimation using random effects specifications are as follow:
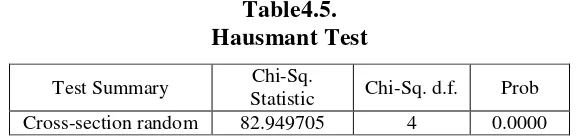
Table4.5. Hausmant Test
Source: Data processing results panel using the program Eviews 7 (Appendix 5).
Test Summary Chi-Sq.
According to the table, the probability values is 0.0000 smaller than Alpha 0.05 to accept the hypothesis one. So, based on Hausman test, the best model used is the model by using the Fixed Method Effect.
B. Analysis of Panel Data Model
Selection of this model is using the best analytical test and more fully described in the following table.
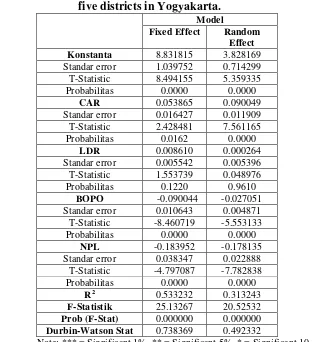
Table 4.6.
Results Estimates CAR,’LDR, BOPO, NPL on profitability (ROA) to RB’s in
five districts in Yogyakarta. Standar error 1.039752 0.714299 T-Statistic 8.494155 5.359335 Probabilitas 0.0000 0.0000
CAR 0.053865 0.090049 Standar error 0.016427 0.011909 T-Statistic 2.428481 7.561165 Probabilitas 0.0162 0.0000
LDR 0.008610 0.000264 Standar error 0.005542 0.005396 T-Statistic 1.553739 0.048976 Probabilitas 0.1220 0.9610
BOPO -0.090044 -0.027051 Standar error 0.010643 0.004871 T-Statistic -8.460719 -5.553133 Probabilitas 0.0000 0.0000
NPL -0.183952 -0.178135 Standar error 0.038347 0.022888 T-Statistic -4.797087 -7.782838 Probabilitas 0.0000 0.0000
R2 0.533232 0.313243
F-Statistik 25.13267 20.52532
Prob (F-Stat) 0.000000 0.000000
Durbin-Watson Stat 0.738369 0.492332
Note: *** = Significant 1%, ** = Significant 5%, * = Significant 10 Source: Data processing results panel using the program Eviews 7.
different model. When tested by test Chow Test (Likelihood Test) model suggested to use Fixed Effect and when tested using the Hausman test model suggested to use fixed effect models.
In terms of probability and its R-square as well as comparison of the best election, then the regression model used in estimating Effect of CAR, LDR, BOPO to ROA in the district in Yogyakarta, is the Fixed Effects Model. Fixed Effect Model was chosen because it has a probability of each independent variable on the Fixed Effect model which is more significant than the Random Effect Model or Common Effect Model. Reasons for the selection of fixed models can also be seen from the coefficient of determination, how free variables would affect the dependent variable. The coefficient of determination (R-square) owned from the results of fixed model estimation by 0.53 which is bigger than the second other estimation models.
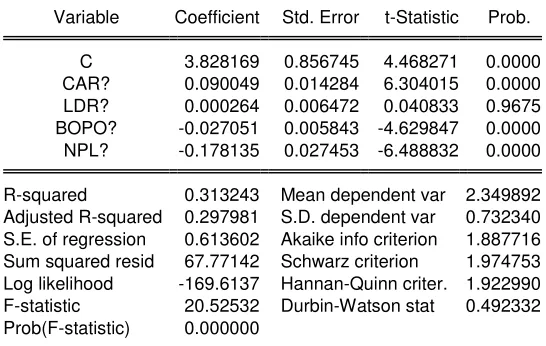
E. Estimation Results of Panel Regression Model
Table 4.7. Source: Data processed, 2016 (Appendix 6)
From the estimation above, it can be made model of panel data analysis of the factors affecting the profitability of the BPR in regency in Yogyakarta, which concluded with the following equation:
X2 = LDR
The results of the above estimation, panel data model can be made on the profitability of the Rural Bank between districts in Yogyakarta, which is interpreted as follows:
ROA_BANTUL =
0.655931113465 + 8.83181542971 + 0.0538647596137*CAR_BANTUL + 0.00861018337406*LDR_BANTUL 0.0900444924775*BOPO_BANTUL
-0.726956732052 + 8.83181542971 + 0.0538647596137*CAR_SLEMAN + 0.00861018337406*LDR_SLEMAN-0.0900444924775*BOPO_SLEMAN - 0.183951893521*NPL_SLEMAN
ROA_YOGYAKARTA =
0.00861018337406*LDR_YOGYAKARTA - 0.0900444924775*BOPO_YOGYAKARTA - 0.183951893521*NPL_YOGYAKARTA Information:
Y = ROA (profitability) X1 = CAR
X2 = LDR X2 = BOPO X3 = NPL
1. Bantul shows the coefficient value of 0.6559 where the value c at 8.8318. Thus, when the Car, LDR, ROA, NPLs were excluded from the model, then the profitability (ROA) grew by 0.6559%.
2. Gunung kidul shows the coefficient value of -1.1023 in which the value of c at 8.8318. Thus, when the Car, LDR, ROA, NPLs were excluded from the model, then the profitability (ROA) grew by -1.1023%.
3. Kulon progo shows the coefficient value of -0.0241 in which the value of c at 8.8318. Thus, when the Car, LDR, ROA, NPLs were excluded from the model, then the profitability (ROA) grew by -1.1023%.
5. Yogyakarta indicates the coefficient value of -0.2564 in which the value of c at 8.8318. Thus, when the Car, LDR, ROA, NPLs were excluded from the model, then the profitability (ROA) grew by -0.2564%.
by the independent variables in the equation of 84.1% and the remaining 15.9% is explained by other factors outside the equation. If seen visit of the F-test, the overall effect caused by the independent variable (free) to the
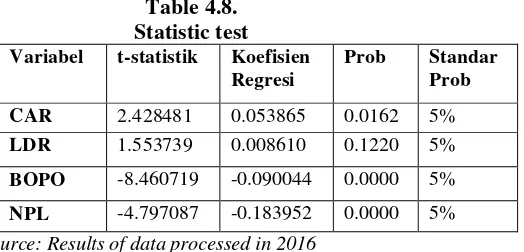
To determine whether the independent variables (CAR, LDR,BOPO and NPL) have a relationship to ROA, it is necessary to test using statistical tests which include:
a. CAR influence on ROA