RELOCATION OF HOME APPLIANCES FACTORY BY
USING SYSTEMATICAL LAYOUT PLANNING (SLP)
COMBINED WITH FLOW ANALYSIS AND ASSEMBLY
PROCESS DESIGN
Yosef Adji Baskoro1, Prianggada Indra Tanaya2, and Tanika D. Sofianti3
Abstract: Every manufacturing company must have experiencing building a layout. Fred.E Meyers has stated that only death and taxes are certain, there exist a third certainty-a plant layout will change, thus many methods to generate layout are established and each has its own purposes and benefits. This research focused on the design of manufacturing facilities supported by in-depth analysis of Assembly process design with a high stresses on the Systematical Layout Planning ( SLP) and Flow Analysis method to facilitate an outcome of layout accordingly to the system needs. This is a real case study conducts with an objective of generating a recommendation layout for Home Appliances Company specifically for television plant
.
Keyword: Systematical Layout Planning, Assembly Process Design, Flow Analysis, Three Dimensional Layout.
Introduction
Industrial businesses have becoming more and more competitive overtime. The competition is getting fierce than ever. The effort to generate profit ultimately for the most companies are getting shift after many decisions of agreements to enter a new age of global trade market such as ACFTA ( Asian-Chinese Free Trade Agreement) has come to existence and put pressures greater than ever. Thus, companies could not run their manufacturing business as they used to be because a small difference in cost, time, and/or quality could determine the death and the existence of a company. The search of an optimal system has come down to the smallest detail possible. This has brought a layout generation into a new tool to enhance the efficiency, effectiveness, and productivity of a system. It is also act as an entry point of judging whether a company runs a first-class manufacturing facilities or a conventional full of waste system.
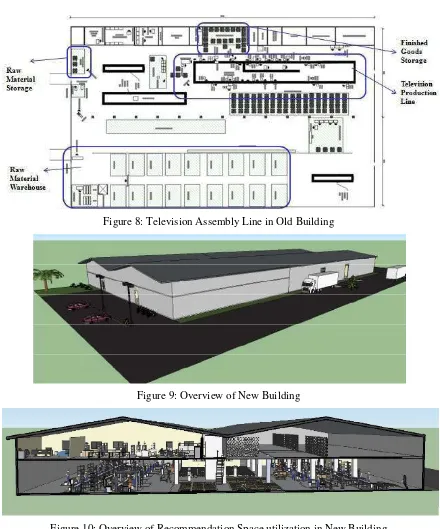
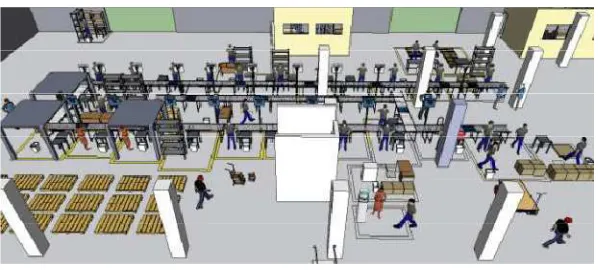
Company X is a recognized appliances manufacturer in Indonesia. Its core business has run for several decades and throughout its journey, expansions have been made. As the business growth into a bigger one, there is a need to make the full advantages of potential capability (in term of space, material handling and workforce) and minimize waste to raise revenue and decrease cost. As we could see in Figure 8 Company X operates its manufacturing plant with somewhat conventional system. The arrangement of machines and the utilization of space are inefficient and consequently it happens to be lots of unused spaces and improper used spaces. Additionally, the placement of material, supporting facilities and departments needs to be assessing thoroughly. Nonetheless, there
1
Faculty of Engineering, Department of INDUSTRIAL ENGINEERING, SWISS GERMAN UNIVERSITY, Campus EduTown BSD City, Tangerang, 15339, Indonesia
Email: [email protected] 2
Faculty of Engineering, Department of INDUSTRIAL ENGINEERING, SWISS GERMAN UNIVERSITY, Campus EduTown BSD City, Tangerang, 15339, Indonesia
3
Faculty of Engineering, Department of INDUSTRIAL ENGINEERING, SWISS GERMAN UNIVERSITY, Campus EduTown BSD City, Tangerang, 15339, Indonesia
is an enormous prospective of using the space more efficiently and likely to be more firefighting culture followed by uncontrollable efficiency and effective tragedy due to unplanned system. By performing planning prior to implementation, one could predict the situations, set the measures and determined the amount of effort to produce desire system. Thus, planning a layout is incredibly important regarding an enormous impact it added to the operational and constitutional to the success of a company. It contribute to the profit of a company by outstandingly provide a base for another operational constraints.
Among various reasons of generating a layout, the most obvious reasons often rooted from the decisions of launching new product, expansion of a company’s business, design changes, and cost reduction movement. Each of those has resulted in a layout changes and there are still other intentions that required a reassessment, modification or generation of a new layout.
Qualitative VS Quantitative Methods
Many researchers had proposed developing a layout using algorithm. Most of the literature deals with issues such as mathematical algorithm to generate a layout. Some of them also rely heavily on the qualitative data such as survey and interview.
A research has proven that the solution of the plant layout problem with the performances of selected human subjects using the manual and visual methods still used and recommended by industrial engineers for plant layout design. The statement comes after the output of their research which showed not only that the computer algorithms do not perform better than selected human subjects in the design of plant layouts, but that the human subjects, without the benefit of any prescriptive help from a computer, actually achieve layouts which are stochastically better than those produced by the computer programs. (Scriabin & Vergin, 1975)
This paper will discuss an integrated approach into designing a new manufacturing facility in new building as in figure 12 while relocating television assembly line from old building in figure 8 and optimizing it. It aims to facilitate facilities design teams with a combination of both qualitative and quantitative analysis of a layout. The Systematical Layout Planning (SLP) method which stresses on generating a layout based on the needs of the users will be combined with the Flow Analysis and Assembly Process Design to enhance the quantitative examination of the system.
SLP and Flow Analysis Combined with Assembly Process Design: Mapping The System Behavior
Contemplate to the success of the best practitioners in the world of manufacturing, the Japanese concept of gemba will be stand out and adopted in this research. Gemba (現場 gemba) is a Japanese term meaning "the actual place" or "the real place." (imai, 1997). The gemba walk, much like MBWA or Management by Walking Around, is an activity that takes management to the front lines to look for waste and opportunities to practice gemba kaizen, or practical shop floor improvement. Thus, by generating Flow Analysis through a direct observation in the shop floor, the opportunities to map the system as “it is” and the waste finding will be enhance and will be a remarkable input to the section of relations among areas in SLP.
The Assembly Process design, on the other hand will also be an enormous benefits contributed to the Layout. While Assembly Process Design is not classified into a method to develop a layout, but rather to design a process, the involvement of Assembly Process Design will promote a higher generation of solution in terms of producing a more profit-oriented layout.
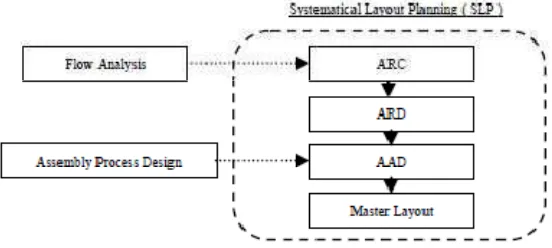
Figure 1. Flow of Methodology Combination
As shown in figure 1, Systematical Layout Planning (SLP) comprises a series of analysis starting from the development of ARC (Activity Relationship Chart), ARC worksheet, Activity Relationship Diagram (ARD), ARD worksheet, Area Allocation worksheet, Area Allocation Diagram (AAD), and then brings to a close with Master Layout Drafting.
In the development of SLP, the quantitative examination of system behavior is performed by conducting Flow Analysis that is integrated into the ARC. Thus, the ARC consist not only Interviews of the labor and staffs for qualitative analysis but also observations and interviews for data gathering in the shop floor which produce Flow Analysis as an end result of quantitative analysis. Thus, Quantitative analysis will enhance the capability of SLP in mapping and analyzing the system.
The Flow Analysis entails observations and interviews of data gathering to be accomplished. The observation will capture the system behavior and represented it in terms of its flow. It obtains the flow of materials and information for the whole shop floor. Additionally, the interview will act to strengthen the analysis by introducing a set of numbers that represent the distance, loading of lorry, day-to-day capacity of raw material, capacity of finished goods storage, etc.
Research Methodology & Analysis
This research consists of three different sections of method namely Flow Analysis, Assembly Process Design, and Systematical Layout Planning. Each of these methods has unique work procedure that has to be undergone.
Flow Analysis
The flow is analyzed by observing the material flow in the shop floor and conduct data gathering through collecting accessible data from the company and interviewing labor and staffs.
The Data to be collected are the data available and accessible concerning the purpose of this research. Those are data about Organization Structure and Product Structure. In addition, the data gathered through interviews are the data about material handling specifications, usual flow patterns and other data related with the flow.
In addition, Field Observation has also conducted for the purpose of matching data that has already collected through interview and from the company. The field observation has also useful for identifying deviation from given information from interview and obsolete data from the company. The combination of the information will enhance the accuracy of data used.
In analyzing the flow, total plant flow diagram is use to trace the route of each raw material from raw material warehouse, production, until finished goods warehouse. The plant flow diagram has also given a benefit to identify, analyze, and improve the layout whenever back traffic is spotted. With total plant flow diagram, the cross-traffic can also be reduced to improve the layout.
To analyze the flow, the data of production cannot be neglected because of its vital relation to the flow of material. For instance a material with low volume and high volume will need a different kind of flow in the layout. Thus, the capacity of material required for raw material warehouse, raw material storage, finished goods warehouse, and finished goods storage are calculated to help designing a good flow.
Assembly Process Design
Due to unavailability of the data, experiments are performed by demonstrating time study, making operation process chart, and dimension measurement of several areas.
First of all, after getting the sketch of the product and doing some observation, Product Structure for Television 21” is created. It elaborates how the television could be assembled into a finished product. The old assembly line can be found in figure 13.
Then, the Operation Process Chart is created in order to obtain an overview of how the production of television is works. The Operation Process Chart able to show where the inspections are located in the line, and where the subassembly stations are placed.
The next step is to conduct a time study. It is performed on the assembly line to get the quantitative behavior of the assembly line. The time study is performed to get an estimation of standard time. A series of statistical test is conducted to assure that the time collected is qualified to be used in analysis. The test such as normality test, uniformity test, and adequacy test are performed on the data.
After the data is proven to be qualified, the Westinghouse rating and allowances are applied to account for the performance of the worker working in the assembly line. Finally, the estimated time standard is obtained and can be use for further analysis.
By using the information on effective working time and the prediction demand from expert opinion of 500 products per day, the lead time can be derived.
Using that information, assembly line balancing using precedence graph method is applied. The result was stunning because referring to the observation and analysis, there is a deviation between ideal values from calculation with the actual facts.
From the observation, it is acquired that the stages in assembly line is 22 stages, however, the analysis outcome suggest using 30 stages for the current performance of the line. This phenomenon initiate a further analysis on the effect of having less stage (22 stages) while according to the ideal situation it should has 30 stages.
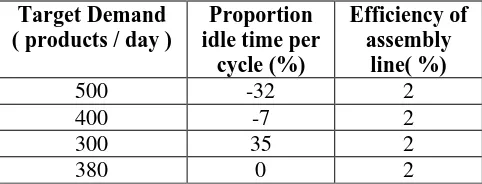
As the further observation is conducted, several works in process are founded in the line. Then, excel simulation on the line is performed to get the status of the line. The result shown that the efficiency of the line is 2% and proportion of idle time per cycle is -32% or in the other words many of the stations are too busy. This is exactly the reason why the WIP are all over the placed at the observation.
The analysis is carry on by changing the normal amount of production target of 500 products per day into 400, 300, and 380 products per day to accommodate a clear and understandable performance of the line. After running simulations and analysis by using graphic, it turns out that the optimal value for the production line performance is 380 are over allocated. While on the contrary, in the target demand of 300, it shows that many stages experiencing many idle times in many stages. It can be translated that many people in the shop floor is not productive for a long time with also a fairly low production each day. The analysis indicate that for the line with the current performance and using 22 stages in its operations the target demand that will match the line performance is 380 products per day. Therefore, the target demand used in this research is 380 products per day which will be more fitted to the performance of the line with 22 stages.
After the assembly line behavior has been analyzed, the workstation is design by starting with measuring every furniture and tools use in the workspace for the whole assembly line. Then, the workspace is design by adding space for worker and the allowance for travel and movement. As can be seen in figure 14, the workspace design creates a more organized assembly line with yellow line to separate each working area and buffer places. Moreover, this has also significantly improved the space requirement from 536 square meters to 380 square meters.
Systematical Layout Planning
First of all, the essential and a very important part of SLP is the Area Relationship Chart (ARC). The Area Relationship Chart is the base for Systematical Layout Planning. As the observation is performed, the Area Relationship Chart is filled out with the designated symbol associated with the level of closeness. The informal interview to the user is conducted to assure the reliability of observation data and vice versa. The flow analysis is also considered in determining the symbol to enhance the quantitative analysis.
Then, the chart is being transformed into a worksheet to facilitate a more concise view into the ARC. After the chart has already been translated into a worksheet, the dimensionless block diagram is prepared. The block shows the name of each department in the center and the relationship code at the top and bottom side. At the bottom of each relationship code written the number related to the areas. For example for Raw Material Storage, the relationship code E is written at the top right side with the respected number of 4, I is written at the bottom left side with respected number of 9 and 5 and soon.
This dimensionless block diagram is then arranges manually to find the optimal location of each box represented each department in a plant. The searching for an optimal position following rules of placing areas in accordance to the relationship code. This allows the search for an optimum location for areas without bothering on the dimension of the areas. The optimal position in DBT acts as a guide to draft the master layout and subject to changes when applied to the real layout. The arrangement of the optimal position is called Area Relationship Diagram.
There will be several optimal arrangements for 1st (first) floor area relationship. Warehouse of the back of the building of the 1st (first) floor and the 2nd (second) floor. The decision of choosing which arrangement is the best is come from the analysis of flow diagram of the blocks and matching with the actual layout. First of all, the relationship is important to produce optimal arrangement. However, The flow diagram will filtered among several best selection before the matching will the real layout will do the second filter for the best layout. Thus, it enhances the search for optimal location of an area.
As soon as the area relationship has been established, it is required to measure each areas in order to get the dimension of each areas and incorporate it into the analysis of areas. The area calculation for Office and Plant Service begin with the Organization chart to help defining worker, office employee, and plant service employee. The production line supervisor is derived from the number of production line workers from operation divided by the assumption number of 15 (supervisor’s span of control).
The Area Planning for Office and Plant Service begin by measuring the building dimension designated by the company to be allocated to be the Office and Plant Service Area. Then, after all the furniture inside each room is measure manually using tape measurement in order to get the dimension of each furniture. Using the table, the allowance for travel and utilization is incorporate into the calculation. Thus the total area is established.
Table 2. List of Office and Plant Service Area Planning Office
Area Planning Plant Service Area Planning Supervisor room Maintenance shop & tools
R&D room Worker’s eating room Engineering room Toilet & pantry Quality Control room Signal room Production Manager room Trash area
from the Assembly Line Process Design can be directly integrated as production line area planning.
Besides of relocating and designing office area, plant service area and production line area, the area of warehouse are also taken into account. The raw material warehouse and finished goods warehouse will be relocate base on the required space on the old building with the assumption that the operations inside the warehouse are already well-operated.
After all area requirement and the relationships has been established, the analysis continue to area allocation in which the technique of placing the areas with respected dimension to the real layout and use the relationship as a guide to generate the layout. Prior to developing Area Allocation Diagram, an Area Allocation Worksheet has to be complete to facilitate the Area Allocation Diagram. The Area Allocation Diagram is similar with Area Relationship Diagram but with additional dimensions.
Area Allocation Worksheet transforms a real area into flexible blocks of areas which can be conveniently arrange in relations to the Area Relationship Diagram. The Area Relationship worksheet transform an area from its actual square meter into a block. Then with the scale of 1 : 300, the area of 3m x 3m is transformed and become an area of 1 cm x 1 cm or on the other words an area of 9 m2 is transformed into an area of 1 cm2. For
example, for Assembly & P.O., the actual dimension is 380m2. Then the block is
transform from an actual area for Assembly & Packout area should has 49 blocks.
This kind of calculation is applied into all the areas. Then to check if the building is sufficient to hold all the areas the areas are adding up and compared to the building dimension. The building dimension is 567 blocks whereas the total areas is 449, the conclusion is the areas are all fitted into the building.
After the blocks have been established, the blocks are then be arrange and input into a scale of layout with actual dimension and shape of a building. The placement of each areas represented by blocks are following Area Relationship Diagram as a guide. The area transform into blocks of 1 cm x 1 cm, therefore it is possible for a production line area contain 49 boxes of blocks to be allocated in the layout separately. For example 20 boxes of green area in the right side and the rest blocks of 29 is located in the left side of the layout. It provides flexibility in allocating the boxes in the layout. The final diagram provides information of each box by the color, the name of each areas, and the information about the dimension of each areas.
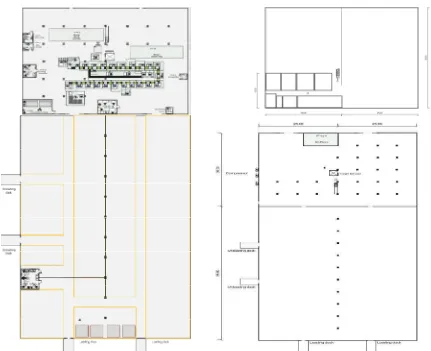
Once the Area Allocation Diagram has been established, real furniture and other tools or machines can then be inserted into the layout in master plan that can be seen in figure 11 and figure 15. In drafting the master plan, The Area Allocation Diagram is the guide for the drafting.
The master plan is drafted by dividing it into 3 categories of areas. The first category is the front-side of the 1st (first) floor, the second category is the Warehouse of the back of the building of the 1st (first) floor and the last category is the 2nd ( Second)
floor.
Layout Optimization by Duplicating Production Line
An Extension Case
As the research go along the development of a new layout for a new building, it shows a room for further improvement because the production line, offices, and other rooms in the production area are not fully occupying the space. When the space is not fully occupied or many space is still unused, the layout is consider as unproductive and full of many non-value added area.
In the relocation of the television production line, the main focus is the production line because this area contributed or adding a direct value to the system. The profit can be gain by minimizing the space allocation for the production line as previously done by employing a redesign of assembly process operation.
However, the reduction of space allocation is meaningless without a certain benefit associated with the space reduction. Therefore, a search for the best allocation of space in the new layout by using duplication of the production line before the reduction of spaces (production line optimization) and for the new design of production line is performed. it entails the search of a maximum space utilization of the new building that generated a maximum of both profit and also productivity and efficiency.
Thus, a case study is undertake to assess the maximum capability of the building to operated within the case when the assembly line is duplicated into 2 and 3. By duplicating the assembly line, the supporting facilities and offices are grown larger due to the rising requirement of labor and then quality workers, and soon.
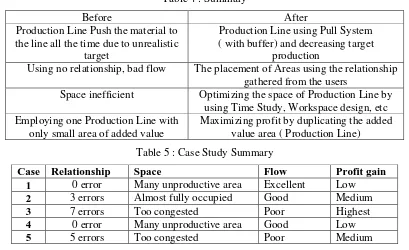
There are 5 case study to be compared with which each of them has benefits and drawbacks. Case 1 is 1 ( One) Production Line after optimization, case 2 is 2 ( Two) Production Line after optimization, case 3 is 3 ( Three) Production Line after optimization, case 4 is 1 ( One) Production Line before optimization, case 5 is 2 ( Two) Production Line before optimization.
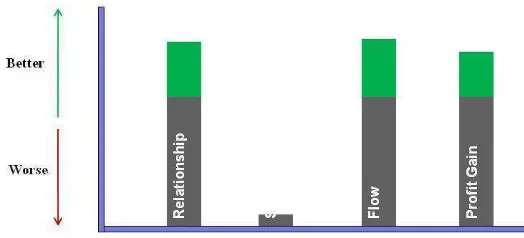
The case study will be using 4 kinds of measurement to compare the result of each case. The measurement are relationship, space, flow, and profit gain. The relationship is measured by looking at the Area Relationship Diagram. Then, the relationship error is counted and the less error the case has, the better is the relationship for the particular case. The space is another measurement which determined by looking at the final master layout. In the case that the space of the layout is fully occupied is the desired states for a better layout. However, the congested layout or layout with many of unused space will considered as bad. The flow is a measurement which is coming from the Flow Analysis, and once the flow analysis has been conducted the flow will be better. The last measurement is profit gain. The reason of this measurement is to show the amount of assembly line area that can be fitted into the layout. The more assembly line area could be fitted, the more products can be produced and the higher profit the factory could gain.
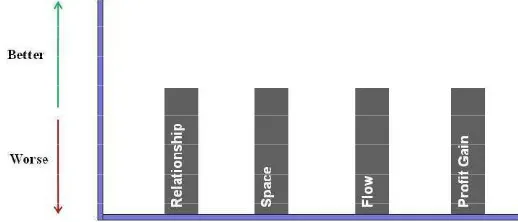
Figure 2 illustrates the condition before a relocation and optimization of Television production begin. It shows the four measurement of relationship, space, flow and profit gain at a normal and steady position. By the time the layout is optimized, the measurements could fluctuate depeding on the case.
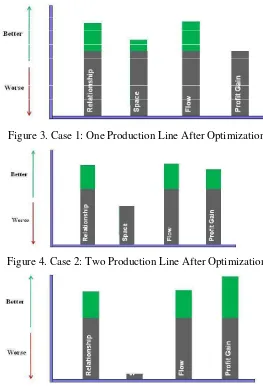
Then, the figure 3 below displays the outcome of case 1 which optimized the production line after the relocation. Thus, it is obvious that the space is getting better as shown in the graph as more space is eligible for the use of other activity.
After optimizing the line, the production line is being duplicated into two. The result graphically shows that the space is getting worse due to the duplication. In spite of this, the Profit gain is increase dramatically by duplicating the line.
The figure 5 illustrates a phenomenon when the television production line is being duplicated into three. The graph draw a conclusion that when the line is duplication into three production line, the profit gain is the highest. Neverthless, the space is getting so much worse. In the master layout, some of the areas couldn’t even fit into the layout. However, this layout could still be operated with many modifications to accomodate for some areas which cannot be fitted.
Figure 3. Case 1: One Production Line After Optimization
Figure 4. Case 2: Two Production Line After Optimization
Figure 5. Case 3: Three Production Line After Optimization
relocated even though the optimization of production line and the duplication haven’t been actually commence.
Figure 6. Case 4 : one production line before optimization
Figure 7. Case 5 : Two Production Line Before Optimization
Figure 7 shows the case in which the production line is duplicated without further optimizing the production line after relocation is undertaken. It is surprising as the outcome shown by the graphic end up with the same worse condition where some areas could not fitted into the layout. Thus, the key findings after examining the layout using case study is summarize in table
Table 3. Key findings of case study
Key findings Production Line After Optimization
Production Line Before Optimization
Duplication Optimizing the production line allows the duplications of the line
into 2 line.
Without performing optimization prior to duplication, no duplication is possible due to
space reason
Profit Duplicating the production line encourage the direct added value area to grow larger, thus stimulate
profit generation than before duplication
Without duplication, the profit generation stays the same like the
profit from the layout before relocation.
Conclusion and Recommendation
Conclusion
determined without considering the capability of production line. This resulted in materials being push to the line all the time to try achieving the unrealistic production target resulting in WIP everywhere in the line. A solution to this problem is reducing the target production and controlling its flow by utilizing pull system.
The decreasing production target to maintain the flow is compensated by duplicating the line into several lines. Thus, at the end the attempt will increase the number of production significantly.
Prior to Workspace optimization, the placement of the areas do not rely on the needs of the users and the behavior of the system. Moreover, the space is inefficient and employing only one production line. Then, after generating new utilization of workspace, there is no unused space. Additionally, the reduction of space allow further duplication of assembly line which at the end allowing larger value-added area.
Secondly, After analyzing and examining the case study of production line and layout, the author recommend to apply the Layout of Case two in case study with Two Production Line After Optimization as can be found in figure 10. This layout found scientifically appropriate to the relationship, efficient and productive and giving twice profit compare to only using one production line as shown in the case summary in table 5.
Table 4 : Summary
Before After
Production Line Push the material to the line all the time due to unrealistic
target
Production Line using Pull System ( with buffer) and decreasing target
production
Using no relationship, bad flow The placement of Areas using the relationship gathered from the users
Space inefficient Optimizing the space of Production Line by using Time Study, Workspace design, etc Comprehensive Time Study and more detailed Line Balancing analysis could be undergo. This could be supported by establishing the detail structure of pull system with number of buffers and assembly line utilization. Warehouse analysis and Office Productivity Analysis could also be analyzed.
References
Freivalds, A. ,2009, Niebel's Methods, Standards, and Work Design. New York: McGraw-Hill. Hadiguna, R. A., & Setiawan, H., 2008, Tata Letak Pabrik, Yogyakarta: CV. Andi Offset. Hopp, W. J., & Spearman, M. L., 2008, Factory Physics, New York: McGraw-Hill.
Imai, M., 1997, Genba Kaizen: a common sense low cost approach to management, New York: McGraw-Hill Professional.
Meier, D., & Liker, J. K., 2006, A Practical Guide for Implementing Toyota's 4Ps, Esensi Erlangga Group.
Meyers, F. E., & Stephens, M. P., 2005, Manufacturing Facilities Design and Material Handling. New Jersey: Pearson Prentice Hall.
Neufert, E., Neufert, P., Baiche, B., & Walliman, N., 2002, Architects' Data 3rd Edition, USA: Willey-Blackwell.
Scriabin, M., & Vergin, R. C., 1975, Comparison of Computer Algoritms and Visual Based Methods for Plant Layout. Management Science , 172.
Sutalaksana, I. Z., Anggawisastra, R., & Tjakraatmadja, J. H., 1979, Teknik Tata Cara Kerja, Bandung: Jurusan Teknik Industri Institut Teknologi Bandung.
Tompkins, W., Bozer, F., Tanchocho, & Trevino,1996, Facilities Planning. New York: Wiley & Sons
Figure 8: Television Assembly Line in Old Building
Figure 9: Overview of New Building
Figure 11: Overview of Analysis in New Building
Figure 12: Vacant Space of New Building