An Object Orienfed Approach
to
the
Development
of
Industrial Pollution Information System
(Case Study
of D KI Jakarta Province)
Aunur
Roflq Mulyarto',
KudangBoro
Seminar2
& Suprihatin3 'MIT Study Progrom, Bogor Agricultural Unlversily. SEAMEO BlOTROP Campus.JI. Raya Tajur Urn. 6 Bogor
?Faculty of Agricultural Technology. Dogor Agricultural Unlversrty. Darmago Cornpus. Bogor. Indonesia
IFoculty of Agricultural Technology. Bogor Agricultural Unlversrty, Darmoga Campus, Bogor Indonesia
Absfract
The objective of this
reseorch
is to develop an Industrial pollution informatlonsystem. particularly for the DKI Jakorta Province by using the object-oriented
approach integrated with InPlS and spatial database methodology. The ob- ject oriented approach was chosen becuuse of its advantage in modeling the real world problem of Industrial pollution. The result of this research showed how the object oriented approach was very useful to describe the static and dynamic view of industrial pollution problem domain. The prototype of Indus-
trial Pollution Information System (InPIS) was built as web opplicatfon
using
the three tier architecture which seporated presentation. business (problem domain) and data tier. The presentation tier was designed as a web pageusing the ASP.Net. while the business tier was derived horn class design and built using Visual Basic.Net. The dota tier was implemented using relational data model completed with distributed class behavior through the stored procedures mechanism, For the industrial pollution monitoring, despite
of
itsoccuracy,
the Industrial Pollution Projection System (InPIS) can be used toestimate pollution load and pollution impact for several types of pollution parameters. The InPlS can combine it with the spatial data of DKI Jakarta administration boundary to produce the maps of pollution load distribution for the district level
Keywords: Industry. Pollution, lnformation System, Jakarta Province. Modelling, Remote Sensing, GI5
1.
Introduction 1.1.
BackgroundIn recent years, issues of industrial pollution become important c.oncern of the local and national community for the possibility of significant env~ronmental degradation and public health hazard. In Indonesia, much of the industrial expanslon has taken ploce without due regard to the environment, and has led to serious environmental degradation, particularly in Java where most of industries is located. Luken et
a/.
(2002) stated that industrial emissions of CO, in 1997 were 1.25 metric tones per capita, while organic water pollutant emis- sions were 0.16 k g per day.Jakarta, as
the
biggest city in Indonesia, also faces the problem as described above, There are various industries established in this city such as food ond beverage, woods, chernlcals, metals and textiles. All those industries poten- tially generate a wide voriety of pollutants.One of the important methods in industrial pollution monitoring, especially in estimating pollution load is the industrial Pollution Projection System (InPIS), that was developed by the Infrastructure and Environment Team of the Devel- opment Research Group of the World Bank. According to Hettige ef a/. (1 994)
the InPlS is a modeling system. which combines data from industrial activity (such as production and employment) with data on pollution emissions to cal-
cula te pollution intensity factors.
In assessing and monitoring industrial pollution
as
well as other environmental problems, information system is one of the important factors that need to be considered. Information system casts a shadow over almost every aspect of the environment debate: research, monitoring. management and. decision- making and public involvement in decision-making.This research will adopt
an
object-oriented approach because of its advan-?. tages. In case of industrial pollutlon problem. 00 approach gives many ben-
e f k anddpoSSlbtllty to build the system in a better way. By using the 00 con- cepts technology,
the
object model can be built to imitate the actual condi- tion in the real world (Fayad, 1999). For example, commonly, pollutant can bedivided into air pollutant, woter pollutant, solid waste pollutant and toxic pol- lutant. Each of them has their own characteristics, but the same basic charac- teristics such os, name and industrial
source
With the concept of class. object2
Journal of GIs,Remote
Sensing & Dynamic Modeling No. 4, 2004and inheritance, we
can
build pollutant as a class and the types of pollutant as instance of class, which inherit the basic characteristics of pollutant class. This technique could also be applied to other entities.1.2.
ObjectiveThe objective of this research is to develop the industrial pollution information
system, particularly for
the
DKI Jakarta province by using the object-oriented approach integrated with InPIS and spatial database methodology2.
Material
and
Method2.1.
Time
and
LocationThis research was conducted from March to July 2003 and covering
the
DKIJakarta province.
2.2. Data Sources
Four kinds of data have been used in this research, 1.9, statlstlcal data of the large and medium industv, demographic data, supporting data for industrial pollution estimation, and DKI Jakarta province spatial data.
2.3. Required Tools
Softwares used in this research were Microsoft Windows 2000 Professional edi- tion with Internet lnformation System
(11s)
installed. Microsoft .NET ~raheworlt1.1. Microsoft ASP.NET Web Matrix and Microsoft Visual Studio .NET, Mlcrosoft SQL Server Desktop Engine (MSDE), Microsoft Vislo, ESRl ArcView version 3.x.
InovaGlS Geographic COM Objects. Hordware used to develop this system
was PC with Pentium Ill class with minimum 500 MHz and 256 MI3 RAM.
An Object Oriented Approach to the Development of Industrial
2.4. Method
2.4.1.
System
development
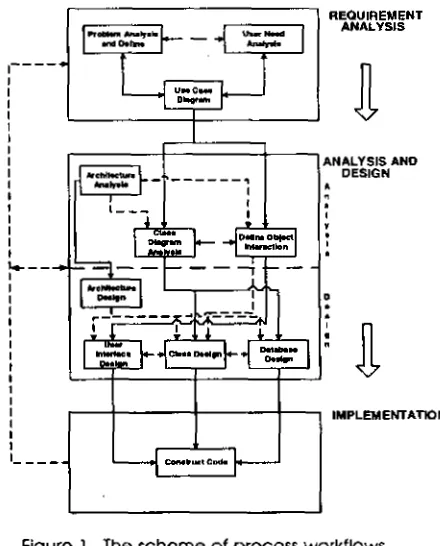
methodThis research follows the Unified Process system development and focused on the three cote process workflows namely requirement. analysis and deslgn,
and implementation wlth
some
adjustment. The scheme of process workflows It shown in Figure 1 .REQUIREMENT ANALYSIS
I
I ANALYSIS A N 0
I DESIGN
I I !
IMPLEMENTATION
[image:3.824.111.331.132.405.2]1 I _ _ - _
Figure 1. The scheme of process workflows.
The first stage of process work flows was requirement ana[ysis, which has three activities, i. e.
Problem
Analysis and Define,Users
Needs Analysis, and UseCase
Diagram Analysis. Those activities were done in order to understand the prob-lem of industrial pollution, to propose high-level solution. identify and analyze
the Oser needs of information and to develop
the
functional requirement ofthe proposed system.
4
Journal of GIs, Remote Sensing & Dynamic ModelingNo.
4, 20U4The second stage was Analysis and Design, The Analysis was conducted to
model the architecture of the Industrial Pollution Information System IlnPIS). identify ond develop the class and its interaction. The result of these activities
was used as a base for designing the system. There were four activities done in this part, included designing and developing the architecture model, deslgn- ing the class base on the analysis, designing the user interface, and develop- ing the dotabase scheme.
The final stage was Implementatlon, which covered iwo
maln
activities, i.e. translating the design stage to the code and testing the prototype of the InPIS.The basic idea behind
the
lnPlSIs
simple-
for each sector or sub-sector, deter- mine the appropriate lSlC code and find the corresponding emission factor.The pollution load is then estimated us:
PL
=
EF
*TEM
1
o6
where. PL = Pollution load for a sector In tonslyear:
EF = Emission factor in kg per thousand employees per year: and,
TEM = Total number of employees in that sector.
3.
Result and Discussions3.
I .
Requirement AnalysisMost sources of
system
requirement came from the documents related toindustriol pollution problems; only a small portion was cotlected from hter-
views. The documents were used include: 4 .
-
Act No. 23/1P97 on Environmental Management-
Government Regulation No. 8212001 on Water Qua[ity Managementand
Wastewater Control.-
Government Regulation No. 4 1 11 999 on Air Pollution Control.-
Ministry of Environment Decree No. 311998on
Wastewater Standard for Industrial Area.An Object Oriented Approach to the Development of Industrial
- Ministry of Environment Decree No. 1311995 on Emission Standard for Sta-
tionary Sources.
-
Ministry of Environment Decree No. 5111995 on Wastewater Standard for lndustrlal Activity-
Head of Bappedal Decree No. 2051 1996 on Technical Guidelines to Control Stationary Sources Alr Pollutlon.3.1
.l. Problem
Analysisand
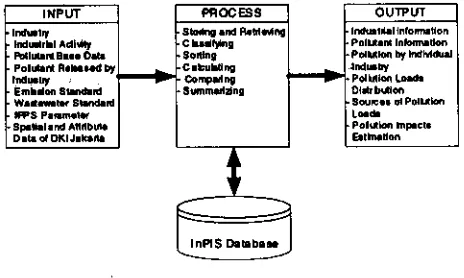
DefinitionFrom
the
inltial overview. the proposed system (InPIS) Is a system that can store, processand
providethe
lnfotmatlon of industrial pollution particularly in DKI Jakarta province to several users, suchas
local communlty, government and industry. It wasnot
Intended to replacethe
whole process In lndustrlal pollution problem, but ratherbe
addressed to equlp it. This system uses various data inputs, which come from different lnstltututions. Generalovewlew
of thls system isshown
in Figure 2.Flgure 2. The general overview of the InPIS.
3.1.2.
User
Needs Anatysls
Based on problem analysis. users of thls proposed system and their
needs
could be identified. Generally, there were four maln users, i.9.: government, industry. local communlty,and
database admlnistrotor. Government could be divlded into severalusers
such as governor, mayor, district governance, government industrial division, municlpal Industrial division, and BAPEDALDA (?he Envlron-6
Journal of GIs,Remote
Sensing & Dynamic Modeling No. 4, 2004I
mental Impact Management Agency at province level). Table 1 shows the analysis result of user needs.
Table 1.
User
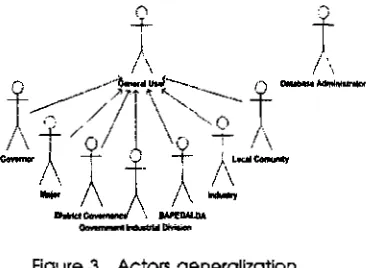
needs analysls result.3.1.3. Use-Case
Diagram
AnalysisUse cases are widely used mechanism to discover and record requirements.
especially functional (Jacobson eta!., 1999). The first step In building use case
dlogram Is to Identify actors. An actor i an abstraction for an oblect outslde the system Interacting with the system. From user need analysis flab19
l),
bosically at1 the users have the
same
role that is using the system to get theinformation they need. Therefore. the users could be generatlzed Into
two
groups of actors i.9. General User and Database Administrator is shown on Figure 3,
[image:4.819.109.341.241.380.2]Figure 3. Actors generalization
[image:5.824.135.318.54.188.2] [image:5.824.60.390.254.320.2]By
using
these actors and probiem descrlptlon several use case can be identi- fied and then the use case dlagramcan
be built. An example of use case diagram for the 1nPlS Is shown in Figure 4.Figure 4. The
use
case diagram,3.2. Analysls
and
Design
3.2.1. Analysis
a. Architectural Analysis
To fulfil
the
userneeds,
the proposed system will be built as web application. The InPiS architecture can be divided Into Three Tier (or Layer), namely Ptesen-totion Logic Tier, Business (Problem Domain) Rules/Logic Tier, and Data Tier.
The presentation logic tier should accommodate how to display the map,
chart and tabular vlew in the web page. The business tier included some rules
in retrieving
data
fromdatabase
and several dataJournol of GfS, Remote ~ e n s m ~ & Dynamic Modeling No. 4, 2004
manipulating process to transform data into information. It lnctudes math- ematical calculation, grouping, comparing and sorting. The business rules can
be built as class tlbrory of proposed system. The data tier adopted the rela- tional dota model that was commonly used and suppofted by major dotobose
management soWares.
b. Class Diagram Analysis and Refinement
The class diagram Is
a
central modeling technique that runs through nearly all object-oriented methods (Jacobson et al., 1999). ThL diagram describes the types of objects in the system and various kinds of static relationships that exlstbetween
them. There were three key steps to be performed includlng (1) Identifying classes, (2) identifying the attcibutes, and (3) identifying the asso- ciations. By distlngulshlng between associatlon, aggregation and generQHza- tion. it can be built class dlagram close could be constructed to the problem domaln. The result of these steps is shown In Figure 5.An
Object
Oriented Approach to the Development of ~ndustri'al