DOI: 10.12928/TELKOMNIKA.v11i4.1258 733
Two-phase Flow Visualization Employing
Gauss-Newton Method in Microchannel
Yonghong Liu*1, Mingyan Zu2, Xiantao Wang1, Je-Eun Choi3
1
Hebei Key Lab of Measurement Technology and Instrument, Yanshan University Qinhuangdao 066004, China
2
Gulf security technology company Ltd, Qinhuangdao 066004, China
3
College of Science and Technology Nihon University Japan *Corresponding author, e-mail: [email protected]
Abstrak
Monitoring perilaku aliran pada skala mikro sangat penting dalam banyak proses industri dan biokimia. Tomography resistansi listrik (ERT), sebagai teknik alternatif untuk memvisualisasikan aliran multi-fase, memiliki resolusi temporal yang tinggi untuk memantau proses transien cepat. Namun, kompleksitas fabrikasi kanal-mikro karena kesulitan pengambilan sampel data listrik dan non-linearitas dan ill-posedness dari masalah inversi yang sering menyebabkan resolusi spasial yang buruk pada gambar terekonstruksi. Pada makalah ini, perangkat keras akuisisi data berbasis Agilent disiapkan untuk pengambilan data yang handal pada microchannel baru. Metode Gauss-Newton dengan teknik ambang adaptif (GNAT) disajikan untuk meningkatkan resolusi spasial gambar ERT. Hasil awal eksperimen menunjukkan bahwa sistem ERT berdasarkan unit akuisisi data Agilent dan metode GNAT dapat secara efektif memvisualisasikan aliran dua-fasa padat-cair dalam kanal-mikro.
Kata kunci: microchannel, Agilent instrument, spatial resolution, Adaptive thresholding
Abstract
Flow behaviour monitoring on the micro-scale is very important in many industrial and biochemical process. Electrical resistance tomography (ERT), as an alternative technique to visualize multi-phase flows, has high temporal resolution for monitoring fast transient processes. However, the complexity of microchannel fabrication end up with the difficulty of electrical data sampling and the non-linearity and ill-posedness of the inverse problem often cause the poor spatial resolution of the reconstructed images. In this paper, Agilent based data acquisition hardware was set up for reliable data retrieval from a novel microchannel. Gauss-Newton method with adaptive threshold (GNAT) technique was presented to improve the spatial resolution of ERT images. Preliminary experimental results reveal that ERT system based on Agilent data acquisition unit and GNAT method can effectively visualize the solid-liquid two-phase flow in microchannel.
Keywords: microchannel, Agilent instrument, spatial resolution, Adaptive thresholding
1. Introduction
Two-phase flows in microchannel are of great interest in various engineering applications. Research on field of microfluidics was motivated because of the availability of fabricating complicated sensing configuration on micro scales using Micro-Electro-Mechanical Systems (MEMS) technology in recent years [1]. A number of investigations have been partially discussed according to modelling simulation [2,3], flow pattern analysis [4], flow engineering and applications: heat transfer [5], micro reactor [6] and DNA analysis [7], however, a clear understanding of the micro-scale effects on multiphase flow is still rudimentary, one of the reasons is surely a lack of experimental techniques which allow for electrical parameter measurement in very limited space. Many optical measuring methods such as micro particle image velocimetry (micro PIV) and micro laser induced fluorescence (micro-LIF) [8] have been used attempting to visualize the multiphase distribution in microchannel, but these methods can’t overcome their inherent optical scattering problem which becomes even more severe within the limited dimension.
resistance electrodes can be made very tiny to meet the micro measurement requirement, it has great potential to be applied to the research on multiphase flow visualization in microchannel in the future.
There exist several categories of reconstruction algorithms for ERT, typically including non-iterative methods such as back projection method [10], and iterative method (indirect method) with Jacobian matrix such as Newton-Raphson method [11], Kalman filter [12], etc. Usually, direct or non-iterative methods estimate the conductivity distribution with less computational time but low resolution, whereas iterative methods reconstruct the images with good resolution but more computational time. The reconstruction performance of Guass-Newton (GN) method is relatively good compared to other inverse algorithms, but there is still a need for improving the spatial resolution of the reconstruction images due to its non-linearity and ill-posedness for better application of ERT in microchannel.
In this paper, the solid-liquid two-phase scenario in a novel circular quartz-glass-made microchannel was tested, the Agilent based Data acquisition unit was constructed for the electrical data retrieval in microchannel instead of the most-used industrial tomography p2000 in order to eliminate the influence of the contact resistance and ensure the reliability of the sampled data, the spatial resolution of the reconstructed image was improved using Gauss-Newton method with adaptive threshold (GNAT) scheme. The performance of Agilent instrument and GNAT for better image visualization of the solid-liquid two-phase flow in microchannel is validated by the experiment.
2. ERT setup for microchannel
The ERT working principle consists of injecting electrical current between a pair of electrodes and measuring the potential differences between the remaining electrode pairs. This procedure is repeated for all the other electrode pairs until a full rotation of the electrical field is completed to form a set of measurements. The ERT system in our experiments is composed of three main parts, resistance electrodes array within microchannel, the data acquisition system based on Agilent instrument and a computer with image reconstruction algorithm.
2.1. Microchannel geometry
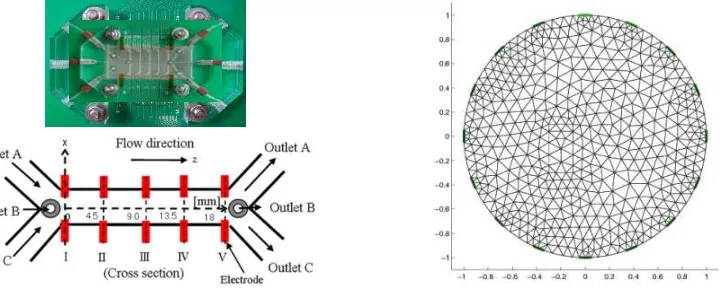
The microchannel [Covalent Materials Corporation, Japan] used in this research has circular configuration as showed in Figure 1. On the quartz-glass-made framework (5 diameter), there are totally five measuring cross-sections, neighboring cross-sections are separated from each other by 4.5mm. In each cross-section 16 silver-made resistance sensing electrodes are embedded, which are separated from each other by as showed in Figure 1(a). The inlets configuration used for microfluids injection is Y configuration, liquid or solid material with different physical property can be injected or inserted into it to form a two-phase scenario.
(a) Geometry of the microchannel (b) FEM meshes (colored regions:16 electrodes)
2.2. Data acquisition system
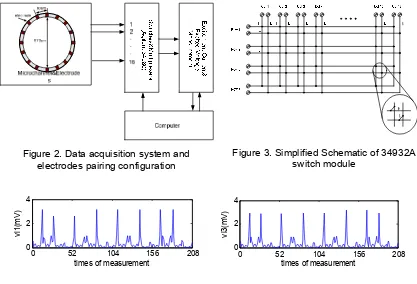
The data acquisition unit’s vital function is to transmit the data sampled from micro resistance electrodes into the computer rapidly and accurately. Unfortunately the most used commercial ERT system P2000 (Tomography company) lacks the ability to overcome the interference of contact resistance in the microchannel application due to its limited maximum exciting current frequency of only 153.6Hz, in addition, the maximum resolution of the tomography image is only 64*64 pixels. The High-tech Agilent measuring instruments was therefore employed in our system as data acquisition unit as showed in Figure 2, the Agilent 34980A was used for channel switching and E4980 impedance measurement meter for real time resistance measurement. 34932A, as a plug-in switching module of Agilent 34980A platform, was used for the electrode pairing operation as showed in Figure 3. Every row and column can be programmablely intersected to create the cross point. It has excellent scan velocity of up to 100 ch/sec and at the sampling frequency of up to 1 MHz the crosstalk can be deduced to -55dB. These excellent electrical features make Agilent family very suitable for measurement on the resistance distribution in the microchannel. The state of the Agilent instruments were controlled and supervised by a 2.5 GHz personal computer through GPIB interface for real time data processing.
Figure 4 records the voltages measured using polymer microsphere suspension (Microgenics USA) with particle of diameter of 5.0
m
to test the Agilent’s performance of noisesuppressing, all of them have obvious change with the controlled two phase flow inside the microchannel with the highest voltage level about 3.5 mV. It proves that the contact resistance has been effectively suppressed and the measured boundary voltages are sensitive to the changes of conductivity distribution within the microchannel.
Figure 2. Data acquisition system and electrodes pairing configuration
Figure 3. Simplified Schematic of34932A switch module
Figure 4. Voltages measured in cross section based on Agilent cross array
3. Gauss-Newton method with adaptive threshold technique for inverse problem
The objective of ERT is to create a tomogram representing the electrical conductivity distribution of materials flowing within some column from voltages measured at the periphery of the sensor in response to the injected electrical current.
0 52 104 156 208
0 2 4
vi
1
(m
V
)
times of measurement
0 52 104 156 208
0 2 4
vi
3
(m
V
)
To reconstruct the two phase flow image for ERT in microchannel, forward problem and
inverse problem have to be solved. Knowing the conductivity distribution
and given currentinjection, the problem of finding the electrical potential V inside or on the boundary of channel between electrode pairs is called the forward problem, Figure.1(b) shows the forward meshes of the cross section of the microchannel(3104 elements and 1681 nodes). Details for the ERT forward problem using the finite element method(FEM) can be found in [13].
For the static ERT inverse problem, the GN method is employed as an inverse solver to estimate the internal conductivity distribution inside the domain, the following objective function with regularization and prior information is formulated to minimize the error:
Φ σ ‖U σ V‖ α‖ σ σ∗ ‖ (1)
Where U σ is the calculated boundary voltages, V is the actual boundary voltages measured across the electrodes, α and are the regularization parameter and matrix, respectively, and σ∗ denotes prior information.
Taking the derivative and linearizing about a conductivity vector σ at (i-1)th iteration, we have
σ σ α V U α σ σ∗ (2)
Where U ≡ U σ ∈ , J ≡ σ ∈ is the Jacobian matrix, K is the
number of measured patterns, N is the number of elements, and the regularization matrix ∈ is used with a first-order discrete Gaussian smoothing operator.
σ σ α V U (3)
The internal conductivity distribution is determined by the inverse solver in Eq. (3) and displayed as an image in the image reconstruction. The image including the conductivity information can be considered as the gray level of the image. Therefore, threshold technique that is used in image segmentation can be applied to the ERT image reconstruction problem [14]. In this paper, the threshold technique proposed by Otsu [15] is employed to separate the background elements from the elements of the multi-target regions and the threshold values for the classification criteria are determined in every reconstructed conductivity profile. Optimal threshold values are selected to maximize the between-class (targets and background) variances. More details are given in the work of Otsu and Liao et al. [16].
After estimating the internal conductivity distribution using the GN method, the conductivity vector is modified on every iteration. First the estimated conductivity vector is converted to the gray level and multi-Otsu’s method is applied to determine adaptive threshold values for the classification criteria, then, a background index vector for indicating the elements of the background region is searched to compute the average conductivity value of the background elements. Finally, the conductivity vector is modified based on the index vector to enhance the accuracy of the reconstructed image and to reduce the condition number in the inverse solver. The proposed iterative Gauss-Newton algorithm with adaptive threshold (GNAT) method is described in detail in the following steps:
(1) Find an initial guess σ in the least-square sense [17] and compute the voltage U σ and the Jacobian matrix σ with the initial guess.
(2) Set i=1 and I_max = maximal iterations.
(3) Update the conductivity vector σ using the GN method in Eq.(3).
(4) Convert the updated conductivity vector to the gray level that contains values in the range 0-255. σ make_graylevel σ
(5) Apply multi-Otsu’s method into the intensity ρ to find adaptive multi-threshold values t and t . [t t ]=multi_otsu_method (σ)
(6) Find and index vector ∈ R for the background elements using t and t .
(7) Compute an average of conductivity values of the background elements in the present updated conductivity vector using the index vector .
(8) Replace the conductivity values of the background elements with average value σ in the updated conductivity vector σ.
(9) Compute U σ and the σ with the modified conductivity vector. (10) Set i=i+1 and go to step(3) until i=I_max.
4. Image reconstruction for solid-liquid scenario in microchannel
In the first scenario, a target of a square shaped copper rod with side length of μm was inserted in the center of the microchannel filled with saline solution of conductivity value 3 mS/cm. In the second scenario, the polymer microsphere suspension with copper spherical particle of diameter of 5. μm mixed with the same saline solution was injected in to the horizontal placed microchannel. In both experiments, an adjacent current injection measurement pattern was selected, in which the frequency of the injected excitement current was optimally set 18.6kHz at an amplitude of 10mA. Voltages on the current injected electrodes were not measured in order to reduce the influence of contact resistance. Choose the regulation parameter α to guarantee convergence of non-linear inverse problem.
The static images of the conductivity distribution in one cross-section of the 1st scenario were reconstructed, the true image with square shaped copper target, the reconstructed images using different methods are shown in Figure 5, in which (b) and (c) are the experiment results using conventional GN method and the GNAT method after 20 iterations, respectively.
(a) Ideal position image (b) Image by GN (c) Image by GNAT
Figure 5. Reconstructed image using different methods (256*256 pixels)
(a) Image by GN (20 iterations)
(b) Image by GNAT (20 iterations)
(c) Image byGNAT (50 iterations)
Figure 6. Reconstructed image with different iterations (256*256 pixels)
Since the solid target is located in the centre of the microchannel, the method of GN and GNAT can accurately detect the position of the solid part, since the target is square shaped, only the GNAT can estimates the target shape with good accuracy, the improvement of the spatial resolution for reconstructed image using GNAT is therefore tested.
5. Conclusion
The Agilent-based data acquisition unit for ERT was constructed and the Gauss-Newton method adaptive threshold technique was employed for reliable data retrieval and better spatial resolution of the image of solid-liquid two-phase flow in microchannel, preliminary tests has successfully extracted the approximated outline of dispersed phase in two-phase flows after a few iterations in the ERT problem, yielding the reconstructed image of a solid-liquid two phase flow in microchannel, Naturally the measurements are still affected by contact resistance always existing between liquid-electrode interface, which degrades the resulting images, meanwhile, the real time 3-dimension dynamic image reconstruction cannot be realized up to now due to the hardware setup restriction. Future work will aim to GNAT parameter optimization and hardware performance improvement to improve the convergence and reduce the computational load.
Acknowledgements
The present work was supported by Japanese research grant of JSPS (No.21360088), the Science and Technology Development Program of Hebei China (No.11213586) and the Science and Technology Development Program of Qinhuangdao China (No.201001A087).
References
[1] Choi J.E, Takei M, Doh D.H. Fabrication of Microchannel with 60 Electrodes and Resistance Measurement. Flow measurement and instrumentation. 2010; 61:2733-2738.
[2] Sung-Min Kim, Issam Mudawar. Universal approach to predicting two-phase frictional pressure drop for mini/micro-channel saturated flow boiling. International Journal of Heat and Mass Transfer. 2013; 58:718-734
[3] Yan Liu,Pin Shao,Hongliang Zhao, Et al.Simulation on gas injection refining process with mechanical stirring. TELKOMNIKA Indonesian Journal of Electrical Engineering. 2012; 10(8): 2194-2201. [4] Sira Saisorn, Somchai Wongwises.The effects of channel diameter on flow pattern, void fraction and
pressure drop of two-phase air-water flow in circular micro-channels. Experimental Thermal and Fluid Science. 2010; 34(4): 454-462
[5] G. Hetsroni, A. Mosyak, E. Pogrebnyak, Z. Segal. Heat transfer of gas-liquid mixture in micro-channel heat sink. International Journal of Heat and Mass Transfer. 2009; 52(17):3963-3971.
[6] Doku G.N, Verboom W, Reinhoudt D.N. On-microchip multiphase chemistry-a review of microreactor design principles and reagent contacting modes. Tetrahedron. 2005; 61: 2733-2742.
[7] Tegenfeldt J.O, Prinz C, Cao H. Micro- and nanofluidics for DNA analysis. Anal. Bioanal. Chem. 2004; 378:1678-1692.
[8] Ichiyanagi M, Sasaki S, Sato Y. Micro-PIV/LIF measurements on electrokinetically-driven flow in surface modified microchannels. Journal of Micromechanics and Microengineering. 2009; 19:1-9. [9] Ricard F, Brechtelsbauer C, Xu X.Y. Monitoring of Multiphase Pharmaceutical Processes Using
Electrical Resistance Tomography. Chemical Engineering Research and Design. 2005; 83:794-805. [10] Barber DC, Brown BH. Applied potential tomography. Journal of Physics E: Scientific Instruments.
1984; 17:723-33.
[11] Yorkey TJ, Webster JG, Tompkins WJ. Comparing reconstruction algorithms for electrical impedance tomography. Transactions on Biomedical Engineering 1987; 34:843-52.
[12] Umer Zeeshan Ijaz, Anil Kumar Khambampati, Jeong Seong Lee. Nonstationary phase boundary estimation in electrical impedance tomography using unscented Kalman filter. Journal of Computational Physics. 2008; 227:7089-7112.
[13] N. Polydorides. PhD thesis, Image reconstruction algorithms for soft-field tomography, University of Manchester Institute of science and technology, Manchester. 2002: 250.
[14] Kim BS, Khambampati AK, Kim S, Kim KY. Image reconstruction with an adaptive threshold technique in electrical resistance tomography. Measurement Science and Technology. 2011; 22:1-12.
[15] Otsu N. A threshold selection method fr om gray-level histograms. IEEE Transactions on Systems, Man, and Cybernetics. 1979; 9:62-66.
[16] Liao PS, Chen TS, Chung PC. A fast algorithm for multilevel thresholding. Journal of Information Science and Engineering. 2001; 17:713-727.