TELKOMNIKA, Vol.10, No.2, June 2012, pp. 327~334 ISSN: 1693-6930
accredited by DGHE (DIKTI), Decree No: 51/Dikti/Kep/2010 327
Blood Vessel Enhancement and Segmentation for
Screening of Diabetic Retinopathy
M. Usman Akram*1, Ibaa Jamal2, Anam Tariq3 Bahria University,
National University of sciences & Technology Islamabad, Pakistan
e-mail: [email protected]*1, [email protected], [email protected]
Abstrak
Diabetic retinopathy adalah penyakit mata yang disebabkan kenaikan kadar insulin dalam arah dan penyakit ini merupakan salah satu penyebab utama kebutaan di negara industri. Penyakit ini merupakan penyakit progresif dan membutuhkan deteksi dan penanganan awal. Pola vaskular dari retina manusia membantu opthamologis dalam skrining otomatis dan diagnosa diabetic retinopathy. Pada makalah ini, disajikan sebuah metode untuk segmentasi dan peningkatan pola vaskular. Sistem terotomisasi yang menggunakan wavelets disajikan untuk menaikkan pola vaskular dan kemudian diterapkan pada probing ambang sesepenggal dan pengambangan adaptif untuk kegunaan lokalisasi pembuluh darah dan segmentasi berkaitan. Metode dievaluasi dan diuji menggunakan database retina yang tersedia umum dan lebih jauh metode yang diusulkan dibandingkan dengan teknik yang sudah ada.
Kata kunci, diabetic retinopathy, blood vessels, : probing ambang, wavelets
Abstract
Diabetic retinopathy is an eye disease caused by the increase of insulin in blood and it is one of the main cuases of blindness in idusterlized countries. It is a progressive disease and needs an early detection and treatment. Vascular pattern of human retina helps the ophthalmologists in automated screening and diagnosis of diabetic retinopathy. In this article, we present a method for vascular pattern ehnacement and segmentation. We present an automated system which uses wavelets to enhance the vascular pattern and then it applies a piecewise threshold probing and adaptive thresholding for vessel localization and segmentation respectively. The method is evaluated and tested using publicly available retinal databases and we further compare our method with already proposed techniques.
Keywords: Diabetic retinopathy, blood vessels, wavelets, threshold probong.
1. Introduction
Diabetic retinopathy is the result of microvascular changes in retina [1]. In some patient with diabetic retinopathy, blood vessels may swell and leak fluid [2]. In other, new abnormal blood vessels grow on the surface of the retina [3] that is why blood vessel segmentation is an important part of automated diabetic retinopathy screening system. A tool which can be used to assist in the diagnosis of diabetic retinopathy should automatically detect all retinal image features such as optic disk, fovea and blood vessel [3], [5], [6] and all abnormalities in retinal image such as microaneurysms [2], [7], [8], hard exudates and soft exudates [9], [10], hemorrhages, and edema [2]. Illumination equalization is needed to enhance the image quality as the acquired color retinal images are normally of different qualities.
Retinal vascular pattern facilitates the physicians for the purposes of diagnosing eye diseases, patient screening, and clinical study [4]. Inspection of blood vessels provides the information regarding pathological changes caused by ocular diseases including diabetes, hypertension, stroke and arteriosclerosis [11]. Patients with diabetes are more likely to have eye diseases [35]. The hand mapping of retinal vasculature is a time consuming process that entails training and skill. Automated segmentation provides consistency and reduces the time required by a physician or a skilled technician for manual labeling [1].
TELKOMNIKA Vol. 10, No. 2 synthesis, identification of the challenges faced in automat contrast with respect with ba available fundus image data techniques.
The paper is organiz implementation methodology required for automated vessel different retinal images and Section 4. enhance the vascular pattern Locating of blood vessels is d binary mask is created by th marked by the masking proce vessels and zero to non vesse an automated vessel screen segmentation technique.
2.1. Blood Vessel Enhancem In order to find the vas accurately. The vessels varie them. Thin blood vessels or
2, June 2012 : 327 – 334
the optic disc position [5], and localization of the ated vessel detection include wide range of ve background and appearance of variety of structu retinal boundary and other pathologies [15].
s for automated vessel segmentation have been pr o obtain the vasculature structure, along with vess proposed by [16]-[21]. Tracking consists of follow ation. In [27], ridge detection was used to form li atches belonging to each line element. Pixel fea presentation. Many features were presented and a
ose which provide the best class separability. Pape els segmentation. Chuadhuri et al. [26] proposed a e blood vessels. An improved region based thresho hnique was used by Hoover et al. [28].
present an automated system for blood vessel e retinal images. We use Gabor wavelet to enhance adaptive thresholding to localize and segment the e validity and accuracy of proposed method usi
atabases and also compare the results with a
nized in four sections. In section 2, a schematic y is illustrated. Section 2 also presents the step by sel enhancement and segmentation. Experimental r d their analysis are given in Section 3 followed
ng the accurate vascular pattern is very important i . Our proposed method segments the blood ves y as compared to previous techniques. In propo
l image is taken as an input and 2-D Gabor wa rn especially the thin and less visible vessels ar s done using piecewise threshold probing and ves thresholding the enhanced retinal image. The b cedure which assigns one to all those pixels which ssels pixels. Figure 1 shows the complete flow diag eening system using proposed blood vessel en
Figure 1. Flow diagram of proposed system
ement using Gabor Wavelets
TELKOMNIKA ISSN: 1693-6930 329
require enhancement before extraction. Mostly matched filters (MFs) [6] are used for blood vessel enhancement but the drawback is that MFs not only enhance blood vessels edges but also enhance bright lesions. On the other hand, Gabor wavelets can be tuned for specific frequencies and orientations which is useful for both thick and thin vessels. Gabor wavelet has its application in almost every field and they are mostly used to enhance the pattern at some specific orientation [36]. 2-D Gabor wavelet is used due to its directional selectiveness capability of detecting oriented features and fine tuning to specific frequencies [29], [30]. The Gabor wavelet is defined in equation 1
0
2
1
( )
exp(
) exp(
|
| )
2
G
x
jk x
A x
ψ
=
−
(1)where k0 is a vector that defines the frequency of the complex exponential and A = diag[ε−1/2, 1], ε>1 is a 2×2 diagonal matrix that defines the elongation of filter in any desired direction.
The algorithm for the gabor wavelet based enhancement is as below:
Step 1: Set
T
ψ( , , )
b
θ
a
=
C
ψ−1 / 2a
∫
ex p (
jkb
)
ψ
ˆ
*(
a r k f k d k
−θ)
ˆ
( )
2 (2)where f Є L2 is an image represented as a square integral (i.e., finite energy) function defined over R2 and ψЄ L2 be the analyzing wavelet. Cψ, ψ, b, θ and a denote the normalizing constant,
analyzing wavelet, the displacement vector, the rotation angle, and the dilation parameter respectively.
Step 2: for each θ=10o,20o,30o,40o,……,170o
Calculate
M
ψ(
b a
,
)
=
m a x
θ|
T
ψ(
b
,
θ
,
a
) |
(3)end_for
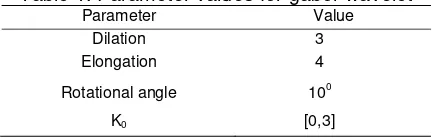
Table 1. Parameter values for gabor wavelet
Parameter Value Dilation 3 Elongation 4 Rotational angle 100
K0 [0,3]
2.2. Blood Vessel Segmentation using Threshold Probing
We present a method for blood vessel localization that compliments local vessel attributes with region-based attributes of the network structure. A piece of the blood vessel network is hypothesized by probing an area of the wavelet based enhanced image, iteratively decreasing the threshold. Pixels from probes that are not classified as vessel are recycled for further probing. The strength of this approach is that individual pixel labels are decided using local and region-based properties and afterwards adaptive thresholding has been applied. The basic operation of our algorithm is to probe regions in a wavelet based enhanced image. During each probe, a set of criteria is tested to determine the threshold of the probe, and ultimately to decide if the area being probed (termed a piece) is blood vessel. A queue of points is initialized, each of which will be used for a probe. Upon a probe’s completion, if the piece is determined to be vessel, then the endpoints of the piece are added to the queue. In this way, different probes (and thus different thresholds) can be applied throughout the image.
TELKOMNIKA Vol. 10, No. 2, June 2012 : 327 – 334
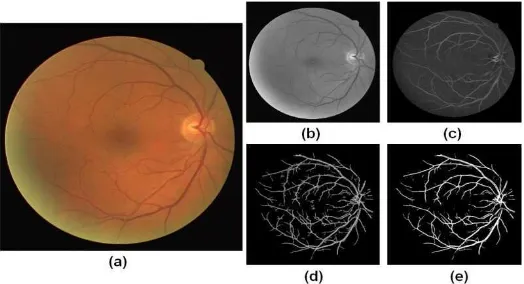
Figure 2. The step by step outputs of proposed system; a) original colored retinal image; b) extracted green channel image; c) enahnced blood vascular pattern using wavelets; d) output of
threshold probing; e) segmented blood vessels
3. Results and Analysis
The tests of proposed technique are performed with respect to the vessel segmentation accuracy using three publicly available databases i.e. DRIVE [32], STARE [33] and DIARETDB1 [34]. The DRIVE database consists of 40 RGB color images of the retina. The images are of size 768x584 pixels, eight bits per color channel. The STARE database consists of 20 RGB color images of the retina. The images are of size 605x700 pixels, 24 bits per pixel (standard RGB). Both retinal image datasets (DRIVE and STARE) are divided into a test and training set and each one contains 20 images. The test set is used for measurement of performance of the vessel segmentation algorithms. There are two hand-labeling available for the 20 images of test set made by two different human observers. The manually segmented images by 1st human observer are used as ground truth and the segmentations of set B are tested against set A, serving as a human observer reference for performance comparison truth [28], [31]. Another standard diabetic retinopathy retinal image database is diaretdb1. Diaretdb1 database contains 89 retinal images with a resolution of 1500 x 1152 pixels and of different qualities in terms of noise and illumination. Diaretdb1 is a good standard database to evaluate different lesions of diabetic retinopathy as out of 89 images 84 contain at least mild NPDR signs (MA’s) of the DR, and 5 are considered as normal which do not contain any signs of the DR according to all experts who participated in the evaluation. Images were captured using the same 50o FOV digital fundus camera with varying imaging settings. The performance of proposed technique is measured using receiver operating characteristic (ROC) curve which is a plot of true positive fraction versus false positive fraction. In order to find the accuracy and area under the ROC curve, following parameters are calculated.
a. TP (true positive): Pixels that are computed as vessel pixels and they also belong to vessels in ground truth.
b. FP (false positive): Pixels that are computed as vessel pixels but they are non-vessels in ground truth.
c. TN (true negative): Pixels that are computed as nonvessel pixels and they are also non-vessels in ground truth.
d. FN (false negative): Pixels that are computed as nonvessel pixels but they belong to vessels in ground truth.
The true positive fraction is the fraction of number of true positive and total number of vessel pixels in the retinal image. False positive fraction is calculated by dividing false by total number of non vessel pixels in the retinal image. We compared the accuracy of proposed technique with the accuracies of the methods of Staal et al. [27] and Soares et al. [31]. Figure 3 shows the ROC curves for STARE and DRIVE databases using proposed method.
TELKOMNIKA
Figure 3. ROC curve
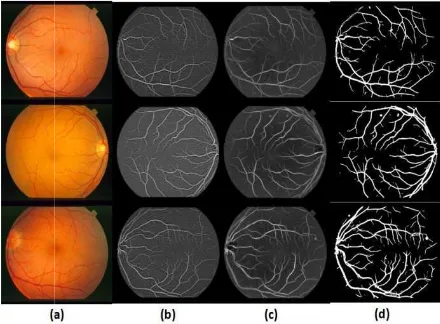
Figure 4. Proposed technique retinal images from datase inverted threshold probin
Figure 5. Proposed techn a) original retinal images from
[6]; c) enahanced blood ves
ISSN: 1693-6930
ves for STARE and DRIVE databases for proposed
ue results for four images from the DRIVE database set; row 2: enhanced retinal images using Gabor w ing results; row 4: segmentation results for propose
hnique results and for three images from the STAR m dataset; b) enhanced blood vessels using match vessels using gabor wavelts; d) segmentation result
technique
331
ed method
ase. Row 1: original r wavelet; row 3: osed technique
ARE database. tched filter response
TELKOMNIKA Vol. 10, No. 2, June 2012 : 327 – 334
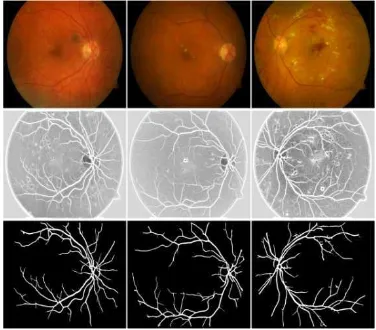
Figure 6. Blood vessel segmentation for DiaretDB: row 1: Original images; row 2: Wavelet based enhanced images; row 3: segmentred blood vessels
Figure 7. Comparison results for blood vessel segmentation. a) Original retinal images; b) Segmented blood vessels using Hoover et. Al. method [28]; c) Segmented blood vessels using
proposed technique
Table 2 summarizes the results of vessel segmentation for DRIVE and STARE databases. It shows the results in terms of average accuracy and their standard deviation for different Segmentation methods and a second human observer. Average accuracy is the fraction of pixels correctly classified.
Table 2. Vessel Segmentation Results (DRIVE & STARE Databases)
Methods DRIVE
Accuracy Std Dev
STARE
Accuracy Std Dev 2nd Observer 0.9473 0.0048 0.9351 0.0171 Staal et. al 0.9441 0.0079 0.9516 0.0329 Soares et. al 0.9466 0.0055 0.9480 0.0298 Bit Plane 0.9303 0.0318 0.9367 0.0311 PM 0.9469 0.0053 0.9502 0.0253
4. Conclusion
TELKOMNIKA ISSN: 1693-6930 333
diabetic retinopathy. Blood vessel enhancement is done in colored retinal images by using Gabor wavelet and then vessels are probed and segmented using piecewise threshold probing and adaptive thresholding. Three standardard retinal images databases i.e. DRIVE, STARE and DIARETDB1 are used for through evaluation of proposed system. The accuracies are measured with respect to manually labeled blood vessels which are available with the databases. Experimental results show that our method performs well in enhancing, probing and segmenting the vascular pattern. The presented method will be helpful in screening process of blood vessel for diagnosis of diabetic retinopathy as it has a high accuracy of detecting blood vessels.
References
[1]. EJ Susman, WJ Tsiaras, KA Soper: Diagnosis of Diabetic Eye Disease. JAMA. 1982; 247: 3231-3234.
[2]. SC Lee, ET Lee, RM Kingsley, YWang, D Russell, R Klein, A Wanr. Comparison of Diagnosis of Early Retinal Lesions of Diabetic Retinopathy between a Computer System and Human Experts. Graefes Arch. Clin. Exp. Ophtalmol. 2001; 119: 509-515.
[3]. C Sinthanayothin, JF Boyce, HL Cook, TH Williamson. Automated Localization of the Optic Disc. Fovea and Retinal Blood Vessels from Digital Color Fundus Images. Br. J. Opthalmol. 1999; 83: 231-238.
[4]. J KansKy. Clinical Opthalmology. London: Butterworh-Heinmann. 1994.
[5]. M Foracchia, E Grisan, A Ruggeri. Detection of Optic Disc in Retinal Images by Means of a Geometrical Model of Vessel Structure. IEEE Transactions on Medical Imaging. 2004; 23(10): 1189-1195.
[6]. NKMN Subhasis Chaudhuri, Shankar Chatterjee, Michael Goldbaum. Detection of Blood Vessels in Retinal Images using Two-Dimensional Matched Filters. IEEE Transactions on Medical Imaging. 1989; 8(3): 263-269.
[7]. T Spencer, RP Phillips, PF Sharp, JV Forrester. Automated Detection and Quantification of Microaneurysms in Fluorescein Angiograms. Graefes Arch. Clin. Exp. Ophtalmol. 1991; 230: 36-41. [8]. AJ Frame, PE Undill, MJ Cree, JA Olson, KC McHardy, PF Sharp, JF Forrester. A Comparison of
Computer Based Classification Methods Applied to the Detection of Microaneurysms in Ophtalmic Fluorescein Angiograms. Comput. Biol. Med. 1998; 28: 225-238.
[9]. A Osareh, M Mirmehdi, B Thomas, R Markham. Automatic Recognition of Exudative Maculopathy using Fuzzy C-Means Clustering and Neural Networks. Proc. Medical Image Understanding Analysis Conference. 2001: 49-52.
[10]. R Phillips, J Forrester, P Sharp. Automated Detection and Quantification of Retinal Exudates. Graefes Arch. Clin. Exp. Ophtalmol. 1993; 231: 90-94.
[11]. T Teng, M Lefley, D Claremont. Progress towards Automated Diabetic Ocular Screening: A Review of Image Analysis and Intelligent Systems for Diabetic Retinopathy. Med. Biol. Eng. Comput. 2002; 40: 2-13.
[12]. A Pinz, S Bernogger, P Datlinger, A Kruger. Mapping the Human Retina. IEEE Trans. Med. Imag. 1998; 17(4): 606-619.
[13]. CL Tsai, CV Stewart, HL Tanenbaum, B Roysam. Modelbased Method for Improving the Accuracy and Repeatability of Estimating Vascular Bifurcations and Crossovers from Retinal Fundus Images. IEEE Trans. Inf. Technol. Biomed. 2004; 8(2): 122-130.
[14]. H Li, O Chutatape. Automated Feature Extraction in Color Retinal Images by a Model Based Approach. IEEE Trans. Biomed. Eng. 2004; 51(2): 246-254.
[15]. AM Mendona, AJ Campilho. Segmentation of Retinal Blood Vessels by Combining the Detection of Centerlines and Morphological Reconstruction. IEEE Trans. Med. Imag. 2006; 25(9): 1200-1213. [16]. I Liu, Y Sun. Recursive Tracking of Vascular Networks in Angiograms Based on the
Detection-Deletion Scheme. IEEE Trans. Med. Imag. 1993; 12(2): 334-341.
[17]. L Zhou, MS Rzeszotarski, LJ Singerman, JM Chokreff. The Detection and Quantification of Retinopathy using Digital Angiograms. IEEE Trans. Med. Imag. 1994; 13(4): 619-626.
[18]. O Chutatape, L Zheng, SM Krishnan. Retinal Blood Vessel Detection and Tracking by Matched Gaussian and Kalman Filters. Proc. 20th Annu. Int. Conf. IEEE Eng. Med. Biol. Soc. (EMBS98). 1998; 20: 3144-3149.
[19]. YA Tolias, SM Panas. A Fuzzy Vessel Tracking Algorithm for Retinal Images Based on Fuzzy Clustering. IEEE Trans. Med. Imag. 1998; 17(2): 263-273.
[20]. A Can, H Shen, JN Turner, HL Tanenbaum, B. Roysam. Rapid Automated Tracing and Feature Extraction from Retinal Fundus Images using Direct Exploratory Algorithms. IEEE Trans. Inf. Technol. Biomed. 1999; 3(2): 125-138.
TELKOMNIKA Vol. 10, No. 2, June 2012 : 327 – 334
[22]. T McInerney, D Terzopoulos. T-snakes: Topology Adaptive Snakes. Med. Image Anal. 2000; 4: 73-91.
[23]. R Toledo, X Orriols, X Binefa, P Radeva, J Vitri, J Villanueva. Tracking of Elongated Structures using Statistical Snakes. IEEE Comput. Soc. Conf. Comput. Vision Pattern Recog. (CVPR). 2000.
[24]. A Vasilevskiy, K Siddiqi. Flux Maximizing Geometric Flows. IEEE Trans. Pattern Anal. Mach. Intell. 2002; 24(12): 1565-1578.
[25]. D Nain, A Yezzi, G Turk. Vessel Segmentation using a Shape Driven Flow. Med. Image Comput. Comput.-Assist. Intervention MICCAI. 2004: 51-59.
[26]. S Chaudhuri, S Chatterjee, N Katz, M Nelson, M Goldbaum. Detection of Blood Vessels in Retinal Images using Two-Dimensional Matched Filters. IEEE Trans. Med. Imag. 1989: 263-269.
[27]. J Staal, MD Abramoff, M Niemeijer, MA Viergever, B van Ginneken. Ridge-Based Vessel Segmentation in Color Images of the Retina. IEEE Trans. Med. Imag. 2004; 23(4): 501-509.
[28]. A Hoover, V Kouznetsova, M Goldbaum. Locating blood vessels in retinal images by piecewise threshold probing of a matched filter response. IEEE Trans. Med. Imag. 2000; 19(3): 203-211. [29]. A Arnodo, N Decoster and SG Roux. A wavelet-based method for multifractal image analysis. I.
Methodology and test applications on isotropic and anisotropic random rough surfaces. Eur. Phys. J. A. 2000; 15: 567-600.
[30]. JP Antoine, P Carette, R Murenzi, B Piette. Image analysis with two-dimensional continuous wavelet transform. Signal Process. 1993; 31: 241-272.
[31]. JVB Soares, JJG. Leandro RM. Cesar HF Jelinek, J Cree. Retinal vessel segmentation using the 2-D gabor wavelet and supervised classification. IEEE Trans. on Med. Imag. 2006; 25(9): 1214-1222. [32]. Niemeijer, van Ginneken, B. http://www.isi.uu.nl/Reseach/Databases/DRIVE/results.php, 2002 [33]. Hoover: STARE database, http://www.ces.clemson.edu/ ahoover/stare
[34]. Kauppi T, Kalesnykiene V, Kamarainen JK, Lensu L, Sorri I, Raninen A, Voutilainen R, Uusitalo H, Klviinen H, Pietil J. DIARETDB1 diabetic retinopathy database and evaluation protocol, Technical report, (2006).
[35]. Tama BA, Rodiyatul FS, Hermansyah. An Early Detection Method of Type-2 Diabetes-Mellitus in Public Hospital. TELKOMNIKA. 2011; 9(2): 287-294.