PROJECT COMPLETION REPORT
FOR
SHORT TERM RESEARCH GRANT
WIRELESS MONITORING FOR AMBIENT VIBRATIONS:
INVESTIGATE POTENTIAL AMBIENT VIBRATION SOURCE FOR
ENERGY HARVESTING
Principle Researcher :
Dr. Kok Swee Leong
Co-Researchers
:
Siti Huzaimah Binti Husin (FKEKK)
Dr. David Yap Fook Weng (FKEKK)
Dr. Soo Yew Guan (FKEKK)
Norizan Bin Mohamad (FKEKK)
Project Code No.
:
PJP/2011/FKEKK(21C)/S00901
Date of Submission :
2013
Department of Industrial Electronics
WIRELESS MONITORING FOR AMBIENT VIBRATIONS:
INVESTIGATE POTENTIAL AMBIENT VIBRATION SOURCE FOR
ENERGY HARVESTING
DR. KOK SWEE LEONG
RESEARCH VOTE NO:
PJP/2011/FKEKK(21C)/S00901
FACULTY OF ELECTRONIC AND COMPUTER ENGINEERING
UNIVERSITI TEKNIKAL MALAYSIA MELAKA
iii ABSTRACT
WIRELESS MONITORING FOR AMBIENT VIBRATIONS:
INVESTIGATE POTENTIAL AMBIENT VIBRATION SOURCE FOR ENERGY HARVESTING
(Keywords: Energy Harvesting, Vibration, Piezoelectric)
Ambient vibration is one of the main sources of energy harvesting and for the past few years it has attracted many interests in design and development of vibration based micro generators. Energy harvesting is also known as energy scavenging is the process of extracting residual ambient sources into usable electric energy which can be used to power-up small electrical devices that require very low power consumption such as wireless sensor nodes and wearable devices. The aim of this project is to investigate useful ambient vibration sources that have a great potential for energy harvesting. The research work comprises process of identifying, measuring and analyzing the identified ambient vibrations which is in the scope of low level of acceleration; <1g. Then, the obtained vibration raw data will be transformed from the time domain into frequency domain by using appropriate mathematical tool. At the end of the project, a summary of various vibration sources is presented in terms of vibration frequency and acceleration level. Suggestions of micro generators developed by other researchers that suit to the identified useful ambient vibration sources for energy harvesting applications is also presented.
Key Researchers:
Dr. Kok Swee Leong (Principle Investigator) Siti Huzaimah Binti Husin
Dr. David Yap Fook Weng Dr. Soo Yew Guan Norizan Bin Mohamad
E-mail : [email protected]
Tel. No. : 06-555 2157
iv
ACKNOWLEDGEMENT
I would like to extend my sincere appreciation to Universiti Teknikal Malaysia Melaka for the short term research grant with the vote number, PJP/2011/FKEKK(21C)/S00901, without which this research project would not be possible to complete.
I would also like to acknowledge my Master by taught course students, Mr. Mohd Fauzi Bin Ab Rahman and Nur Hanisah who had contributed in the completion of this 12-month project.
Gratitude also goes to the head of Industrial Electronics 2 laboratory, Mr. Ahmad Nizam Bin Mohd Jahari and technician Mrs. Hafizah Binti Adnan for their courtesies in granting us the usage of space in the laboratory and the technical as well as moral support in completing the project.
v CONTENTS
ABSTRACT ...iii
ACKNOWLEDGEMENT ... iv
CONTENTS ...v
List of Figures ... vii
List of Tables ...x
List of Abbreviations ... xi
List of Symbols ... xii
Chapter 1 Introduction ... 1
1.1 Introduction ... 1
1.2 Project Objectives ... 2
1.3 Problem Statement ... 2
1.4 Project Significance ... 4
1.5 Scope of works ... 5
Chapter 2 Literature Review ... 7
2.1 Introduction ... 7
2.2 Wireless sensor network ... 7
2.3 Energy harvesting sources ... 8
2.4 Overview of Micro generators ... 10
2.4.1 Piezoelectric micro generator working principle ... 10
2.4.2 Electrostatic micro generator working principle ... 11
2.4.3 Electromagnetic micro generator working principle ... 11
2.4.4 Generic Mechanical-to-Electrical Conversion Model... 12
2.4.5 Analytical Model of Piezoelectric Micro Generator ... 15
2.5 Generic model of accelerometer ... 16
2.5.1 ADXL 321 Accelerometer ... 19
2.5.2 G-Link Accelerometer Node ... 20
2.6 Conclusion ... 21
vi
3.1 Introduction ... 22
3.2 Data acquisition set-up process flow ... 22
3.3 Calibration of G-Link node ... 23
3.3.1 Equipments and devices used in the calibration process ... 25
3.3.2 Calibration procedures ... 25
3.3.3 Calibration Result ... 28
3.3.4 G-Link node calibration result summary ... 34
3.4 Other considerations in data acquisition set-up ... 35
3.5 Conclusion ... 37
Chapter 4 Various Ambient Vibration Sources Investigation ... 38
4.1 Various vibration source ... 38
4.1.1 Electrical housing appliances ... 38
(a) (b) ... 45
4.1.2 Machineries ... 51
4.1.3 Vehicles ... 55
4.2 Ambient vibration result summary ... 64
4.3 Summary of suggested micro generators ... 66
4.4 Conclusion ... 68
Chapter 5 Conclusion and Future Work... 69
5.1 Conclusions ... 69
5.2 Future work ... 70
REFERENCES ... 71
vii
List of Figures
Figure 1.1: Project K-chart ... 6
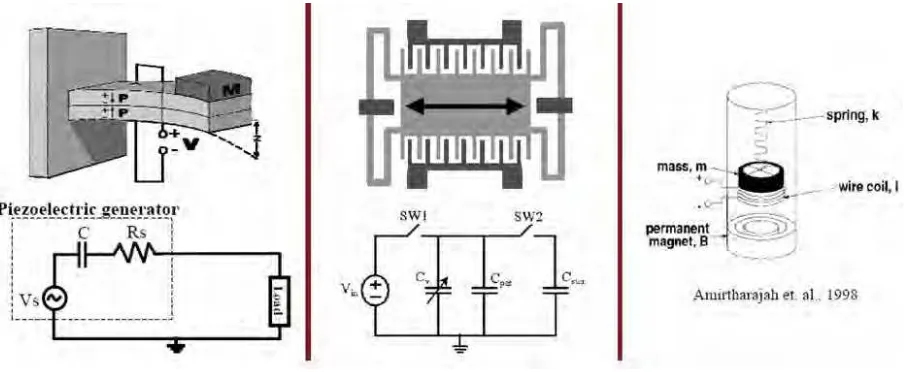
Figure 2.1 Vibration based energy harvesting micro generators (Roundy, S. and Wright, P.K., 2004; Meninger, S., et al., 2001; Amirtharajah, R. and Chandrakasan, A.P., 1998) ... 11
Figure 2.2: A linear mass-spring-damper system ... 12
Figure 2.3: Relationship of natural frequency and input frequency ... 14
Figure 2.4: Analytical model of piezoelectric micro generators [36] [2] ... 15
Figure 2.5: A typical accelerometer model. ... 16
Figure 2.6: Free body diagram ... 17
Figure 2.7: Photograph of an ADXL 321 ... 19
Figure 2.8: Measuring device, (a) G-Link accelerometer node, (b) Analog base station, (c) G-Link node firmware. ... 20
Figure 3.1: Data acquisition set-up process flow. ... 24
Figure 3.2: Overall set-up for the G-Link node calibration process ... 27
Figure 3.3: (a) G-Link node and ADXL 321 mounted on the shaker stand, (b) Close-up look of the ADXL 321 mounted position. ... 27
Figure 3.4: FFT results at 30 Hz input signal of the ADXL 321 that being used for calibration. ... 29
Figure 3.5: G-Link data computed by using Matlab (30Hz input signal at maximum amplitude). Frequency : 29.95 [Hz], Acceleration : 3.087 [g] ... 29
Figure 3.6: G-Link data computed by using Excel at 30 hz input signal with maximum amplitude... 30
Figure 3.7: FFT captured at 50 Hz input signal with maximum amplitude ... 31
Figure 3.8: G-Link data computed by using Matlab (30Hz input signal at maximum amplitude). Frequency : 50 Hz, Acceleration : 1.203 g ... 31
Figure 3.9: G-Link data computed by using M.Excel (50Hz input signal at maximum amplitude). Frequency : 50 Hz, Acceleration : 1.5 g ... 32
Figure 3.10: FFT result at 50 Hz input signal with maximum amplitude... 33
viii
Figure 3.12: G-Link data computed by using Excel at 70 Hz input signal with maximum amplitude at 0.9 g. ... 34 Figure 3.13: (a) 60 seconds vibration data in time domain, (b) 2 seconds window for the
same vibration data, (c) Computed FFT results at the 2 seconds window. ... 35 Figure 3.14: G-Link wireless accelerometer node outlook ... 36 Figure 3.15: (a) G-Link orientation with respect to channel 1, 2 and 3, (b) Mounting
position of G-Link on a microwave as an ambient vibration source. ... 36 Figure 3.16: G-Link node installed with a magnet ... 37 Figure 4.1: (a) Takada air cooler, (b) when operated at lower speed with 42.37 Hz and
acceleration of 0.013 g, (c) operated at higher speed with 99.97 Hz and acceleration of 0.032 g. ... 39 Figure 4.2: (a) Blender Panasonic MX-895 N with load, (b) Vibration data when operated
with 216.2 Hz and acceleration of 0.644 g. ... 40 Figure 4.3: (a) Cradle with 4 kg infant as a load, (b) Vibration data when operated with
1.28 Hz and acceleration of 0.057 g. ... 42 Figure 4.4: (a) Panasonic refrigerator, (b) Vibration data when operated with 49.15 Hz
and acceleration of 0.002 g. ... 42 Figure 4.5: (a) Panasonic microwave, (a) Vibration data when operated with 200.1 Hz and
acceleration of 0.114 g. ... 43 Figure 4.6: (a) Elba cooking hood, (b) vibration data when operated with 100 Hz and
acceleration of 0.063 g. ... 43 Figure 4.7: (a) Reebok threadmill, (b) vibration data computed with FFT which give
26.37 Hz and acceleration of 0.0063 g. ... 45 Figure 4.8: (a) Panasonic vacuum cleaner, (b) vibration data computed with FFT when
operated with 99.97 Hz and acceleration of 0.158 g. ... 45 Figure 4.9: (a) Panasonic stand fan, (b) vibration data when operated at lower speed with
100.1 Hz and acceleration of 0.611 g, (c) when operated at medium speed with 100 Hz and acceleration of 0.422 g and, (d) when operated at higher speed with 100 Hz and acceleration of 0.418 g. ... 46 Figure 4.10: (a) Ventilating fan, (b) vibration data computed with FFT resulting in 213.9
Hz and acceleration of 0.03 g. ... 48 Figure 4.11: (a) Toshiba washing machine, (b) vibration data obtained when operated
ix
Figure 4.12: (a) Panasonic water heater, (b) vibration data obtained when operated which derived a frequency of 99.84 Hz and acceleration of 0.006 g. ... 49 Figure 4.13: (a) HP desktop computer, (b) vibration data obtained when operated and
derived a frequency of 120.1 Hz and acceleration of 0.004 g. ... 49 Figure 4.14: (a) Lenovo laptop, (b) vibration data obtained when operated which derived
a frequency of 89.98 Hz and acceleration of 0.01 g. ... 50 Figure 4.15: (a) Air handling unit (AHU) in UTeM building, (b) vibration data derived
with frequency of 33.02 Hz and acceleration of 0.01 g. ... 51 Figure 4.16: (a) Computer numerical control (CNC) machine, (b) vibration data when
operated which derived a frequency of 83.33 Hz and acceleration of 0.022 g. ... 53 Figure 4.17: (a) Mc D&D grinding machine without load, (b) FFT computed vibration
data which derived frequency of 49.15 Hz and acceleration of 0.358 g. ... 53 Figure 4.18: (a) Lathe machine, (b) vibration data computed with FFT which derived
frequency of 298.4 Hz and acceleration of 0.034 g. ... 54 Figure 4.19: (a) Enrique Holke milling machine, (b) vibration data with frequency 139.6
Hz and acceleration of 0.018 g. ... 54 Figure 4.20: (a) Toyota Vios year 2008, (b) vibration data when car is in stationery with
engine turned on; vibration frequency 24.7 Hz and acceleration of 0.2 g, (c) measurement taken on the roof the car with a frequency of 27.7 Hz and acceleration of 0.003 g. ... 56 Figure 4.21: (a) Honda Wave motorcycle, (b) vibration data obtained when the
motorcycle was in stationery with engine turned-on derive a frequency of 16.5 Hz and acceleration of 0.031 g. ... 57 Figure 4.22: Moving vehicle vibration data derived from FFT at (a) first frame of 60
seconds, (b) second frame of 60 seconds and, (c) third frame of 60 seconds. ... 58 Figure 4.23: Ambient vibration analysis for moving vehicle when driving at a straight
road ... 60 Figure 4.24: Ambient vibration analysis for moving vehicle when driving on bumpy road ... 61 Figure 4.25: Ambient vibration analysis for moving vehicle when turning at a corner .... 62 Figure 4.26: Ambient vibration analysis for moving vehicle when driving on rough
surface road ... 63 Figure 4.27: Summary of the tested ambient vibration sources by its acceleration and
x
List of Tables
Table 1.1: Published electromagnetic micro generators ... 3
Table 1.2: Published electrostatic micro generators ... 4
Table 1.3: Published piezoelectric micro generators ... 4
Table 2.1: Advantages and disadvantages of solar energy ... 9
Table 2.2: Typical ADXL 321 specification (Analog.com, 2011) ... 19
Table 3.1: Equipments and devices required for the calibration process ... 25
Table 3.2: G-Link node calibration result summary ... 34
Table 4.1: Result summary of ambient vibrations generated from the electrical appliances ... 64
Table 4.2: Result summary of ambient vibrations generated from the machineries ... 65
Table 4.3: Result summary of ambient vibrations generated from the static vehicle ... 65
Table 4.4: Result summary of ambient vibrations generated from the moving vehicle .... 65
Table 4.5: Summary of the suggested micro generator paired with the respective electrical appliances ... 67
Table 4.6: Summary of the suggested micro generator paired with the respective machineries ... 67
xi
List of Abbreviations
xii
List of Symbols
- Dielectric constant of the piezoelectric material - Net displacement of accelerometer
- Phase
- Object excited angular frequency - Undamped natural frequency - Fundamental resonant frequency
- Damping ratio
Electrical damping ratio
Mechanical damping ratio
- Total damping ratio
- Input acceleration
B - constant related to the distance from the
Piezoelectric layer to the neutral axis of the structure
- Induced damping for electrical - Induced damping for mechanical - Capacitance of the piezoelectric - Damping coefficient
- Piezoelectric charge constant
- Elastic constant for the composite structure - Mechanical stiffness
H - Amplitude
- Piezoelectric material thickness
i - Current
j - Imaginary number
k - Spring constant
xiii
M - Lump mass
m - Accelerometer system lump mass
n - Transformer turn ratio
P - Power
- Maximum power
R - External resistive load
V - Voltage
Y - Amplitude of vibration
y(t) - Displacement relative to the system housing
1
Chapter 1
Introduction
1.1
Introduction
Over the past few years with the advancement of MEMS (Micro-Electro-Mechanical Systems) technology, portable and wireless electronic devices have shown a great increasing range of applications with reductions in cost and size, and increases in functional capability (Mitcheson, P.D., et al. 2008; Bouendeu, E., et al., 2011).
The dependence of these devices on external power supplies and batteries are minimized by using micro generators that generate energy from ambient sources such as thermal gradient, light, radio frequency (RF) and vibration (Mitcheson, P.D., et al. 2008 ; Kok, S.L., et al. 2010). Among these sources, vibration is particularly important due to its abundance and has attracted many interests from researchers and companies in designing vibration based micro generators (Zorlu, O., et al., 2011).
Although there are lots of research works being presented with respect to the vibration based micro generators, however there is insufficient of data pertaining to the vibration frequency and acceleration being investigated and presented in the literature. This data is useful to the researchers who are designing ambient vibration based micro generators and has been a driven force to carry out investigation on useful ambient vibration source for energy harvesting.
2
investigated. The investigation results which comprise ambient vibrations frequency and acceleration are summarized and presented in detail in chapter four.
1.2
Project Objectives
The main aim of this project is to identify on useful ambient vibrations that have a great potential for energy harvesting. In order to achieve the targeted aim, a few objectives as follows have been identified.
1. To investigate on useful ambient vibration source that is within one gravity (1 g = 9.81 m/s2 ) of acceleration. These ambient vibration sources are generated from the vehicles, electrical appliances and machineries.
2. To study and analyze the data in the form of FFT (Fast Fourier Transform) by using appropriate mathematical tool.
3. To summarize and match the identified useful ambient sources with appropriate micro generators developed by other researchers from the literature.
1.3
Problem Statement
Over the last few years, there are a lot of publications and demonstrations have been published and carried out by researchers, academicians and companies over the world in the field of vibration based energy harvesting (Khaligh, A., et al., 2010).
However there is insufficient of information that can be obtained from the literature pertaining to the ambient vibration frequency and acceleration in g-level which are very important in determining the right micro generators for the right ambient vibration sources.
3
frequency of the micro generators are matched with frequency of the vibration sources where they are mounted on and hence optimum electrical power is generated. Explanation on this relation will be discussed in chapter two.
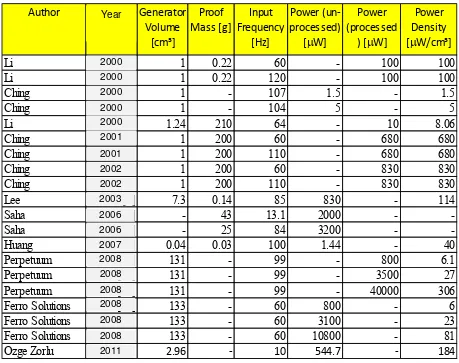
Table 1.1, Table 1.2 and Table 1.3 summarize some of the micro generators that are published in the literature related to electromagnetic, electrostatic and piezoelectric micro generators.
Table 1.1: Published electromagnetic micro generators
Author Reference Generator Volume [cm³] Proof Mass [g] Input Frequency [Hz] Power (un-processed)
[mW]
Power (processed
) [mW]
Power Density [mW/cm³]
Li [3] 1 0.22 60 - 100 100
Li [3] 1 0.22 120 - 100 100
Ching [4] 1 - 107 1.5 - 1.5
Ching [4] 1 - 104 5 - 5
Li [5] 1.24 210 64 - 10 8.06
Ching [6] 1 200 60 - 680 680
Ching [6] 1 200 110 - 680 680
Ching [7] 1 200 60 - 830 830
Ching [7] 1 200 110 - 830 830
Lee [8] 7.3 0.14 85 830 - 114
Saha [9] - 43 13.1 2000 -
-Saha [9] - 25 84 3200 -
-Huang [10] 0.04 0.03 100 1.44 - 40
Perpetuum [11] 131 - 99 - 800 6.1
Perpetuum [11] 131 - 99 - 3500 27
Perpetuum [11] 131 - 99 - 40000 306
Ferro Solutions [12] 133 - 60 800 - 6
Ferro Solutions [12] 133 - 60 3100 - 23
Ferro Solutions [12] 133 - 60 10800 - 81
Ozge Zorlu [33] 2.96 - 10 544.7 - 184
4
Table 1.2: Published electrostatic micro generators
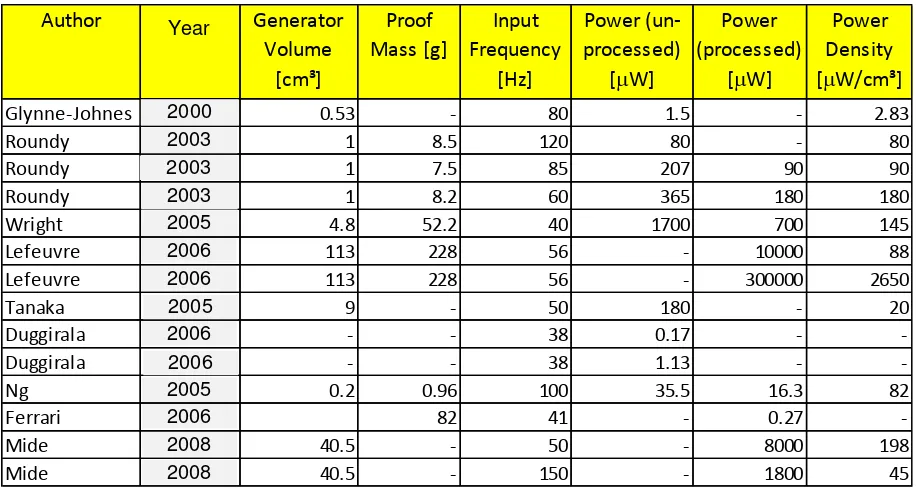
Table 1.3: Published piezoelectric micro generators
1.4
Project Significance
Upon completion of this research, a summary of identified ambient vibration sources will be presented. Important ambient vibration characteristic such as their vibration frequency
Author Reference Generator Volume [cm³] Proof Mass [g] Input Frequency [Hz] Power (un-processed)
[mW]
Power (processed)
[mW]
Power Density [mW/cm³]
Tashiro [13] - 640 4.76 - 58
-Tashiro [14] 15 780 6 36 - 2.42
Miyazaki [15] - 5 45 - 0.21
-Arakawa [16] 0.4 0.65 10 6 - 15
Despesse [17] 18 104 50 1760 1000 56
Tsutsumino [18] - - 20 278 -
-Tsutsumino [19] - - 20 6.4 -
-Mitcheson [20] 0.6 0.12 20 2.4 - 4
Author Reference Generator Volume [cm³] Proof Mass [g] Input Frequency [Hz] Power (un-processed)
[mW]
Power (processed)
[mW]
Power Density [mW/cm³]
Glynne-Johnes [21] 0.53 - 80 1.5 - 2.83
Roundy [22] 1 8.5 120 80 - 80
Roundy [22] 1 7.5 85 207 90 90
Roundy [22] 1 8.2 60 365 180 180
Wright [23] 4.8 52.2 40 1700 700 145
Lefeuvre [24] 113 228 56 - 10000 88
Lefeuvre [24] 113 228 56 - 300000 2650
Tanaka [25] 9 - 50 180 - 20
Duggirala [26] - - 38 0.17 -
-Duggirala [26] - - 38 1.13 -
-Ng [27] 0.2 0.96 100 35.5 16.3 82
Ferrari [28] 82 41 - 0.27
-Mide [29] 40.5 - 50 - 8000 198
Mide [29] 40.5 - 150 - 1800 45
5
and acceleration in g-level will be tabulated. These data can be a very good source of reference to other researchers and companies who are keen to design and develop vibration based micro generators.
1.5
Scope of works
6
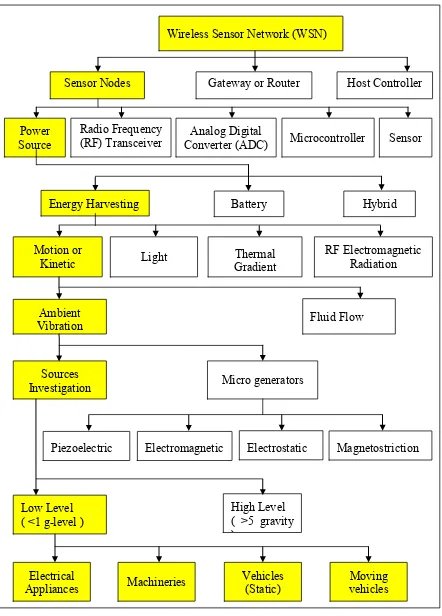
Figure 1.1: Project K-chart
Host Controller Gateway or Router
Sensor Nodes
Power Source
Radio Frequency (RF) Transceiver
Analog Digital
Converter (ADC) Microcontroller Sensor
Energy Harvesting Battery Hybrid
Motion or
Kinetic Light Gradient Thermal
RF Electromagnetic Radiation
Ambient
Vibration Fluid Flow
Sources
Investigation Micro generators
Low Level ( <1 g-level )
High Level ( >5 gravity )
Piezoelectric Electromagnetic Electrostatic Magnetostriction Wireless Sensor Network (WSN)
Electrical Appliances
Vehicles (Static)
7
Chapter 2
Literature Review
2.1
Introduction
The background of wireless sensor network will be presented in this chapter and discussing on the potential energy sources harvested from the ambient environment for powering low-power electronic devices.
In order to investigate the potential ambient environment energy harvesting sources, the mechanism of a few energy harvester or also known as micro-power generators, will be discussed, these include electromagnetic (Zorlu, O., et al., 2011; Amirtharaja, R. And Chandrakasan, A.P., 1998), electrostatic (Meninger, S., 2001) and piezoelectric (Kok, S.L., et al., 2010; Roundy, S. and Wright, P.K., 2004). It is important to know the characteristics of the sources such as the level of acceleration and excitation frequency which are important for designing appropriate energy harvester suit to different energy sources that are available in the surrounding of the energy harvesters.
Since vibration is ubiquitous and available everywhere especially those generated by engines or machines that are in operation. The function of the devices that are being used to measure the ambient environment vibration sources; G-Link and ADXL 321 accelerometer, will be explained in this chapter.
2.2
Wireless sensor network
8
directly or uses other wireless sensor node to forward data to base station (Wilson, J.S., 2005).
The ideal wireless sensor which are networked have a low power consumption, low cost of implementation, smart and software programmable, fast data acquisition and accurate and requiring little intervention by human being in maintaining the devices.
There are a few advantages of wireless sensor network compared to wired sensor. Wired sensors have bundles of lead and fibre optic wire which tend to be broken and connection failure. These impose high installation and long term maintenance cost. Wireless sensor network eliminates these costs and also easy to be installed by eliminating wires and connectors. Wireless sensors which are usually installed remotely and embedded in building require less maintenance and sometime not assessable to be maintained, therefore the electrical power source using battery is the major concern (Wilson, J.S., 2005; Priya, S. and Inman J.D., 2009).
There are few methods to increase the lifetime of sensor nodes. One of which is through power generation, power conservation and power management. Power generation uses environmental sources such as solar, vibration and thermal. Power conservation uses TDMA (time division multiple access) where a node can power down or sleep between its assigned time slots and waking up in time to receive and transmit messages. Power management uses software power management techniques to decrease the power consume by RF sensor node (Lewis, F.L, 2004; Arms, S.W. et al., 2005).
2.3
Energy harvesting sources
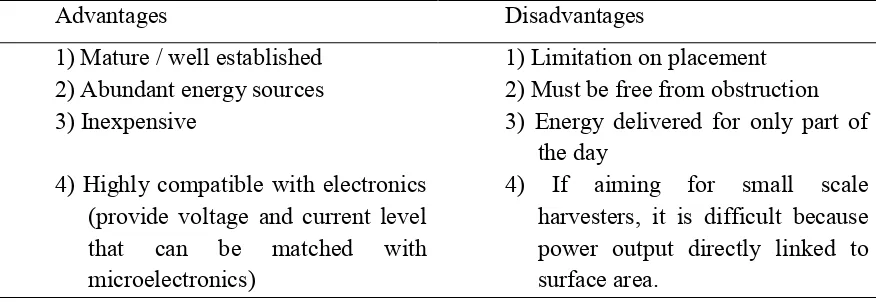
This section aims to provide an overview of energy harvesting sources which are solar, air flow, and vibration. The advantage and disadvantage of energy harvesting sources are also discussed.
9
Table 2.1: Advantages and disadvantages of solar energy
Advantages Disadvantages
1) Mature / well established 1) Limitation on placement 2) Abundant energy sources 2) Must be free from obstruction
3) Inexpensive 3) Energy delivered for only part of
the day 4) Highly compatible with electronics
(provide voltage and current level that can be matched with microelectronics)
4) If aiming for small scale harvesters, it is difficult because power output directly linked to surface area.
Air flow is another potential ambient environment energy harvesting sources. In the atmosphere or wind exist as a result of pressure differences causes by the sun heating up different parts of the atmosphere. Approximately 2% of the sun’s energy reaching the earth is converted into wind energy (Chen, C.T., et al., 2006). Human have used wind as a power source for thousands of years for propelling ships and boats by use of a sail and for milling grain through the use of windmills. The air flow harvesting sources is converted into electrical energy using the large scale wind turbine. Then, a transmission system exists which comprises a hub, main shaft plus bearing, gearbox and three phases AC generator that can be connected to the three phase main supply. The advantage of large scale wind turbine is it can achieve efficiencies of 50% or more. The disadvantages of wind turbine are it has many moving parts and complicated construction. In addition, it cannot easily be miniaturised due to complicated construction.
10
can be intermittent with periods of no vibration. In addition, most vibration harvesting devices are resonant structures and ambient environmental vibration tends to have higher acceleration values at lower frequencies. The smaller the device, the more difficult it is to achieve high acceleration value, therefore generating low electrical output power.
There are many other ambient environment energy sources that can be harvested and converted into useful electrical power, however, vibration source is the most prominent and easy to be harvested by small energy harvester such as piezoelectric and electromagnetic generators. Therefore, vibration source will be the focus in this project.
2.4
Overview of Micro generators
Vibration based micro generators can be classified into three most common type; electromagnetic, electrostatic and piezoelectric. Figure 2.1 depicts these three types of micro generators outlook. Some of these micro generators which published in the literature will be matched with the identified potential ambient vibration sources that are useful for the application of energy harvesting. The general techniques used with respect to these types of micro generators are explained as follows.
2.4.1 Piezoelectric micro generator working principle
11
2.4.2 Electrostatic micro generator working principle
Electrostatic micro generator depends on the variable capacitance of vibration-dependent varactors (Meninger, S., et al., 2001). A varactor, or variable capacitor, which is initially charged, will separate its plates by vibrations; in this way, the change in capacitance causes either voltage or charge increase.
2.4.3
Electromagnetic micro generator working principle
This technique uses a magnetic field to convert mechanical energy to electrical energy (Amirtharajah, R. and Chandrakasan, A.P., 1998). A coil attached to the oscillating mass is made to pass through a magnetic field, which is established by a stationary magnet, to produce electric energy. The coil travels through a varying amount of magnetic flux, inducing a voltage according to Faraday's law.
Figure 2.1 Vibration based energy harvesting micro generators (Roundy, S. and Wright, P.K., 2004;