Investigation of useful ambient vibration sources for
the application of energy harvesting
Mohd Fauzi Bin Ab Rahman
#1, Kok Swee Leong
#2MIEEE
#Faculty of Electronics and Computer Engineering, Universiti Teknikal Malaysia Melaka, Hang Tuah Jaya, 76100 Durian Tunggal, Melaka
1
[email protected] [email protected]
Abstract— Ambient vibration is one of the popular sources for energy harvesting due to its ubiquitous present in almost everywhere. For the past few years it has attracted many interests in the design and development of vibration based micro generators for low power electronic applications. The aim of this paper is to investigate on useful ambient vibration sources which would have great potential for the application of energy harvesting. Commonly the acceleration level of ambient vibration is low, in the range < 1 g-level. In this study, the vibration sources from industries (machinery), home appliances and moving vehicle are compiled and compared with suitable energy harvesters designed by other researchers. It may serve as a good guideline for the researchers in designing resonant devices such as the vibration based micro-power generators.
Keywords— Ambient vibration sources, energy harvesting, low level vibrations, resonant devices, micro-power generator
I. INTRODUCTION
Over the past few years with the advancement of MEMS (Micro-Electro-Mechanical Systems) technology, portable and wireless electronic devices have shown a great increasing range of applications with reductions in cost and size, and increases in functional capability [1][2].
The dependence of these devices on external power supplies and batteries are minimized by using micro-power generators that generate electrical energy by harvesting energy from ambient sources such as thermal gradient, light, radio frequency (RF) and vibration [1-3]. Among these sources, vibration is particularly popular, as it is abundant and present mostly everywhere. Due to this fact, it has attracted many interests from researchers and companies in designing vibration based micro-power generators [4].
Although there are lots of study works being presented with respect to the vibration based micro generators, however there is little information in the literature reporting vibration sources from industries and moving vehicle. Sufficient data is crucial for designing ambient vibration based micro
generators. The current research interest and the issue of insufficient data have been a driven force to carry out investigation on useful ambient vibration sources for the application of energy harvesting. An acceleration of bigger than 50 mg is considered as useful vibration sources for powering low power electronic devices as reported by Torah et al. [10]
In this study, ambient vibrations generated from the household electrical appliances, vehicles and machineries that are useful for energy harvesting will be identified and investigated. The investigation results are compiled and summarized in the terms of frequency and acceleration level.
II. RELATIONOFVIBRATIONFREQUENCYAND ACCELERATIONWITHTHEELECTRICAL
OUTPUTPOWER.
Over the past few years study in the development of micro generator that able to generate optimum power when being mounted on the ambient vibration surface are getting lots of attention from the researchers and companies. Micro-power generators basically can be classified into three most common mechanisms; piezoelectric [5][8][9], electromagnetic [6][1] and electrostatic [7]. In this paper, the working principle and details of each of the mentioned vibration based micro-power generators will not be described in detail. The important issue to be address in this paper is the relationship between the maximum output power generated and vibration sources with various different frequency and acceleration level. In order to explain on the preceding relation, William and Yates’s [8] linear mass-spring damper system model is used to represent the conversion of mechanical energy (vibration) into electrical energy (power).
Figure 1: William and Yates [8] linear mass-spring damper system
In Figure 1, M represents system lump mass, y(t) is the excited net displacement relative to the system housing, k is the spring constant ,z(t) is the produced net displacement while be and bm are damping ratios for the mechanical and
electrical part respectively .
From the model, generated power equation, P in relation with the system natural frequency, ωn and external excited vibration frequency, ω can be derived as in Equation 1 [8]. Equation 2 [2] is the extension of Equation 1, to show the relation of power maximum, Pmaxthat can be obtained with the
input acceleration ain. From Equation 1, an optimum power, P
can be generated if the external excited vibration frequency,ω
matches with the system natural frequency, ωn. In addition to that, as shown in Equation 2, maximum power, Pmax can be
obtained if the excited vibration input acceleration, ain is high.
ܲ ൌ
ெζఠయቀഘ ഘቁ
య మ
ቂଶζቀഘഘቁቃమାଵିቀഘഘቁమ൨మ
(1)
ܲ
௫ൌ
ெζ మସఠሺζାζሻ (2)
From Equation 1 and 2, ζT is the total damping ratio, ζe and ζm
refer to the damping ratio of electrical and mechanical part. III. DATAACQUISITIONSET-UP
In this study, 3 dimensional wireless accelerometer node, G-Link as shown in Figure 2 is used to measure the ambient vibration sources. In order to ensure that the measurement is correct, ADXL 321 accelerometer is used to calibrate the device.
ADXL 321 is a MEMs accelerometer that has dynamic range of ±18g and sensitivity of 57mV/g. G-Link node is embedded with ADXL 202 accelerometer with dynamic range of ±2g and can measures vibration in three different orientations; X, Y and Z. G-Link wireless accelerometer is chosen for the monitoring of ambient vibration source due to the reasons that it is small, portable and can be mounted easily even at a crowded space.
To make measurement and monitoring the ambient vibration sources using G-Link, the device has to be mounted firmly on the surface of the vibration sources, ideally either bolted to the surface or mounted with strong magnet. Once the accelerometer node is secured, the G-Link firmware is used to activate the Link triggering process. Once the G-link is triggered, it captures the vibration raw data from the vibration sources. This data is then transmitted wirelessly to the analog base station and finally the data is processed by the host computer. The analog base station is connected to the host computer via USB connection. The data is then further analysis using a software provided by the manufacturer, where
the raw data which is in the time domain is transformed into frequency domain by using FFT, so that, the processed data in the terms of vibration frequency and acceleration level can be clearly presented. Figure 2-3 show the photographs of a G-Link wireless accelerometer node and the Analog base station respectively.
(a) (b)
Figure 2: G-Link (a) 3 dimensional wireless accelerometer node and (b) analog base station.
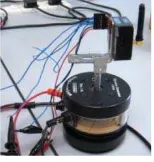
A. Calibration process set-up
In the calibration process a shaker as shown in Figure 4 is used to convert the electrical signal from a function generator into mechanical vibration. The generated vibration will be captured by both accelerometer ADXL 321 and G-Link accelerometers which are being mounted firmly on the shaker stand. In the set-up process, a sinwave signal from a function generator with frequency that varies at 30Hz, 50Hz and 70Hz were applied to the shaker after one another while the amplitude of the power input from the function generator was kept constant at maximum level. The results obtained from both accelerometers; ADXL 321 and G-Link node were compared in the terms of vibration frequency and acceleration level. Data from ADXL 321 can be directly observed from the Digital Oscilloscope while raw data captured by the G-Link node need to be processed first by using FFT feature in the Matlab, so that the required vibration frequency and acceleration with respect the input signal being applied can be obtained.
Figure 2 G-Link accelerometer calibration set-up
Figure 4 Close-up look of the ADXL 321
Figure 3 shows the devices and equipments used in the G-Link accelerometer calibration process while Figure 4 and 5 show the position of the ADXL 321 and G-Link node being mounted on the shaker stand.
B. Calibration result
The comparison results with respect to each of the generated vibration frequency are summarized in TABLE I. From the table, it can be observed that the results obtained from ADXL 321 for excitation frequency of 30Hz, 50Hz and 70Hz from the function generator are about same as the results obtained from the G-link node. For an example, at an excitation of 30Hz, the computed vibration frequency recorded from ADXL 321 is 33Hz with acceleration value of 2.88g while for G-Link node the computed vibration frequency is 30 Hz with acceleration value of 3.1 g. Thus based on the finding, it can be concluded that G-Link is reliable to be used in the next process; monitoring of ambient vibration sources.
TABLE I
G-LINK CALIBRATION RESULT
C. Mounting of G-Link node
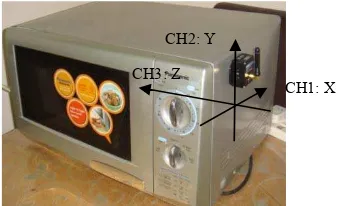
Before proceeding with the monitoring of ambient vibration sources, one of the considerations that need to be taken into account is the mounting condition of G-Link node. G-Link node has three channels; 1, 2 and 3. Each of the channels represents the orientation of X, Y and Z directions. Figure 6 illustrates the position of the G-Link node being mounted on the tested ambient vibration surface which is in this case is a microwave oven. Besides the orientation of G-link node, it also has to be mounted firmly on the vibration
surface to minimize the dissipation of vibration that will affect the accuracy of the reading.
Figure 5 G-Link positioning on the mounted vibration surface
Figure 6 Magnet is fixed at G-Link node
In this case, a pair of magnet is fixed to the G-Link node at its right and left edge as shown in Figure 7 so that it can hold the G-Link node firmly when it is mounted on the iron based ambient vibration source enclosure. This is crucial, especially for vibration sources which are having high level of excitation and moving vehicles.
IV. VARIOUSAMBIENTVIBRATIONSOURCES ANALYSISRESULT
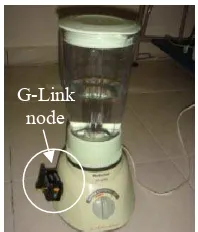
In this paper, various ambient vibration sources that can be categorised as household electrical appliances, machineries, and moving vehicles are presented. These items can be good vibration sources for the application of energy harvesting when an appropriate vibration based micro generator that has natural frequency matches to the external vibration frequency are attached together. In the following sub-topics, the summary of findings in the terms of vibration frequency and acceleration level of the respective items are presented. 1) Electrical housing appliances: Within this category, various electrical housing appliances such as, blender, stand fan, microwave, and alike that generate vibration are investigated. Figure 8 shows a picture of Panasonic MX-895N Blender which is being analyzed. In this study, blender with water as the load is measured by mounting the G-link node at the side surface of the blender bottom housing. Result from the study is shown in Figure 9-10 which represent the time domain of the signal and the computed frequency domain respectively. From Figure 10, it can be observed that the generated vibration prominence frequency is 216.2Hz with acceleration level of 0.64g.
Frequency
[Hz] Acceleration [g]
Frequency
[Hz] Acceleration [g]
30 33 2.88 30 3.1
50 50 1.19 50 1.2
70 75 0.62 70 0.69
Shaker input frequency
[Hz]
ADXL 321 G-Link
Digital Oscilloscope Matlab
CH1: X CH2: Y
CH3: Z
Figure 7 : Blender being tested by the G-Link node
Figure 8 : Blender time domain signal
Figure 9 : Frequency domain of signal
Table II summarizes all of the measured electrical housing appliances with its respective vibration frequency and acceleration level. From the table, it can be observed that the blender, standing fan, vacuum cleaner and microwave oven recorded relatively high level of acceleration, which is good for the application of energy harvesting.
2) Machineries: Within this category, a few types of machines that generate significant vibrations are monitored for the application of energy harvesting study. Summary of the results are presented in the following TABLE III. As depicted in the table, vibration generated from the grinding machine shows a significance level of acceleration of 0.358g at the prominence frequency of 49Hz. This can be a great source for the application of energy harvesting if an appropriate micro generator is mounted on the vibration source.
3) Vehicle (stationary condition): In this category, vibration generated from motorcycle and car in stationary condition while the engine is running are analysed. Results of the vibration analysis are summarized in the following TABLE IV.
The tested sample used in the analysis is Toyota Vios 1.5cc car year 2008 and Honda Wave 125 series year 2008. In the study, the G- Link node is mounted on the bonnet of the car and near the engine of the motorcycle as shown in Figure 11-12.
4) Vehicle (Moving condition) : In this category, vibration generated from Toyota Vios 1.5cc car year 2008 when it is driven under various road condition is analysed. Results from the study are monitored and summarized in the TABLE V. From the table, it can be observed that the recorded acceleration level is relatively low when the car is in the moving condition compared when it is in stationary condition, while the recorded vibration frequency shows no significance different in value.
Figure 10 G-Link is mounted on the Toyota Vios car
Figure 11 G-Link is mounted on the Honda
Wave 125 motorcycle
TABLE II
SUMMARY OF VIBRATION ANALYSIS WITHIN ELECTRICAL HOUSING APPLIANCES CATEGORY
No. Tested items / products Acceleration (g)
Frequency (Hz) Remarks
1 Cradle (STAR) 0.057 1 With infant 4kg weight 2 Threadmill (Reebok) 0.006 26 Without load 3 Air Handling Unit 0.1 33
-4 Washing Machine 0.03 39 Spinned without load 5 Laptop (Lenovo) 0.01 90
-0.611 100 Low speed 0.422 100 Medium speed 0.412 100 High speed 7 Vacuum Cleaner 0.158 100 -8 Cooking Hood (Elba) 0.06 100
-0.032 100 Low speed 10 Water Heater (Panasonic 0.006 100 -11 Refrigerator (Panasonic) 0.002 100 -12 Desktop (HP) 0.004 120 -13 Microwave (Panasonic) 0.114 200 -14 Ventilating Fan 0.03 214
TABLE III
SUMMARY OF VIBRATION ANALYSIS WITHIN MACHINE CATEGORY
TABLE IV
SUMMARY OF VIBRATION ANALYSIS FOR VEHICLE UNDER STATIONARY CONDITION
TABLE V SUMMARY OF VIBRATION ANALYSIS FOR VEHICLE UNDER MOVING CONDITION
V. INVESTIGATIONRESULTSUMMARY AND DISCUSSION
For a better view and analysis of overall ambient vibrations monitored data, a plot of acceleration and vibration frequency that contains the tested ambient vibration sources is presented in Figure 13. From the figure it can be observed that many of the tested ambient vibration sources are located in the lower left region of the acceleration level-frequency plot, which is in the frequency range of 0-100Hz and acceleration below than 0.2g. There are only a few with acceleration level bigger than 0.2g like the blender, standing fan and grinding machine. As mentioned in the preceding topic, the higher the acceleration level for a vibration source, the more power that can be generated by a micro-power generator harvesting energy from the vibration source. In this scenario, blender generates relatively high acceleration level which is the best among all the investigated vibration sources for energy harvesting followed by stand fan, grinding machine and stationery car engine.
Figure 12 Most ambient vibration sources investigated are in the region of 0-100 Hz at low level acceleration below 200 mg
result summary plotted by its acceleration and frequency
VI. CONCLUSION
At the end of the study, a compilation of various ambient vibration sources that comprise electrical housing appliances, machineries and vehicles in both stationary and moving condition with their computed vibration frequency and acceleration level results are presented. These two parameters are vital in determining the right micro-power generator to be used, so that optimum power can be harvested from the vibration source for the application of energy harvesting. The relation between the harvested power, P with the ratio of the external excited vibration frequency,ω and the system natural frequency, ωn also is explained. According to the prescribed relation, more power can be harvested if the external excited vibration frequency, ω is closely or match to the system natural frequency. In this case, the system used here refers to the micro-power generator. The relation between the maximum power, Pmax with the input acceleration value, ain
also is discussed.
From the result summary, a few of the tested ambient vibration source such as blender, stand fan, vacuum cleaner grinding machine, AHU and car generate vibration with relatively high acceleration value that are useful for the application of energy harvesting.
REFERENCES
[1] P. D. Mitcheson, et al., "Energy Harvesting From Human and Machine Motion for Wireless Electronic Devices," Proceedings of the IEEE, vol. 96, pp. 1457-1486, 2008.
[2] E. Bouendeu, et al., "A Low-Cost Electromagnetic Generator for Vibration Energy Harvesting," Sensors Journal, IEEE, vol. 11, pp. 107-113, 2011..
[3] W. J. Li, T. C. H. Ho, G. M. H. Chan, P. H. W. Leong, and H. Y. Wong, “Infrared signal transmission by a laser-micro machined No. Tested items /
(Mc D&D) 0.358 49 Without load 2 CNC Machine 0.022 83 With load
3 Milling Machine
(Enrique Holke) 0.018 140 With load 4 Lathe Machine 0.033 298 With load
No. Tested items /
Wave 125) 0.031 17 Year 2006
2 Car (Toyota Vios
-1.5cc) 0.197 25 Year 2008
No. Road or driving conditions
Acceleration (g)
Frequency (Hz) Speed
1 Rough surface 0.027 25 20-30 miles/hr
2 Straight road 0.013 25 10-20 miles/hr
3 Bumpy road 0.057 22 10-20 miles/hr
vibration-induced power generator,” in Proc. 43rd IEEE Midwest Symp. Circuits Syst. 2000, Aug. 2000, vol. 1,pp. 236–239.
[4] O. Zorlu, et al., "A Vibration-Based Electromagnetic Energy Harvester Using Mechanical Frequency Up-Conversion Method," Sensors Journal, IEEE, vol. 11, pp. 481-488, 2011.
[5] C.B. Williams and R.B. Yates, “Analysis of a micro-electric generator for Microsystems,” Transducers 95/Eurosensors IX, 1995: p. 369-372. [6] R. Amirtharajah and A. P. Chandrakasan, "Self-powered signal
processing using vibration-based power generation," Solid-State Circuits, IEEE Journal of, vol. 33, pp. 687-695, 1998
[7] S. Meninger, J.O. Mur-Miranda, R. Amirtharajah, A.P. Chandrakasan, & J.H. Lang, “Vibration-to-electric energy conversion” IEEE
Transactions on Very Large Scale Integration (VLSI) Systems, 9 (1), pp.64-76, 2001.
[8] S.L Kok, N. White, and N. Harris, “Fabrication and characterisation of free-standing thick-film piezoelectric cantilevers for energy harvesting”. Measurement Science and Technology,.2009
[9] S. Roundy, and P.K. Wright, “A piezoelectric vibration based generator for wireless electronics,” Smart Materials and Structures, IOP, 2004. 12: p. 1131-1142.
![Figure 1: William and Yates [8] linear mass-spring damper system](https://thumb-ap.123doks.com/thumbv2/123dok/555246.65414/1.595.362.501.577.678/figure-william-yates-linear-mass-spring-damper.webp)