The Effect Of Thermoelectric Power Generator (TEG) Based Hi-Z Thermoelectric Modules On The Performance Of 1.3L 4G13 Wira Engine.
Bebas
24
0
0
Teks penuh
Gambar
+3
Dokumen terkait
The CI engine shows the same output power, diesel replacement ratio, brake thermal efficiency, and specific fuel consumption when it is operated with and without
Figure 3 Temperature–entropy diagram for ORC WHRPG The low energy conversion efficiency of 12.5 percent to that of the thermal power input from AQC and SP waste heat may seem
17 Position of Inlet and Outlet of the Airflow 28 18 Meshing of Water Tube with Water Cooling 30 19 Assemble of thermoelectric cooler with heat sink screwed with fan 32 20
We design the optimum aspect ratio of a cuboid thermoelectric leg to maximize the power output and extend this design to the mechanically stiff cellular architectures of hollow
Furthermore, with the syngas fuel derived from coal or heavy residue oil, the present simulation method investigates the overall cycle efficiency, the power output, the pressure ratio
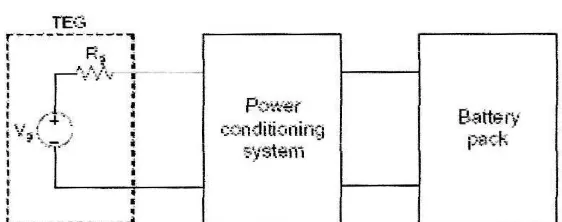
Nomenclature IL Total current drawn in the circuit Pmax Maximum TEG power ouput PTEG TEG power output PTEG-exp TEG power output obtained through experiment Qc Heat transfer rate
The formula applied to calculate the efficiency of a PV module is as follows [39]-[42]: 𝜂 = 𝑃 𝐸 × 𝐴𝑥100% 1 where, P is the output power Wp, E is the solar irradiance W/m², and A =
Figure 7.14 shows the measured output power and DC-to-rf conversion efficiency versus the drain bias voltage at three different gate bias voltages.. The gate biases are slightly above
