IN INDONESIA
IRMA SHITA ARLYZA
GRADUATE SCHOOL
BOGOR AGRICULTURAL UNIVERSITY
BOGOR
I, hereby, declare that the dissertation on Molecular Identification of Himantura
uarnak Species Complex (Batoidea: Dasyatidae) in Indonesia is true of my work under the
guidance of the supervising committee and has not been submitted in any form to other university. Information sources derived or quoted from works published and unpublished from other writers mentioned in the text and listed in the Bibliography at the end of this dissertation.
I, hereby, bestow the copyright of my manuscript to the Bogor Agricultural University.
Bogor, July 2013
IRMA SHITA ARLYZA. Molecular identification of Himantura uarnak species complex (Batoidea: Dasyatidae) in Indonesia. Supervised by DEDY DURYADI SOLIHIN, DEDI SOEDHARMA and PHILIPPE BORSA.
Stingrays are one of the cartilaginous fish, apart of sharks and skates, and one of Indonesia's fishery resources. Almost of elasmobranch fishes are economically important fish. The refined products and live specimens of this fish are a lot of traded. Himantura
uarnak, H. undulata and H. leoparda are stingray species in Himantura and Dasyatidae
family, which are the most popular stingrays in Indonesia waters. The stingrays are major target species were used as a consumable product and trading products. Levels of species diversity of cartilaginous fish in Indonesia are very high, and also Indonesia is listed as one of the countries that use elasmobranch resources the highest in the world.
Generally, this study aims to identify each species of H. uarnak species complex through molecular approaches. While specifically, this study aims to estimate the evolutionary process of species divergence and to determine the relationship between species. The methods were used in this study included field sampling, sample collection, and specimen identification, collection of genetic samples, analysis of genetic samples and data analysis .
Size polymorphism nuclear DNA markers (intron EPIC) were used. Polymorphism alleles translated into genotypes and alleles frequency of five introns loci. The results of Bayesian analysis and Correspondence Analysis (CA) produced informative diagram of the population structure showed 4 different clusters. Cluster 1 and 4 were H. leoparda, Cluster 2 indicated as H. undulata and the Cluster 3 was H. uarnak. Cluster 1 was a variant of Cluster 4, in this time called as H. leoparda var.1. Separation of four clusters according to nuclear DNA need to be proved by mitochondria DNA maker by cytochrome c oxidase subunit I (COI) and cytochrome b (cyt b).
Molecular approaches were using mitochondrial DNA gene cytochrome c oxidase subunit I (COI) and cytochrome b produced 4 main groups (Group I, II, III and IV). Both of these molecular approaches showed each individual of groups were in consistent clade and the main group. Hence the H. uarnak species complex in Indonesian waters were divided into 4 main groups, and each was a particular species. The Group I and IV were the two group species that have been released as H. leoparda and Group I was H. leoparda var. 1 identified as cryptic species. Group II was one individual who grouped as H. undulata. Group III was one of other group that identified as H. uarnak and in accordance with the morphological characteristic through spotting pettern.
IRMA SHITA ARLYZA. Identifikasi Molekuler Kompleks Spesies Himantura uarnak (Batoidea: Dasyatidae) di Indonesia. Dibimbing oleh DEDY DURYADI SOLIHIN, DEDI SOEDHARMA dan PHILIPPE BORSA.
Ikan pari atau adalah salah satu dari ikan bertulang rawan, selain dari hiu dan skate dan merupakan salah satu sumberdaya perikanan Indonesia. Hampir keseluruhan ikan elasmobranch merupakan ikan ekonomis penting, produk hasil olahan dan spesimen hidup dari ikan ini banyak di perdagangkan. Himantura uarnak, H. undulata dan H. leoparda adalah ikan pari dari genus Himantura dari famili Dasyatidae, yang merupakan ikan pari paling populer di perairan Indonesia. Ikan pari tersebut merupakan target tangkapan utama yang dimanfaatkan sebagai produk konsumsi dan produk perdagangan. Tingkat keragaman spesies ikan bertulang rawan (elasmobranch) di Indonesia sangat tinggi dan Indonesia juga tercatat sebagai salah satu negara yang memanfaatkan sumber daya ikan elasmobranch (ikan pari dan hiu) tertinggi di dunia.
Secara umum penelitian ini bertujuan untuk mengidentifikasi masing-masing spesies dari kompleks spesies H. uarnak melalui pendekatan molekuler. Sedangkat secara spesifik, penelitian ini bertujuan untuk memperkirakan proses evolusi divergensi spesies dan untuk mengetahui hubungan antar spesies. Metode yang dilakukan pada penelitian ini mencakup pengambilan sampel di lapangan, koleksi sampel, specimen dan identifikasi, koleksi sampel genetik, analisis sampel genetik dan analisis data.
Pendekatan molekuler telah menggunakan marker genetik EPIC intron dari DNA inti menghasilkan ukuran polimorfisme. Polimorfisme alel-alel diterjemahkan dalam bentuk genotipe dan frekuensi alel-alel dari 5 lokus intron. Hasil analisis Bayesian dan Correspondent Analysis (CA) menghasilkan diagram informatif dari struktur populasi yang menunjukkan 4 cluster yang berbeda. Cluster 1 dan 4 merupakan H. leoparda, Cluster 2 terindikasi sebagai H. undulata dan Cluster 3 merupakan H.uarnak. Cluster 1 merupakan varian dari Cluster 4, untuk saat ini disebut sebagai H. leoparda var.1. Pemisahan empat group spesies menurut DNA inti perlu dibuktikan dengan menggunaan maker genetik DNA mitokondria, gen cytochrome c oxidase subunit I (COI) and cytochrome b (cyt b).
Hasil pendekatan molekuler menggunakan DNA mitokondria gen COI dan cyt b menghasilkan 4 group utama (Group I, II, III dan IV). Kedua pendekatan molekuler tersebut menunjukkan masing-masing individu dari setiap kelompok konsisten berada dalam clade dan group utama. Karenanya, kompleks spesies H. uarnak di perairan Indonesia terbagi menjadi 4 group masing-masing merujuk pada spesies tertentu. Hasil pendekatan molekuler, Group I dan IV merupakan dua kelompok spesies yang telah dirilis sebagai H. leoparda dan Group I (H. leoparda var. 1) teridentifikasi sebagai spesies samar (cryptic species). Group II merupakan satu individu yang mengelompok sendiri sebagai H. undulata. Group III merupakan satu kelompok lain yang teridentifikasi sebagai H. uarnak dan sesuai dengan karakteristik morfologi melalui pola retikulasi.
Pendekatan morfologi untuk mengidentifikasi ikan pari dari kompleks spesies
Himantura uarnak terlihat jelas kurang akurat daripada pendekatan molekuler. Pendekatan
morfologi sebaiknya tidak digunakan untuk mengidentifikasi spesies kompleks pada ikan pari tanpa bantuan dengan pendekatan lain.
© Copyright belongs to IPB, 2013
Copyright protected by laws
Prohibited quoting part or all of this paper without including or citing sources. Citations only for educational purposes, research, writing papers, preparing reports, writing criticism, or review a matter, and it does not disserve the interests of Bogor Agricultural University
IN INDONESIA
IRMA SHITA ARLYZA
Dissertation is submitted in partial fulfilment of the requirements for doctoral degree in Study Program on Animal Bioscience
GRADUATE SCHOOL
BOGOR AGRICULTURAL UNIVERSITY
BOGOR
The examiners of close examination: Dr. Achmad Farajallah, M.Si
Dr. Hawis Maduppa, M.Si
The examiners of open examination: Dr. Zainal Arifin, MSc
Name : Irma Shita Arlyza
NIM : G362090021
Approved Advisor Committee
Dr. Ir. Dedy Duryadi Solihin, DEA Main Advisor
Prof. Dr. Ir. Dedi Soedharma, DEA Philippe Borsa, PhD
co-Advisor co-Advisor
Acknowledged by
Head of Study Program on Dean of Graduate School,
Animal Biosciences Bogor Agricultural University
Dr. Ir. R. R. Dyah Perwitasari MSc Dr. Ir. Dahrul Syah, MScAgr
Praise and gratitude, I must express to God for all the bequests so tthis scientific work has been successfully completed. The selected theme in the research conducted since October 2011 is the species complex, with the title of Molecular Identification of Himantura uarnak Species Complex (Batoidea: Dasyatidae) in Indonesia. This dissertation contains six chapters constituting the development of the articles submitted to scientific journals. Research on morphological approach entitled Distribution patterns of morphological, species and sex on
Himantura uarnak species complex are in the process of review in Journal Science series
Makara. Chapters 2, 3 and 4 entitled Species boundaries in the Himantura uarnak species complex (Myliobatiformes: Dasyatidae) has been published in Molecular Phylogenetics and
Evolution 66, 429-435.
I would like to extend my gratitude to Dr. Ir. Dedy Duryadi Solihin, DEA, Prof. Dr. Ir. Dedi Soedharma, DEA and Philippe Borsa, PhD who serve as my advisors, as well as Dr. Taslim Arifin and Dr. Patrick Berrebi who have provided advice and input. I am grateful to Dr. Zainal Arifin and Dr. Jean-Paul Toutain bridging the communication between Philippe Borsa, PhD and me. I would also like to thank to my colleagues, Terry L. Kepel, M.Sc, M. Ramdhan, MT., Sunuddin Adriani, M.Si, Dr. Nurlisa A. Butet, MSc and Annawaty, M.Si who helped and contributed ideas and suggestions. My appreciation must also be extended to fellows, either directly or indirectly contributed to this paper. My special gratitude to my beloved husband Dr. Taslim Arifin, my brothers and sisters and also the entire extended family of Dhinul Chir Em Nur BA and Arifin for their love, support, and prayer.
Finally, I hope that this scientific paper will be benefit to the advance of science and public community.
Page CHARACTERIZING Himantura uarnak SPECIES COMPLEX
5
3 CYTOCHROME C OXIDASE SUBUNIT I (COI) MARKER OF Himantura
uarnak SPECIES COMPLEX
5 DISTRIBUTION PATTERN OF MORPHOLOGICAL, SPECIES AND SEX OF
1.1 Specific distribution of Himantura uarnak species complex in Indonesia waters 3 2.1 Target genes, primer names, and sequences of each primers on EPIC marker 7
2 The application of primers Act-2-F/Act-2-R and Cam-3-F/Cam-3-R on several fish that have been investigated by Atarhouch et al. (2003)
8
3 The application of primers Act-2-F/Act-2-R and Cam-3-F/Cam-3-R on Himantura
uarnak species complex
10 4 The alleles frequency of 5 polymorphic intron loci on Himantura uarnak species
complex
12 3.1 The samples collection of Himantura uarnak species complex in each sampling
locations
16
2 The target of gene, the primers name and total PCR product of COI genetic marker
17 3 Nucleotide variations based on observations of the individual number of ingroup
and outgroup by COI genetic marker
19
4 Variation of unique nucleotides in each representative of Indonesia ingroup by COI genetic marker
23 4.1 The primers name, the target gene and total PCR product of cyt b marker 30
2 Nucleotide variations based on observations of the individual number of ingroup and outgroup by cyt b marker
32
3 The comparison on each group between Indonesia ingroup (n = 113), Manjaji (2004) and Zanzibar samples
35 4 Variation of unique nucleotides in each representative of Indonesia ingroup by cyt
b marker
37
5.1 The number of individual on Himantura uarnak species complex based on species and sex
41 2 The number of individual on Himantura uarnak species complex based on
spotting pattern and sex
Page
1.1 Flowchart of Framework 4
2.1 Sampling locations of Himantura uarnak species complex 7
2 The position of intron-2 in Actin gene from the Oryzias latipes (AB015886) (Kusakabe et al. 1998, 1999; Atarhouch et al. 2003)
8 3 The position of intron-3 in Cam gene from the Xiphias gladius (AF069913)
(Chow and Takeyama 2000; Atarhouch et al. 2003)
8
4 The alleles polymorphism of Cam-3 locus intron 10
5 Clustering formation based on Correspondent Analysis (CA) use genotype data 11 6 The result of Bayesian population structure analysis, where it was match to
Correspondent Analysis (CA)
13 3.1 DNA fragments along ± 680 bp was amplification product of partial COI 18 2 Chromatogram of sequencing results of DNA fragments along ± 680 bp 18 3 Phylogeny tree of Himantura uarnak species complex (COI) along 620 bp 22 4.1 Schematic diagram of marker cyt b on stingray according to Sezaki et al. (1999)
and Richards et al. (2009)
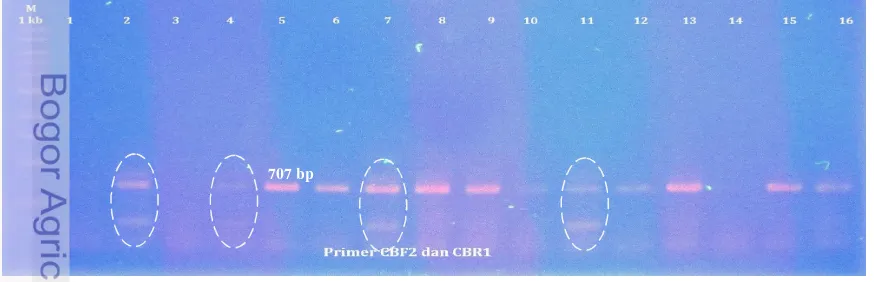
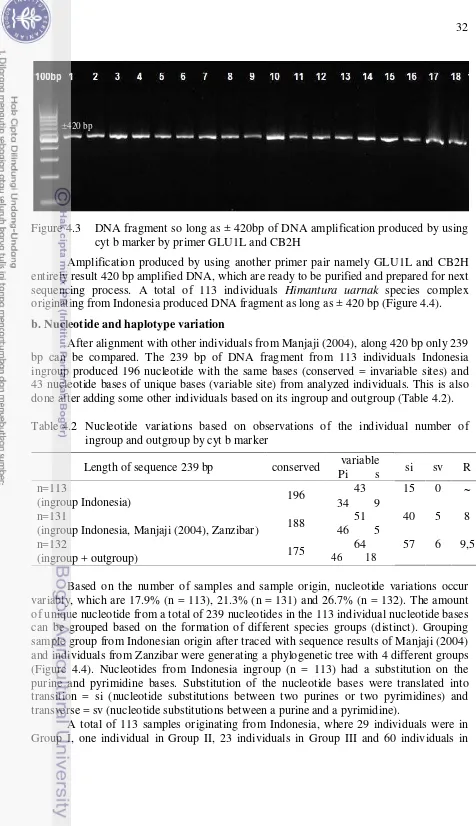
30 2 DNA amplification using alternative primer of cyt b (CBF2 and CBR1) 31 3 DNA fragment along the 420bp of DNA amplification using cyt b marker by
primer GLU1L and CB2H
32
4 The phylogeny tree of Himantura uarnak species complex based on cyt b marker along the 239 bp
34 5 The phylogeny tree of Himantura uarnak species complex based on cyt b marker
along the 420 bp
36
5.1 Measurement of the length and width of Himantura uarnak species complex 40
2 Clasper, male genitalia on stingrays 41
3 a. Juvenil of H. uarnak 42
b. Adult of H. uarnak 42
4 a. The pearl of H. uarnak 42
b. The pearl of H. undulata or H. leoparda 42
Page
1 Data collection of Himantura uarnak species complex in Indonesia 55 2 Five locus intron polymorphic on Himantura uarnak species complex 58 3 The equation pattern of alleles combinations at 5 locus intron polymorphic 61 4. Genotype distribution of alleles based on five locus introns polymorphic and the
location of Himantura uarnak species complex
62 5 Base variation of Group I in nucleotide diversity of species ingroup Indonesia by
COI genetic marker
63 6 Base variation of Group II in nucleotide diversity of species ingroup Indonesia by
COI genetic marker
64
7 Base variation of Group III in nucleotide diversity of species ingroup Indonesia by COI genetic marker
65 8 Base variation of Group IV in nucleotide diversity of species ingroup Indonesia by
COI genetic marker
66
9 Haplotype variation of ingroup Indonesia (n=111) by COI and cyt b genetic marker
67 10 Base variation of Group I in nucleotide diversity of species ingroup Indonesia by
cyt b genetic marker
68 11 Base variation of Group II in nucleotide diversity of species ingroup Indonesia by
cyt b genetic marker
69
12 Base variation of Group III in nucleotide diversity of species ingroup Indonesia by cyt b genetic marker
70 13 Base variation of Group IV in nucleotide diversity of species ingroup Indonesia by
cyt b genetic marker
71
14 The pattern of grouping based on species group vs type of spotting patterns (n = 67) 72 15 Figure of each individuals of Himantura uarnak species complex in Indonesia
waters
CHAPTER I INTRODUCTION
Background
The elasmobranch fishes (sharks and stingrays) are the cartilaginous fishes and become one of the fishery resources in Indonesia. Almost all the elasmobranch fish is important economically fish where the refine product and live specimen are heavily traded. Indonesia is also listed as one of the countries that most larger utilize the elasmobranch resources in the world, with conjucture the catch was 105,000 tons in 2002 and 118,000 tons in 2003. After that years, the elasmobranch fish catch has decreased up to 98 300 tons in 2006 (Tull 2009). High market demand for elasmobranch fish product triggers the fisheries industry to maximally reach the production target without consider the stocks sustainability in nature. One of the peculiarities elasmobranch fish is they have a low growth pattern and low reproduction. An Intensive catch activity without control has caused the depletion of elasmobranch fish resource in Indonesia. Although Indonesia listed as a country with the highest production of elasmobranch fish, however not many studies or publications conducted in Indonesia (White et al. 2006).
Stingray is one of the cartilaginous fishes beside sharks and skates. In Indonesia, the skin and the meat of the stingrays are the favorite part. Himantura uarnak, H. undulata
and H. leoparda are stingrays belonged to genus Himantura under family Dasyatidae
which is the most popular stingrays in Indonesian. These stingray are the major targets that utilised as consumable product and other trading products as handbags, wallets, belts and other accessories (Adrim 2008). Stingray fisheries conditions in Indonesian is not differ from sharks that undergone over exploitation. According to the Fisheries Statistics (2010), from 6 recorded stingrays species, only flower ray and leopard whipray show an average increasing of 1.46% in 2000-2010. Generally, stingray production decreased in 2005 to 2008, and slightly increased in 2009 and decreased again in 2010 by 16.49%. In general, only one stingrays species that has increased production is manta ray despite fluctuations in production still continued from 2005 to 2010. Whereas, production of another 3 stingray decreased, even there is no record of production since 2000 to 2004. Regulation and supervision are still very low toward exploitation and trading of stingray products in Indonesia. Very limited data collection, referring to the collections of the Museum of Zoology Bogoriense in Cibinong, and until now the new collection reaches 56 identified species in Indonesian waters (White et al., 2006), however this number only covers 11.2% from total stingray that exist in the world that predicted around 500 species (Tricas & Taylor 1997). These data are needed for reference in conservation and monitoring planning efforts (Anak 1997). Species from genus Himantura such as H. uarnak, H.
undulata and H. leoparda are species of stingray that still widely studied, because of
frequent errors in identification. Conventional identification of the stingray is done according to morphological characteristics including both reticulation patterns (spotting pattern) and disk form. Manjaji-Matsumoto & Last (2008) have described new species (H.
leoparda) formerly misidentified as “H. undulata“. However, the description of H.
leoparda relies on morphology exclusively, while molecular markers are new available to assess species boundaries. Therefore a comprehensive research using molecular approaches is expected to answer such doubts.
associated with the geographical distribution patterns and the origin of the gene marker, known as phylogeography (Knowlton et al. 1993; Knowlton et al. 2000; Emerson et al. 2011). Phylogeography can explain how populations spread and adapt to the local environment from the initial population and evolved until now. Genetic differences between populations may be used in determining stock structure (Randi & Lucchini 1998).
Beside marker from the mitochondrial genome, using marker from the nuclear genome as intron 3 of calmodulin gene (CAM), intron 1 from S7 ribosomal protein (RP), intron 6 of creatine kinase gene 6B (CK6B), and intron 2 from actin gene (Act2), is expected to clarify the species status and internal diversity of each species. That molecular markers beside able to identify populations can also describe the genetic characteristics of the population (Berrebi et al. 2006). Introns are noncoding sequences that criss-cross in the genes and more varied due to selective pressures in intron regions that much lesser than in the exon region. Intron has the most varied of polymorphism length, so that widely used as molecular markers because it has many desirable characteristics. For example, introns have specificity, codominant and neutral compared to the complementary DNA (cDNA) (Yang et al. 2007). To get the polymorphism properties and strengthens intron, PCR primers designed for the flanking exons, which are known as exon-primed intron-crossing (EPIC) approach (Palumbi & Baker 1994; Bierne et al. 2000; Creer, 2007). This approach has several advantages: (i) by using primers from heterologous genes, cloning and sequencing from target sequences can be avoided, (ii) amplification crossspecies will be easier than when primers designed in exon noncoding sequences because the sequence is more conserved across species, (iii) for the same reason in the species, PCR artifacts such as null alleles are expected to be further reduced (Palumbi & Baker 1994; Palumbi 1995; Bierne et al. 2000).
Species complex is a group of closely related species, where boundaries among species are unclear and usually incomplete reproductive isolation. Example for species complex are ring species, superspecies and cryptic species. This condition can be caused by the rapid speciation so that the separation mechanism was not fully developed. These events can cause some paraphyletic species in species level and hybrids, that causing difficulties in phylogenetic analysis (Mayr 1992, Irwin et al. 2001; Queiroz 2007).
Neotrygon kuhlii lineage in the Indo-West Pacific (IWP) is separated and closely related to
the separation of the geographical area. Observations have been made against N. kuhlii and found six different lineages. Geographical composition and mitochondrial lineages found in this species suggest that N. kuhlii may consist of several cryptic species (Arlyza & Borsa 2010).
Research Problems
1. Three of Himantura uarnak species complex are stingray with high economic value and export commodity. Refine products and live specimens from the stingray are very attractive to national and international markets, thus causing over exploitation that occurs in almost all of Indonesian waters in order to reach a maximum export production. Therefore, the latest information on the population is needed to avoid scarcity and extinction (Anak 1997).
2. Misidentification by the morphology of H. uarnak species complex (H. uarnak, H.
undulata and H. leoparda) causes confusion. The ambiguity is due to the variation of
3. Specifications geographical ranges. Not all members of H. uarnak species complex spread evenly in every area, but there are certain species- specific distribution. Preliminary study results (Table 1.1) showed the presence of the specific distribution. Table 1.1 Specific distribution of Himantura uarnak species complex in Indonesian
waters based on field indentification and genetic characterization
Species Locations Total
Indiv. Banten Batang Yogyakarta Bali Flores Selayar Makassar Kendari
H. uarnak - - - - 2 7 11 3 23
H. undulata - 1 - - - 1
H. leoparda* 3 84 1 1 - - - - 89
Total species 1 2 1 1 1 1 1 1 113
* As defined by Manjaji-Matsumoto & Last (2008), but we show that this consists of two cyriptic species (in this thesis)
Research Objectives
The objectives of this study is to identify each species of Himantura uarnak species complex using molecular approaches. Specific objectives of this study are:
1. to identify each species of H. uarnak species complex through molecular approaches, 2. to estimate the evolutionary process of species divergence; gene flow and alelle specific
in H. uarnak species complex, and
3. to determine the relationship among species.
Hypothesis
1. There are genetic differences between Himantura undulata and H. leoparda in Indonesia.
2. There are alleles specific in H. uarnak species complex based on geographical distribution area.
3. There are gene flow in H. uarnak species complex based on molecular approach.
Benefits of Research
1. Molecular identification results can be help management of Himantura uarnak species complex more targeted.
2. The results are expected to provide a reference in determining the species of H. uarnak species complex that can be traded. Based on the latest status on the IUCN red list, this species included in the vulnerable category, which means the species is vulnerable and threathened if the species sustainabikity not addressed.
Novelty
So far, research on H. uarnak species complex (H. uarnak, H. undulata and H.
leoparda) has done through morphological characthers approach by researchers from
Australia and Malaysia. This is a first study that using molecular approaches to identify H.
uarnak species complex in Indonesia. This approach produced 4 main groups with one of
the group was identified as different species than that have been released.
Framework
Himantura uarnak species complex was predicted as group of species due to
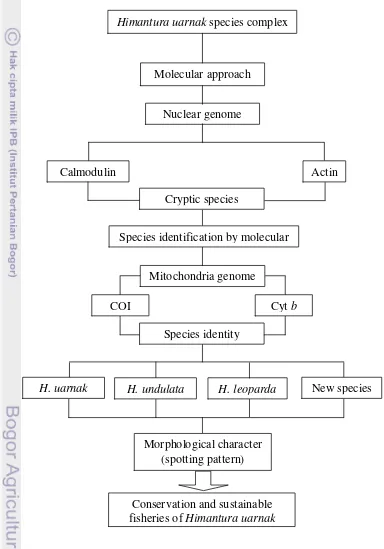
using the mitochondrial DNA (mtDNA) with genetic markers of COI for species identification. The results of species identification then verified using genetic markers cyt b to obtain the identity of species in this species complex. The results of molecular approach were compared to the species identity by morphological approach through spotting patterns. The results can be used to manage H. uarnak species complex in Indonesian. (Figure 1.1).
Figure 1.1 Flowchart of research framework
Himantura uarnak species complex
Molecular approach
Mitochondria genome Nuclear genome
Calmodulin
COI Cyt b
Actin
Species identification by molecular
Conservation and sustainable fisheries of Himantura uarnak
Morphological character (spotting pattern)
H. uarnak H. undulata New species
Cryptic species
Species identity
CHAPTER II
USE OF EPIC INTRONS AS NUCLEAR DNA MARKERS FOR THE CHARACTERIZATION OF SPECIES IN THE
Himantura uarnak
SPECIESCOMPLEX
Abstract
Nuclear-DNA markers DNA have been widely used to characterize the species and populations. Intron used as an alternative of molecular marker to know the capable of providing extensive information related to nuclear DNA polymorphism even just using a universal primer. Polymorphism alleles at the species or population level causing the genetic variability that can occur as a result of gene flow inter-oceanic. The purpose of this study is to determine the genetic information of allele’s polymorphism on each individual
in Himantura uarnak species complex. The research method used intron length
polymorphism markers in a nuclear DNA using PCR-Exon Primed Intron Crossing (EPIC). The study showed two marker EPIC has produced polymorphism alleles in individuals and formed 4 clusters different species. Two clusters (I and IV) are cryptic species currently under H. leoparda census Manjaji-Matsumoto and Last.
Keywords: EPICs,Intron, Cryptic spesies, Himantura uarnak species complex, Stingray
Introduction
Microsatellite and introns are molecular markers that are currently being
developed and in demand by many researchers in the field of population genetics (Wainwright et al. 2012; Quattro et al. 2006; Berrebi et al. 2006; Atarhouch et al. 2003). Excess from microsatellite are widely used and can provide high-quality data, but requires a primer with a very specific design and require considerable time to the development of microsatellite marker (Atarhouch et al. 2003; Wainwright et al. 2012). In addition to the transcribed part of the genome, many other parts that are not transcribed used as a genetic marker, such as introns (Quattro et al. 2006). The development of the current science showed that introns are known to have their own meaning, which have been found in the introns of genes in eukaryotic organisms, and there are variety of genes, including genes that produce proteins and thought to have role in the evolution from an organism (Penny et al. 2009). Application of DNA molecular markers from the core have been widely used in the characterization of species, populations, and intraspecific genetic structure.
Introns are not part of gene involved in the process of mRNA translation to form a protein. Intron as an alternative molecular marker has a system that can provide extensive information related to nuclear DNA of polymorphism even just using universal primers. The molecular markers do not require knowledge of the genome to be analyzed, however, generally are polymorphic and sometimes hipervariabel. Introns can be easily amplified by PCR and visualized on agarose gel or gel akrilamide. This marker can generate data at a cost that is much less expensive than other core DNA molecular marker (Atarhouch et al. 2003).
The use of the marker PCR primer pair exon primed intron-crossing (EPIC) can amplify multiple loci simultaneously. The amplification results may reflect the condition polyploidization and tandem duplications that happened before, or other phenomena that might occur during the process of evolutionary divergence of these organisms (Atarhouch
et al. 2003; Berrebi et al. 2006). EPIC-PCR are molecular marker from introns that have
going misprime and region of polymorphism in intron pair from loci can be explored properly. The same primer pairs can function in different species, where the introns appear to accumulate the level of genetic of polymorphism that is much larger than the exons on inter and intraspecies (Chow 1998).
EPIC from Actin and Calmodulin genes has successfully demonstrated the existence of polymorphism alleles is very diverse in fish species from 19 different families (Atarhouch et al. 2003). Primers from EPIC markers are universal so it can be used to analyze variety of species and only use the primer pair was able to amplify several different loci from these genes, such as primer pair EPIC actin 2 have successfully amplify loci Actin2 Actin2-A and-B. Similarly, the primary EPIC Calmodulin 3 has successfully amplified loci Calmodulin3-A, Calmodulin3-B and Calmodulin3-C. The resulting fragment sizes varied accross species (Berrebi et al. 2006). Some information about EPIC has been available in the literature (Palumbi et al. 1991; 2002), and can be designed by using cDNA database (Janech et al. 2006; Zhu et al. 2006).
Genes that have been isolated from skeletal muscle from Oryzias latipes (medaka fish) with access code (EMBL AB015886) produce skeletal muscle actin gene, known as actin or gene OlMA1 (Kusakabe et al. 1999). Actin intron portion from genes that have been used as markers of EPIC is intron 2 (Atarhouch et al. 2003; Berrebi et al. 2006). The position of intron 2 was initiated in 1494 to the base sequence of up to 2147 bases all, which has been isolated fragment length of 654 bp (Kusakabe et al. 1998).
Calmodulin genes known to encode a calcium binding protein that is highly conserved regulate cell function. Several studies indicate that genes Calmodulin literature are one from minority of genes that encode proteins that are highly conserved, phylogenetically widespread (Corte-Real et al. 1994). Intron 3 from calmodulin gene has been isolated from fish Xiphias gladius (Swordfish) SW19A strains derived from the Mediterranian Sea, the size of 359 bp. This gene is also known by another name ie CAM gene with access code EMBL GeneBank AF069912 and AF069913 (Chow and Takeyama 2000). Primers were used to amplify intron 3 in the CAM gene (359 bp) is located in exon 3 and exon 4.
The purpose of this study was to characterize species in the Himantura uarnak species complex using size polymorphic Exon Primed Intron Crossing (EPIC) intron markers.
Materials and Methods Time and place of study
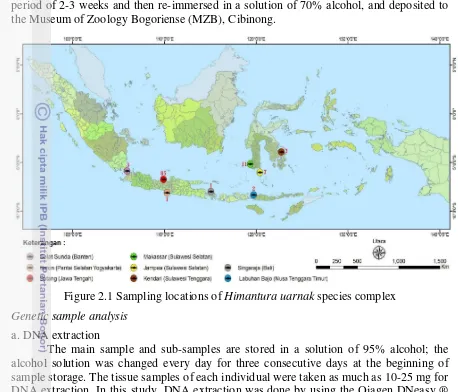
Data collection was conducted in August 2006 (Arlyza 2006-2008, unpublished) to October 2011, covering 8 location in western and eastern Indonesia (Figure 2.1). Sample collection for the western region, include: (1) Sunda Strait (Banten), (2) Batang (Central Java) and (3) Baron, (south coast of Yogyakarta), while the eastern region, include: (4) Singaraja (Bali), (5) Labuan Bajo (NTT), (6) Jampea and (7) Makassar (south Sulawesi), and (8) Kendari (Southeast Sulawesi). Data collection of Himantura uarnak species complex in Indonesian waters presented in Appendix 1.
Specimen collection
information and photograph recorded, then the tissue of each individual cutted and preserved in alcohol 95%. Whole specimen was immersed in 4% formalin solution in a period of 2-3 weeks and then re-immersed in a solution of 70% alcohol, and deposited to the Museum of Zoology Bogoriense (MZB), Cibinong.
Figure 2.1 Sampling locations of Himantura uarnak species complex Genetic sample analysis
a. DNA extraction
The main sample and sub-samples are stored in a solution of 95% alcohol; the alcohol solution was changed every day for three consecutive days at the beginning of sample storage. The tissue samples of each individual were taken as much as 10-25 mg for DNA extraction. In this study, DNA extraction was done by using the Qiagen DNeasy ® Tissue Kit (Qiagen GmbH, Hilden, Germany). Stages of processing carried out in accordance with the instructions from the kit manufacturer.
b. DNA Amplification with PCR
Nuclear DNA used as a template to see fragment length polymorphism from intron using Primed Exon Intron Crossing (EPIC) was amplified using PCR. In this study, we used two genes i.e. Actin and Cam. Amplification of intron 2 in Actin gene was using universal primers actinatf (Act-2F fluo) and actinatr (Act-2R), whereas intron 3 in gene Cam used primers camf (Cam fluo-3F) and camr (Cam-3R) (Table 2.1).
Table 2.1 Target genes, primer names, and sequences of each primers of EPIC marker Gene, family gene Primer name Sequences primer
Actin* Act-2-F 5’-GCTATAACCCTCGTAGATGGGCAC-3’
Intron 2 (Act-2) Act-2-R 5’-ATCTGGCACCACACCTTCTACAA-3’
Calmodulin* Cam-3-F 5’-TGACGGAGCTCTGCAGCACTGAC-3’
Intron 3 (Cam-3) Cam-3-R 5’-GTGAGGAGGAGCTCCGTGAGGC-3’ Source: * Atarhouch et al. (2003)
Calmodulin genes. The position and length of the both introns from the gene can be seen in Figure 2.2 and Figure 2.3.
Figure 2.2 The position of intron-2 in Actin gene from Oryzias latipes (AB015886) (Kusakabe et al. 1998, 1999; Atarhouch et al. 2003)
Figure 2.3 The position of intron-3 in Cam gene from Xiphias gladius (AF069913) (Chow and Takeyama 2000; Atarhouch et al. 2003)
Both the primers have been applied by Atarhouch et al. (2003) on several species of fish from the sea and fish from freshwater (Table 2.2) with PCR products are very diverse.
Table 2.2 The application of primers Act-2-F/Act-2-R and Cam-3-F/Cam-3-R on several fish that have been investigated by Atarhouch et al. (2003)
Fish species Primers
Act-2F/Act-2R Cam-3F/Cam-3R
(Ta = 58°C) c(Ta = 54°C) (Ta = 52°C)
Sardina pilchardus 380M, 400P 470M, 580P
Sardinops melanosticusa 380M, 400M 550P
Engraulis encrasicolus 400P -
Scomber scombrus 350P, 680P 450P
Merluccius merluccius 700P -
Lichia amia 340M, 700M, 800P 380P
Salmo marmorata 330M, 400P, 510M, 540M, 730M 450P
Barbus carpathicus (4n) 370M, 600M -
Zacco platypus 350M, 450M, 550M -
Opsariichthys bidens 350M, 450M, 550M -
Cichla monoculus 390M, 680P, 700M, 850Mc 190M, 210M
Cyprichromis leptosomab 350M, 650P 110P, 180M, 420M
Mauligobius maderensisb 320, 600 360M
Pomatoschistus microps 280M, 350M, 550M, 950P 540M
Pomatoschistus minutus 520M, 1100M -
Pomatoschistus marmoratus 110P, 350M, 550M, 1000P 540M
Note: c(Ta = 54°C); independent loci = 320, 600; M (Monomorphic), P (Polymorphic) PCR amplification to generate polymorphic alleles using a total reaction volume of
(Promega) 1 μl, 2mM dNTPs (Invitrogen) 1 μl, 25mM MgCl2 1 μl, each primer 0,5 μl
(MWG-Biotech AG, labeled with Cy5 or fluorescein), Taq polymerase (Sigma) 0.2 µl and 1 μl DNA extract. PCR run for 35 cycles with initial conditions of denaturation 95°C for 2 min, denaturation 95°C for 1 min, annealing 54oC for Actin-2 loci and 55oC for CAM-3 loci for 1 min, extension 72oC for 1.5 minutes and 10 minutes for the final extension 72oC. Results in the form of amplification of polymorphism alleles were visualized with a mixture consisting of 2.5 µ l PCR amplification product plus 2.5 µ l loading dye were loaded into the gel wells akrilamide 8% denatured (Biorad). Amplification result of polymorphism alleles contained in the gel were visualized by scanning akrilamide FMBIOs using fluorescent imaging system (Hitachi). Allele sizes were determined by fluorescent labeled ladder (Promega) using 8.0 ANALYSIS FMBIO image analyzer program (Berrebi et al. 2006).
c. Genotyping for loci Actin and Calmodulin
Allele size of PCR products from both genes were compared with fluorescent labeled ladder (Promega) by using a scanning FMBIO ANALYSIS 8.0 image analyzer program. The result can be read manually or use a program analyzer through a computer connected to the device. Genotyping is done by observing the alleles that exist in each individual and determine the pair of alleles at each of these individuals to obtain genotype individuals homozygous and heterozygous genotype. Homozygous genotype is shown with a thick ribbon on the size of single basepair (bp) specific, whereas the heterozygous genotype will feature two bands at different base sizes, where the tape of the bottom tended to be thicker than the top of the ribbon.
d. Data Analysis
A total of 115 individuals of Himantura uarnak species complex consist of 113 from Indonesia, one individual from Zanzibar and one from Taiwan. Data analysis was performed by observing the nuclear DNA of polymorphism alleles from each individual. Variation in genotypic frequencies will be analyzed to infer genetic differentiation. Opportunity for cryptic species will be detected from individual genotypes based on nuclear DNA (Act-2A, Act-2B, Cam-3A, Cam-3B and Cam-3C). To estimate the level of genetic differentiation within populations, were analyzed using a Correspondent Analysis (CA) based on the data matrix allelic frequency (Benze'cri 1982) with the program Genetix 4.02 (Belkhir et al. 2000) based on each individual genotype at 5 size-polymorphic intron loci.
Bayesian analysis of the structure using the software STRUCTURE 2.3.1 (Falush
et al. 2007) to describe the grouping of individuals based on genetic similarity character
from genotype results EPIC maker. This program using Markov Chain Monte Carlo (MCMC) algorithms for cluster formation in individuals in the population based on multilocus genotype data (Pritchard et al. 2000; Falush et al. 2003). The program working based on a mixed model that assumes the allele frequencies in the two populations are correlated.
Dimensions of the K value for the parent cluster formation on the number of individuals assigned ingroup ranged from grades 2-6. The STRUCTURE program at an early stage using 50,000 repetitions later increased to 100,000 repetitions.
Results and Discussion
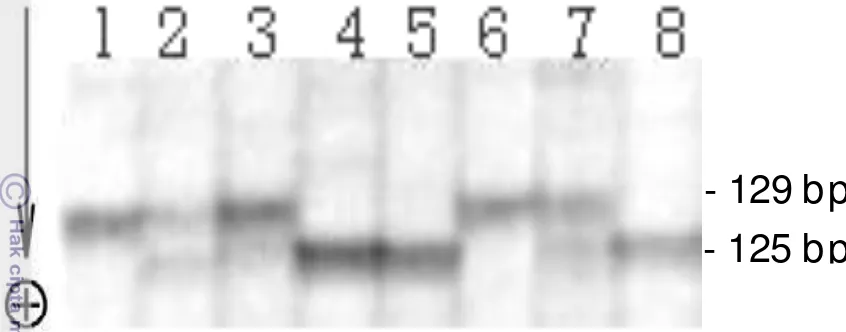
Alleles produced from two molecular markers of EPIC of nuclear DNA showed high polymorphism (Appendix 2). Genotyping results against several individuals in the
Himantura uarnak species complex from intron at Cam-3 loci (Figure 2.4) showed
same size of the 129 bp allele. The homozygous individual in column no. 4, 5 and 8 has a size of allele of 125 bp.
Figure 2.4 The alleles polymorphism of Cam-3 intron loci
Usage of each universal primer of Actin and Cam genes from individuals of
Himantura uarnak species complex have been identified to produce 2 loci on the gene of
Act-2 i.e. Act-2A and Act -2B, while the Cam-3 gene has been identified that consist of 3 loci i.e. Cam-3A, Cam-3B and Cam-3C. Act-2A loci produces 4 different alleles, they are 186 bp, 187 bp, 190 bp and 192 bp. Act-2A loci produces 4 genotypes (Table 2.3) which consist of 2 pairs of homozygous (186/186 bp and 190/190 bp) and 2 pairs of heterozygous (190/187 bp and 192/190 bp). Act-2B loci produces 3 different alleles i.e. 97 bp, 98 bp and 100 bp, and at this loci there are three genotypes (Table 2.3) which consist of one pair of homozygous (100/100 bp) and two pairs of heterozygous (100/97 bp and 100/98 bp).
Table 2.3 The application of primers Act-2-F/Act-2-R and Cam-3-F/Cam-3-R on
Himantura uarnak species complex
Family gene Gene Intron Primer name Loci Genotype producing Actin Act-2 2 Act-2-F Act-2A 186/186 bp, 190/190 bp,
Act-2-R 190/187 bp, 192/190 bp
Act-2B 100/100 bp, 100/98 bp, 100/97 bp
Calmodulin Cam-3 3 Cam-3-F Cam-3-R
Cam-3A 175/175 bp, 178/178 bp,
178/175 bp
Cam-3B 163/163 bp, 165/165 bp,
165/163 bp
Cam-3C 125/125 bp, 129/129 bp,
144/144 bp, 129/125 bp, 144/129 bp
Cam-3A loci produces 2 different alleles, they are 175 bp and 178 bp and produces 3 genotypes (Table 2.3), which consist of two pairs of homozygous (175/175 bp and 178/178 bp) and one pair of heterozygous (178/175 bp). Cam-3B loci consists of 2 different alleles, they are 163 bp and 165 bp, and produce 3 genotype consist of two pairs of homozygous (163/163 bp and 165/165 bp) and one pair of heterozygous (165/163 bp). Cam-3C produces 3 different alleles 125 bp, of 129 bp and 144 bp, there are as many as the number of genotypes 5 consisting of 3 pairs of homozygous (125/125 bp, 129/129 bp and 144/144 bp) and 2 pairs of heterozygous (129/125 bp and 144/129 bp). Results of this
study showed that the alleles from Himantura uarnak species complex different alleles produced by Atarhouch et al. (2003) despite using the same type of primer.
Genotypes generated by 5 size-polymorphic intron loci from each marker EPIC (Appendix 3), then analyzed using a Correspondence Analysis (CA) that from each individual in the population from each Himantura uarnak species complex each defined by their genotype at 5 intron loci. Oval-shaped circles depict individual group-rated> 90% to one group from three groups (1, 3, and 4) is obtained from the structure of Bayesian analysis. "Cluster 2" according to one individual, which alienated (Group II = Himantura
undulata). Individuals geometrically as intermediates between Cluster 1 with one of the
Cluster 3 or Cluster 4 allele interpreted as jointly owned (sharing) or forms of the same genotype results from a combination of the allele pair (Figure 2.5). The four cluster of nuclear DNA in each individual is shown with different colors, namely Claster 1 (whitish gray), Claster 2 (light gray), Claster 3 (dark gray) and Claster 4 (blackish gray).
Figure 2.5 Clustering formation based on Correspondent Analysis (CA) using genotype data
Genotype of Himantura uarnak species complex comprising 113 individuals have been determined based on size of the alleles at 5 size-polymorphic intron loci (Act-2A, Act-2B, Cam-3A, Cam-3B and Cam-3C) in the nuclear DNA. Determination of criteria based on the order of the sampling locations Batang, Java Sea; Strait of Sunda, Banten; Makassar Strait; Jampea-Selayar islands, Flores Sea; Kendari, Banda Sea; Labuanbajo, Flores Sea; Bali Sea; south of Java, Yogyakarta; Zanzibar, Western Indian Ocean; Taiwan, the Pacific northwest. Individuals that come from Batang are individuals who have allele frequency and highest varied (Appendix 3 and 4). Individuals which came from Makassar Strait, Selayar, Kendari, and Labuanbajo have almost 100% frequency of each allele at each loci and clustered in one cluster is Cluster 3 (Group III = Himantura uarnak). This signifies that individuals in these clusters have experienced reproductive isolation within the geographic range.
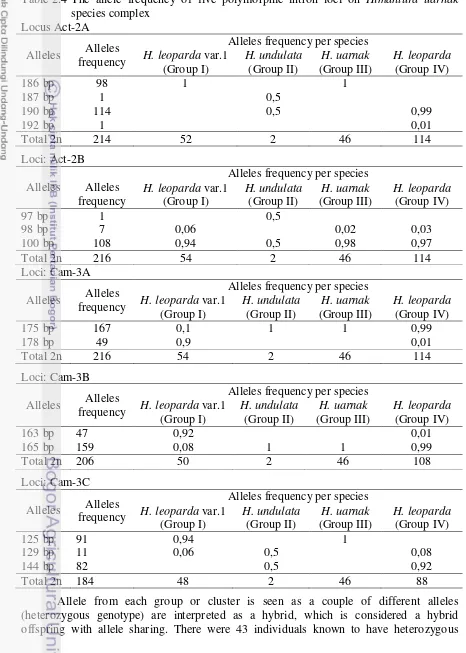
192 bp and 190 bp, for Cam-3C allele consist of 144 bp and of 129 bp. Two intron loci are Act-2A with genotype 192/190 bp and Cam-3C with allele genotype 144/129 bp may be appropriate as intron polymorphic markers to separate each species (Table 2.4).
genotype, after the calculated results indicate that there are as many as 3.8% is a hybrid. Group I and IV showed highly variable pattern of genotypes seen with many combinations of alleles, while Group III had genotype patterns with combination of alleles that tend to be consistent and dominant against a particular genotype one pattern (homozygous) except one individual with the allele pair 100/098 bp on Act-2B loci. Frequency of alleles per loci were observed (Table 2.4) looks stable on the species H. undulata (Group II) and H.
uarnak (Group III), and more varied for H. leoparda var. 1 (Group I) and H. leoparda
(Group IV). Two intron polymorphic data from Group I and 3 intron polymorphic data from Group IV were not included in the analysis because the data is only represented by 1-3 loci, whereas for the analysis process must be represented by at least 4 polymorphic loci (Appendix 3).
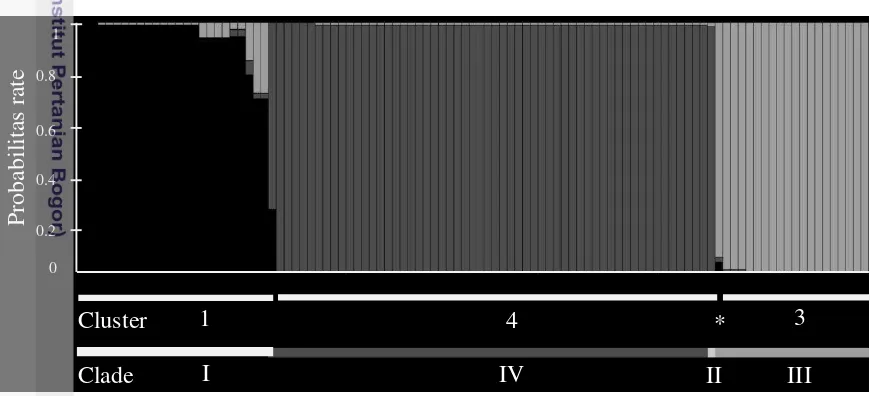
Individual probability assessment on one of the groups (1, 3, 4) are determined by the Bayesian approach of nuclear DNA intron multilocus genotypes (Appendix 4). Burn-in is done without the individual sampling location information in estimating the proportion of a mixture of individual and assign individuals to populations. Five independent loci carried on the parent cluster formation (K) by using the limit value from 2 to 6 to get the informative diagrams. The resulting diagram are most informative on the value of the K = 3. The results from diagram based on Bayesian analysis of population structure aligned with the results of Correspondent Analysis (CA) (Figure 2.6).
Figure 2.6 The result of Bayesian population structure analysis, where it was match to Correspondence Analysis (CA)
According to the diagram above, Clade II is in accordance with the individual that alienated the IR007. Individual probabilities from each assessment are shown on the y-axis, the individual is represented by a vertical bar and sorted according to the type clade (Clade I-IV) displayed on the horizontal bar. Individuals from different groups adjusted to the Correspondent Analysis (CA), IR007 marked with an asterisk (Cluster 2). White horizontal lines underscore individual with valuation probability >90% that occurred in Cluster 1, 3 and 4.
Two EPIC markers were used in this study similar to Atarhouch et al. 2003, namely Actin 2 and Calmodulin 3. Two markers produce different alleles of polymorphism with results obtained by Atarhouch et al. 2003. Polymorphism alleles generated in this study is less than 200 bp. There were as many as 14 total alleles obtained in this study only two alleles have a similar size to the results of research that has been conducted by Atarhouch et al. (2003), they were 100 bp alleles at loci Act-2B and 178 bp allele Cam-3A. Two loci of EPIC marker are Act-2A loci with genotype 192/190 bp and
Cam-3C loci with genotype 144/129 bp can be used as intron polymorphic markers appropriate to separate each species. The two genotypes have specific characteristics that is only found in two loci and observed only owned by two separate groups of individuals, namely Group II and IV. It shows that have found the sharing of alleles between two groups of individuals.
Four different groups of individuals have been defined through the multilocus genotype complex species of H. uarnak. Hybridization has occurred between the clusters were deduced through observation that heterozygous genotype is interpreted as a hybrid. It has been detected with a very low proportion (<4%) but still showed hybridization has occurred in H. uarnak species complex. Chance of this happening if it really happened will likely be very rare. Incidence of genetic homogeneity across large geographic distances was maintained in each cluster, although there may be a cross between clusters. This is reflected by the formation of 4 species consisting of H. uarnak and H. undulata, while the others were cryptic species that have been released as H. leoparda according to the current definition (Manjaji 2004; Manjaji-Matsumoto & Last 2008).
If there is a shortage of individuals by ancestral mix-species with H. uarnak species complex will support the general view that the hybridization is a rare phenomenon in the group of elasmobranch (Ward et al. 2008; Dudgeon et al. 2012). The existence of cryptic species was found in H. leoparda showed that the species is sympatric with large geographic areas (Futuyma 2009). Members of H. uarnak species complex have undergone a process of overlap in the broad geographical range and habitat sharing. Based on observation that know geographical distribution of reproductive isolation has occurred in Group III. Individuals in Group III had done isolation mechanism, i.e. individuals which come from Flores Sea (Labuan Bajo and Selayar Island), the sea around Kendari to Makassar Strait and the Banda Sea. Individuals were grouped in a single cluster that is separate namely Cluster 3 has a pattern of alleles were detected almost uniform.
Conclusions
1. Actin and Calmodulin genes from EPIC markers have demonstrated the existence of polymorphism alleles at each locus were analyzed with the highest number of 4 alleles in Act-2A loci.
2. Heterozygous genotypes of two loci (Act-2A and Cam-3C) can be used as intron polymorphic markers were correctly for Himantura uarnak species complex.
3. Obtained 4 clusters that show the differences for each species in the complex species of
CHAPTER III
MARKER CYTOCHROME C OXIDASE SUBUNIT I (COI) OF
Himantura uarnak
SPECIES
COMPLEXAbstract
Complex species indicates incomplete species delineation that has not been fully developed with incomplete reproductive isolation. Himantura uarnak species complex identification using only morphological characters often misleading, thus molecular approach using cytochrome c oxidase subunit I (COI) gene may support concise species identification. This chapter will study complex species of H. uarnak from Indonesian waters using COI. A total of 113 Himantura samples were collected from eight locations to develop 680 bp DNA products. Strategy to achieve research goals included specimen collection, total DNA extraction, DNA amplification, sequencing based on partial sequences of COI. This study revealed that there were four groups of H. uarnak species complexconsisting of Group I (H. leopard var.1), Group II (H. undulata), Group III (H.
uarnak) and Group IV (H. leoparda). Group I and IV correspond to different species
under “H. leoparda”.
Keywords: molecular identification, COI, Himantura, species complex, cryptic species,
Introduction
Some species of stingrays in the family has been known to be a complex. Dasyatidae describing species identity from these species has not been comprehensive yet. This occurs because of the rapid evolution of reproductive isolation mechanism that has not fully happened (Cracraft 1989; Templeton 1989; Mayr 1992; Irwin et al., 2001; Queiroz 2007). Meanwhile, according to Knowlton (1993; 2000), typically represent cryptic complex species situations where speciation has been marred by the presence of gene flow between populations from the cryptic species, so it is still found that the characters are not too different (distinct) or a mixture similar to ancestral species and as though a new species is formed. This incident is evidenced by the discovery of some variation of spotting pattern in Himantura uarnak species complex. In the 1940s, reproductive isolation between hybrids and parents are considered very rare, through the development of molecular technology has demonstrated proof of the existence of a hybrid species, in very particular cases in plants (Arnold 1996; Wendel and Doyle 1998).
Hybrids are morphologically indistinguishable because there are number of reticulation which may come from a variety of spotting patterns of adaptation. Reticulation variations may occur due to geographic isolation, which are the core from geographic variation in the understanding of the forms and processes from speciation allopatrik (Cracraft 1989). Sympatric speciation is the process of formation of new species that evolved from ancestral species and inhabit the same geographical area. Sympatric evolution of organisms often produce overlapping or even identical, and appear simultaneously at least in some places. Possibility of hybridization in some areas may occur if reproductive isolation is not going perfectly. New species are identical and closely interrelated evolution is the result from a single ancestral species and inhabit the same geographical area is the result of sympatric speciation (Futuyma 2009).
unique barcode and intraspecific differences in COI sequences ranged from 0 to 1.24% can already be used as a standard to determine the specific species different from the others. Meanwhile, according to Hebert (2004), to determine a new Species, a different base sequences limits from COI sequences are 2.7% with the additional information that the threshold value is determined by a group of taxa under study so that the variation of threshold according taxa group.
Besides being able to show the identity of species, COI marker has been found to reveal intraspecific variation in the form of various haplotypes of a species (Funk 1999; Morales & Freitas 2010). Thus it is possible that COI marker from Himantura uarnak complex species will also be able to reveal the various haplotypes from each type of spotting pattern, and nothing to do with the geographic isolation from the complex species. Complex species of stingrays, in fact not only occurs in species from Himantura group. Cryptic complex species has also been found in stingrays of Neotrygon kuhlii which is a member of the Dasyatidae family. A total of 102 sequences of COI N. kuhlli have been collected from 21 sampling sites from Indonesia and 1 from New Caledonia. Nucleotides along the 610 bp fragment from samples derived from Indo-Malay-Papuan and coupled with the homologous sequence from Genebank (N. kuhlii from Java, Bali, Taiwan, Japan and Queensland) obtained 6 lineages were very different according to geographical regions separated with little or very little chance of any possible overlapping (Arlyza & Borsa 2010). Thus, a large complex of cryptic species may also occur in Himantura
uarnak complex species.
The purpose from this study was identifying of each species in Himantura uarnak complex species through molecular approaches using genetic markers cytochrome c oxidase subunit I (COI) of mithocondrial DNA.
Materials and Methods Time and location of study
Data collection was conducted from August 2006 (Arlyza 2006-2008, unpublished) to October 2011 at eight sampling sites in the western and eastern Indonesia (Table 3.1). Sites in western regions included (1) Sunda Strait (Banten), (2) Batang (Central Java), and (3) Baron, (south coast of Yogyakarta), while in the eastern region, included of (4) Singaraja (Bali), (5) Labuan Bajo (NTT), (6) Jampea and (7) Makassar (South Sulawesi), also (8) Kendari (Southeast Sulawesi).
Table 3.1 Location where specimens of Himantura uarnak collected
Species Locations Total
Banten Batang Yogyakarta Bali Flores Selayar Makassar Kendari
H. uarnak - - - - 2 7 11 3 23
specimen was immersed in 4% formalin solution for 2-3 weeks, prior to immersion in 70% alcohol for specimen deposition to the Museum of Zoology Bogoriense (MZB), Cibinong. Analysis of genetic samples
a. DNA Extraction
Tissue samples of stingray for genetic analysis were made small subsamples (100 mg or 1 x 1 cm) from main sample, while the main sample was kept in a freezer -30oC. The main sample and sub-samples were stored in a solution of 95% alcohol, the alcohol solution was changed every day for three consecutive days at the beginning of sample storage. Each individual of sampling result be taken as much as 10-25 mg tissue for DNA extraction. In this study, DNA extraction was done by using the Qiagen DNeasy ® Tissue Kit (Qiagen GmbH, Hilden, Germany). Stages of processing carried out in accordance with the instructions from the kit manufacturer.
b. The Target of Gene Amplification
Genetic marker used to identify the target species is gene cytochrome c oxidase subunit I (COI). Primers were used in this study namely FishF1 for forward and FishR1 for reverse. Both primers have been successfully tested on stingrays Himantura gerrardi
and Himantura toshi (Ward et al., 2005). The base sequences from the primer pair as
shown in Table 3.2.
Table 3.2 Gene target, primers and total PCR product resulted in this research
Gen Primer Produk PCR
COI* Fish F1 : 5’-TCAACCAACCACAAAGACATTGGCAC-3’ 680bp
Fish R1 : 5’-TAGACTTCTGGGTGGCCAAAGAATCA-3’
Source : * Ward et al. 2005 c. PCR Mixture and Conditions
Data Analysis
A total of 116 sequences of COI ingroup consisted of 111 sequences results of this study (IR001-IR038 and IR068 IR113 except), 3 homologous COI sequences from Genebank (DQ108167, JF493651 and JF493652), (1 COI 637_H uarnak sequence from Taiwan, 1 COI ZANZ6 sequences from Zanzibar). In addition it also added 1 COI sequences as outgroup (ZANZ2). A total of 117 sequences are aligned using ClustalW alignment editor at the Molecular Evolutionary Genetics Analysis (MEGA) version 5 (Tamura et al. 2011). Analysis of nucleotide diversity based on some basic parameters that conserved nucleotides vs. variable nucleotides, which is a singleton nucleotides, that are parsimony-informative were analyzed using MEGA 5 program, whereas haplotype diversity using DNAsp program. Approach to obtain a representative likelihood phylogeny tree then the data is processed via Maximum Likelihood and Bayesian approach. Both approaches are used to estimate the evolutionary distances between the sequences of bases that differ in sequence were observed. MEGA5 uses to determine the best substitution model based on the value of the Bayesian Information Criterion (BIC) (Tamura et al. 2011). The results from this data analysis are to look at boundaries between species of
Himantura uarnak complex species and phylogeny relationship with its sister group.
Model with the lowest BIC score is considered describe the best substitution pattern. The testing of substitution test model based on Maximum Likelihood from the existing sample
of Himantura uarnak complex species. Determination groups based on Tamura-Nei
models (TN93)+I (Fitch & Margoliash 1967; Fitch 1986; Shoemaker and Fitch 1989; Yang 1994).
Results and Discussion
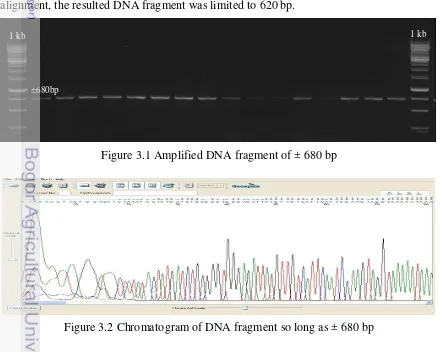
A total of 111 individuals Himantura uarnak originating from several regions in Indonesia that produce DNA fragment of ± 680 bp (Figure 3.1). After sequencing and alignment, the resulted DNA fragment was limited to 620 bp.
Figure 3.1 Amplified DNA fragment of ± 680 bp
Figure 3.2 Chromatogram of DNA fragment so long as ± 680 bp
1 kb 1 kb
a. Nucleotide Variations
Along the 620 bp fragment resulted from 111 individuals of Indonesia ingroup produce 515 in the same bases (conserved = invariable site) and 105 nucleotides are unique identifier sequence bases (variable site) from individuals analyzed. The same things also done after the additions of individual based on another ingroup and outgroup (Table 3.3).
Table 3.3 Nucleotide variations based on observations of Himantura uarnak ingroup and outgroup by COI genetic marker
Note: Pi=parsimony-informative sites, s=singleton sites, si= transitionsal pairs, sv= transversional pairs dan R= the ratio of si/sv
Based on the distinguished group, the unique identifier are different from the rest that amounted of 16.9% (n = 111), 18.06% (n = 116) and 28.39% (n = 117). The nucleotide diversity will showed how many genes are inherited jointly by the parents, which is in the molecular basis known as variable site. How big is the uniqueness from a total of 620 nucleotides in the 111 individual nucleotide bases can be grouped based on the formation of different species groups (distinct). Grouping species group on ingroup are individuals that came from Indonesia (formation result of phylogenetic tree topology) and outgroup produces 4 different major groups.
occurred at the 241, 404, 497, 518, 560 and 614 base sites, only two base changes occur in Indonesia, namely the 404 and 614 base ingroup. Other sites base change between Indonesia ingroup by comparison was ZANZ_6. DNA modification through base substitution transition purine↔purine (A↔G) occurred in 5 sites at the 171, 275, 389, 482 and 596, which happens to all ingroup of Indonesia. Transversion substitutions purine→pyrimidine base (A→C) occurred in the 296 sites among ingroup of Indonesia by purine (A) and ZANZ_6 became pyrimidine (C).
Group II only consisted of one ingroup of haplotypes originating from Indonesia, IR007, while another weas individual which come from GeneBank with access code DQ108167. A change in the nucleotide bases in Group II was dominated by the transition substitution from pyrimidine↔pyrimidine bases (C↔T) occurs in four sites, i.e. the 149, 251, 266 and 560. Substitution of transition from purine→purine bases (A→G) occurs at the 608 base sites. The base change was result of comparisons between Indonesia ingroup IR007 with the GeneBank DQ108167 data.
Group III was divided into 5 haplotype consisting of haplotype 1 (IR089) represented by 10 individuals. One individual 637_H. uarnak coming from Taiwan as haplotype 2 clustered with haplotype 3 consisting of 5 individuals represented by IR101. Haplotype 4 was represented by individual IR094 of 6 individuals clustered with haplotypes 5 were represented by the IR107 and IR109 consist of 2 individuals. Substitution of transition (si) in Group III occurred on 38 sites for pyrimidine↔pyrimidine (C↔T), purine↔purine bases (A↔G) occurs at 16 base sites, while substitution transverse (sv) in the purine↔pyrimidine bases (A↔T), (C→G), (C→A) and (T→G) were in 5 of base sites. Changes at 38 sites pyrimidine↔pyrimidine bases were on the 20, 50, 59, 63, 89, 113, 128, 140, 185, 188, 197, 202, 229, 238, 251, 252, 260, 299, 311, 326, 329, 356, 383, 386, 410, 422, 428, 491, 494, 500, 513, 527, 539, 552, 563, 587, 605 and 614. Alterations at 16 base sites were purine↔purine consisting of the 29, 80, 92, 116, 134, 137, 171, 220, 232, 254, 263, 275, 371, 485, 512, and 530 base sites. Changes in purine↔pyrimidine bases found at the 5 base sites i.e. the 32, 170, 194, 241, 257, 284 and 497. Almost all changes in nucleotide bases were the result of comparisons between Indonesia ingroup in Group III with individual H. uranak from Taiwan, except on-site of the 371 and 605comparison occur only in Indonesia ingroup.
Group IV was divided into 17 haplotypes; with haplotype 1 represented by IR062 separated itself from other groups of individuals. Haplotypes 2 represented by IR069 consisting of 16 individuals, subsequent haplotype 3 and 4 were represented by the IR007 and IR022. Nine individuals were in the haplotype 5 represented by IR066, then haplotype 6 was represented by IR053 consist of 4 individuals. Haplotypes 7 represented by IR060 consisting of 1 individual. Haplotypes 8 represented by IR048 and IR036, subsequent haplotype 9, represented by the IR032 which consist of four individuals clumped together. Haplotypes 10, 11, 12, 13, 14 and 15 respectively represent by IR017, IR078, IR071, IR018, IR010 and IR070. Haplotypes 16 represented by 12 individuals and haplotype 17 composed from 1 individual, the IR088. Other haplotypes derived from GeneBank with the access code JF493652 and JF492651.
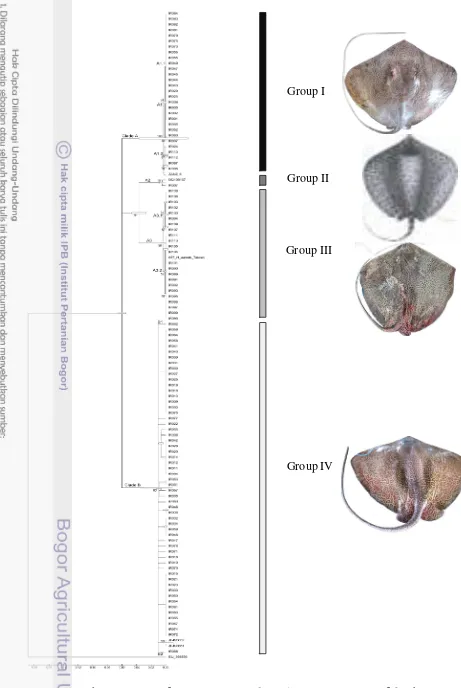
Figure 3.3 Phylogeny tree of Himantura uarnak species complex (COI) of 620 bp Group IV
Group I
Group II
c. Dominant haplotype variation from each representative Indonesia ingroup
The nucleotide diversity and uniqueness of each group species were presented in Appendix 5-8. Table 3.4 in below shown nucleotide variations of each representative group, Group I (Himantura leoparda var.1), II (Himantura undulata), III (Himantura
uarnak) and IV (Himantura leoparda).
Table 3.4 Variation of unique nucleotides in each representative of Indonesia ingroup by COI genetic marker
Group 20 29 32 44 50 59 63 66 80 89 92
Group I_IR001 C G T G T C C C G T A
Group II_IR007 . A A A C T T . A . G
Group III_IR089 T A A . C T T . A C G
Group IV_IR003 . . . . C . T T A . .
Group 98 101 113 116 128 131 134 137 140 143 149
Group I_IR001 C T C A T G A G C T T
Group II_IR007 . . . . C A . A . C C
Group III_IR089 . . T G C . G A T . .
Group IV_IR003 T C . . C A . A T . .
Group 152 155 170 171 173 185 188 194 197 200 203
Group I_IR001 T T C G T T C T T A T
Group II_IR007 . C . . . C T A C G C
Group III_IR089 . . G A . C T A C G C
Group IV_IR003 G C . . C C T A . . C
Group 215 224 230 233 239 242 251 252 254 257 260
Group I_IR001 A A C G C C C T G A T
Group II_IR007 G . T A T A T C . C C
Group III_IR089 . . T A T A T C A T C
Group IV_IR003 . G T A T A T C A . .
Group 263 266 275 281 284 299 311 318 326 329 338
Group I_IR001 G C G A T T C T C T C
Group II_IR007 . T A . . C T . . C .
Group III_IR089 A . A . G C T . T C .