Releasing Pattern of Applied Phosphorus and Distribution Change
of Phosphorus Fractions in the Acid Upland Soils
with Successive Resin Extraction
Arief HartonoJ
Received 9 January 2007/ Accepted /9 December 2007
ABSTRACT
Releasing Pattern of Applied Phosphorus and Distribution Change of Phosphorus Fractions in the Acid Upland Soils with Successive Resin Extraction (A. Hartono): The releasing pattern of applied P in the acid upland soils and the soil properties influencing the pattern were studied. Surface horizons of six acid upland soils from Sumatra, Java and Kalimantan were used in this study. The releasing pattern of applied P (300 mg P kg'l) of these soils were studied by successive resin extraction. P fractionation was conducted to evaluate which fractions released P to the soil solution after successive resin extraction. The cumulative of resinPjlllltganic (Pi) release of soils was fitted to the first order kinetic. Regression 。ョ。ャケウセウ@ using factor scores obtained from the previous principal components analyses was applied to determine soil properties influencing P releasing pattern. The results suggested that the maximum P release was significantly (P < 0.05) increased by acidity plus 1.4 om mineralrelated factor (PCl ) i.e. exchangeable Al and 1.4 om minerals (smectite and vermiculite) and decreased by oxide related factor
(PCI ) i.e. aluminum (AI) plus 112 iron (Fe) (by ammonium oxalate), crystalline Al and Fe oxides. cation exchange
capacity. and clay content. P fractionation analysis after successive resin extraction showed that both labile and less labile in the form of NaHCOrPj and NaOHPj fractions, respectively, can be transformed into resinPi when in the most labile resinPi is depleted. Most of P released in high oxides soils were from NaOHPj fraction while in low oxides soils were from NaHC01Pi. P release from the former fraction resulted in the maximum P release lower than that of the latter one. When NaHCOJPi was high, NaOHPj was relatively more stable than NaHCOJPi despite resinPi removal. NaHCOJPj and NaOHPj are very important P fractions in replenishing resinPi in these acid upland soils.
Keywords: Acid upland soils. phosphorus, rea/easing pattern, successive resin extraction
INTRODUCTION
Most of the upland soils in Indonesia are acidic in reaction and found to be deficient in available phosphorus (P). Acid soils account approximately
57% of total upland soils and are developed from different kinds of parent materials (Subagyo el al.•
2000). P fertilization is a key component for increasing soil productivity in these acid upland soils. Transformation study of applied P in these soils showed that much of P fertilizer in soils with high amount of oxides in one cropping season (90
days) was transformed to chemisorbed aluminum (AI) and iron (Fe) oxides while in soils with low amount of oxides was transformed not only tochemisorbed to AI and Fe oxides but also on the
surface of AI and Fe oxides (Hartono el al., 2006).
P forms dictate the P release to soil solution. The P release in acid upland soils from P bonded by AI and Fe oxides in these acid soils are not evaluated. It is essential to know the longterm effects of the applied P in the soil. By using successive resin extraction, there is possibility to study the long term effect due to the characteristic of anion exchange resin as reported by Arner et al. (1955), Sibbesen (1978). Dalal
(1985), and Van' Raij et al. (1986). They reported that in determination of available P with anion exchange resin extractions, available P correlated well with plant P uptake. The resin acts as a sink for desorbed P in the same way as plant roots. Recently it was used to evaluate the
I Department or Soil Science and Land Resource. Faculty ofAgriculture, Bogor Agricultural University Jln Meranti,
Kampus IPB Darmaga 16680
J. Tanah Trop., VoL 13, No.2, 2008: 87·94 ISSN 08S2·2S7X
•
A. Ihrrtono: ReleaJing PalJern and Change ofPIlm;pllOrm Fractions witlt Resin
release pattern of P in heavily fertilized calcareous soils and limed acid soils (Delgado and Torrent, 2000) and in typical mediterranean soils (Saavedra and Delgado, 2005). Since the use of resin does not dismpt the chemical structure of the soil, it should be possible to make a series of extractions from one soil sample allowing the examination of the release characteristics of soil P from stronger P bond over time.
The P release characteristics may be different among soils with high or low amount of oxides due to difference of soil properties. The objective of the study were to evaluate the releasing pattern of P on soils with high amount of oxides and on soils with low amount of oxides using successive resin extractions and to evaluate the distribution change of P fractions after successive resin extraction.
MATERIALS AND METHODS
Soil samples. Surface horizons of six acid upland soils from Sumatra, Java and Kalimantan were used in this study. These soil samples were selected based on the results of P transformation study (Hartono et al., 2006). Based on the results of that study, PO I (Sumatra), Pringsurat (Java), Darmaga (Java). Gajrug (Java) represented soi Is with high amount of oxides. While Kota Bangun (Kalimantan) and SMBP (Kalimantan) represented soils with low amount of oxides. For convenience in discussion, soils with high amount of oxides is called high oxides soils and soils with low amount of oxides is called low oxides soils.
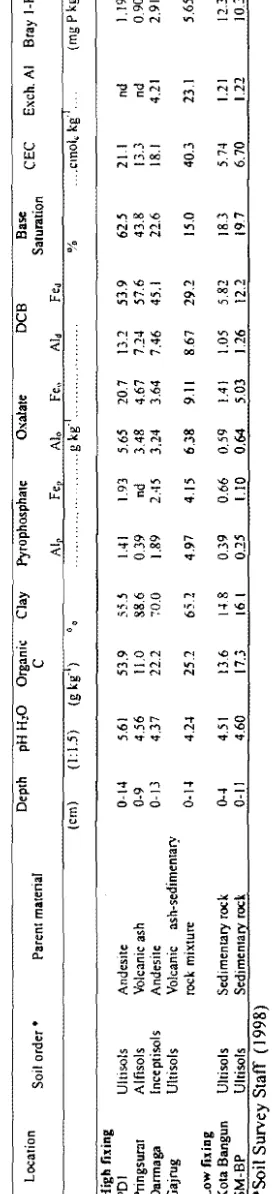
Parent materials and selected chemical and physical properties of the soils are listed in Table J. The methods to obtain their values were described in Hartono e/ al. (2005). Dominant si licate clay minerals in soi Is from PO I were kaolinite and AIinterlayered vermiculitechlorite intergrades, while soils from Pringsurat and Darmaga were kaolinite. Dominant silicate clay mineral in soil from Gajrug was smectite, while soils from Kota Bangun and SMBP were kaolinite and vermiculite.
In the previous study, the principal component analysis (PCA) was applied and three principal components (PCs) were extracted from the chemical and physical properties of 13 original soils (Hartono el al., 2005). PC I was interpreted as an
oxiderelated factor (amorphous AI and Fe oxides, crystalline AI and Fe oxides, cation exchange 88
o
¢
t " " I セBi@
...: t..) 00 d
N セ@
(;)"1>,0
Mr:",I.f"'I vB|セ@
t"'loo:t >,0 ヲセ@ (" セ@
... r . ... セ@ ッセセ@ N'l:1'M セセセ@ v)MM NNイZセセ@
'rl 00 0
lr. 00 t""
t"l ('01('" <Xl • . N '" .,, N t" セ@ 00
- -M
セッ
0\ :v\
セ@ セZ「@
セ@ 00
"<Or ""t
...oIr'lM I"!
カMゥセBGZ@ "1"
.,.
J. Tanah Trop., VoL 13, No.2, 2008: 87-94
Tabel2. Factor scores of PC), PC2and PC3 of the soils used.
Soil samples Factor scores of PC I Factor scores of PC2 Factor scores of PCl
High fixing POI 2.09 Pringsurat 0.48 Darmaga 0.69 Gajrug 1.88 Low fixing
Kota Bangun 1.37
SMBP 1.05 1.55 1.06 0.15 2.69 0.02 0.01 2.89 0.96 0.29 1.67 0.81 1.09
capacity and clay content). PC2 was interpreted as an acidity plus 1.4 nm mineralrelated factor (exchangeable AI and 1.4 nm minerals i.e. smectite and vermiculite), and PC3 was interpreted as an
organic carbon (C)related factor (organic C and organically bound Fe). They were used again to describe soil properties in this study. Factor scores of PC" PC2 and PC) of the soils used is presented in
Table 2.
Incubation procedure. Duplicate 1 g samples were treated with 300 mg P kgI soil as a solution of KH2P04, mixed thoroughly, and incubated for 30 days at 25° C and 80% of field capacity. Controls without P addition were also included for each soil. 30 days was selected as a period of incubation, because most of selected soils in this study reached their equilibrium of P transformation in 30 days
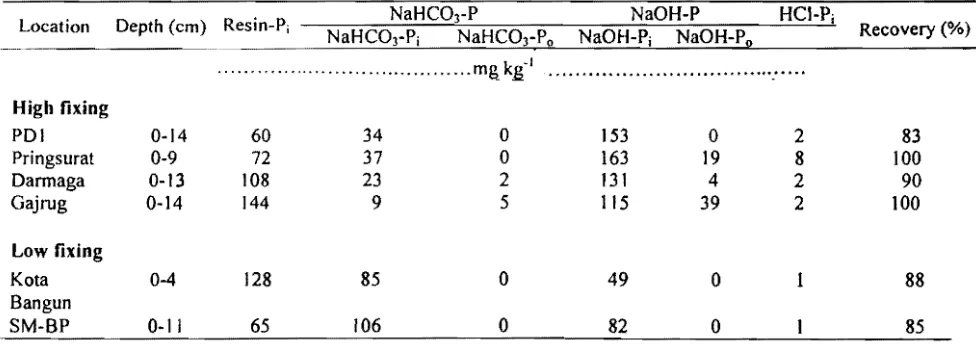
(Hartono el al., 2006). The results of P fractionation according to Tiessen and Moir (1993) method of these selected soils after 30 days incubation based on the previous P transformation study is presented in Table 3 (Hartono et aI., 2006).
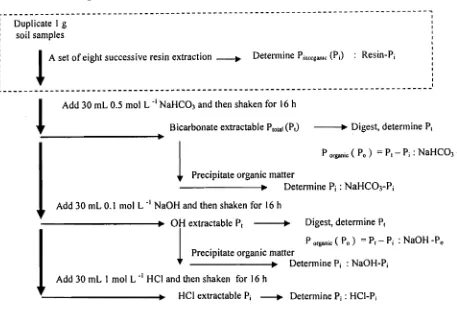
[image:5.614.69.557.563.735.2]Successive resin extraction procedure. Two resin strips oversaturated with bicarbonate and 30 mL of deionized water were applied to 1 g of soil in 50 mL centrifuge tubes and then shaken for 16 h. Resin strips were removed and washed with deionized water over a glass vial. Any soil trapped in the resin strips and lost from the bottle was collected, dried, and the weight loss was taken into account in the calculations of the amount of P extracted. Resin strips were placed in a clean 50 mL tube and applied 20 mL 0.5 mol L1 HCI and shaken for 16 h. After that resinPi was determined.
Table 3. P distribution of300 mg kg· 1 P added after 30 d of incubation.
NaHC03P NaOHP HCIPj
Location Depth (cm) ResinPi NaHC01Pi NaHC0 Recovery (%)
3Po NaOHPj NaOHPIl
k ·1
... m& :&
...
セ@....
"...
High fixing
POI 014 60 34 0 153 0 2 83
Pringsurat 09 72 37 0 163 19 8 100
Darmaga 013 108 23 2 131 4 2 90
Gajrug 014 144 9 5 115 39 2 100
Low fixing
Kota 04 128 85 0 49 0 1 88
Bangun
____________________ _______ ___ ____________________ - - - _ _ _ _ _ _ A. Hartono: Releasing Pattern and Change ofPhosphorus Fractions with Resin
MMMMMMMMMMMMMMMMMMMNMセセMMMMNMMセMMMMMMMMMMMMMMMMMMMMMMMMMMMMMMMMMMMMMMMMMMMMMMM
Duplicate I g soH samples
l
A set of eight successive resin extraction+
Determine Pinorsanic (Pi) ResinPi II
I I
I
セ@ セ@ セ@ セ@ 1
I
Add 30 mL 0.5 mol L ·1 NaHCO) and then shaken for 16 hセ@
Bicarbonate extractable Plolal (PI) . " Digest, detennine P,セMMMMMMMMMMMMMMMMセセセ@
1
P organic (Po) '" Pt Pi: NaHC03 PoPrecipitate organic matter
tIo"
Determine Pi : NaHC03Pi Add 30 mL 0.1 mol L ·1 NaOH and then shaken for 16 hMMMMMMMMMMMMNセ@ OH extractable PI セ@ Digest, determine P,
1
Porganic ( Po) = PI Pi : NaOH PoPrecipitate organic matter
tIo1Jo
Determine Pi : NaOHPi Add 30 mL I mol L·1 HCI and then shaken for 16 h [image:7.614.86.543.106.426.2]NMMMMMMMMMMMMMMMMMエiッセ@ HCI extractable Pi II> Determine Pi : HClP;
Figure I. Flow chart of the P fractionation into various inorganic and organicP fractions.
The resin strips was removed, washed and regenerated for further use as described by Saggar
et al. (1990) and Tiessen and Moir (1993). The
extraction of P from each sample was continued by placing a regenerated resin strips in the original centrifuge containing the soil and water suspension and the procedure was repeated. A set of eight successive extractions was performed. The values were obtained by subtracting the release resinPi with those of control.
P fractionation. After a set of eight successive extractions, P fractionation was performed to evaluate the changes of P fractions. P fractionation procedure was described in Figure I. Characterization of sequential soil P extraction was explained as follows: (i) resinPi was interpreted as P that is readily available to plant, (ii) NaHC03Pi, Porganic (Po) were interpreted as P which are strongly
related to P uptake by plants and microbes and bound to mineral surface, (Mattingly 1975; Tiessen and Moir 1993) (iii) NaOHPi• Po were interpreted as P which are more strongly held by chemisorption to Fe and AI components of soil surface and (iv) HCIPj was interpreted as CaP of low solubility.
The values were obtained by subtracting control from the recovery of P fractions.
RESULTS AND DISCUSSION
Successive Resin Extraction of Soil Samples
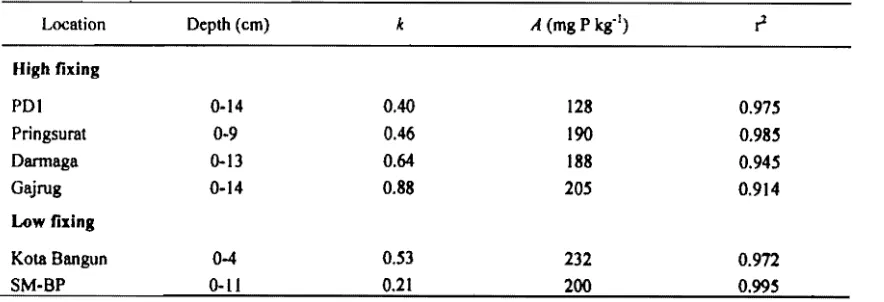
The cumulative of resinPi released by soi Is are presented in Figure 2. For describing the releasing of P pattern, the data was fitted to the first order kinetic as written below:
ResinPi = a (l_ek(numberofextnll:tion})
where the constant a is the maximum resin Pi release and k is the rate constant of cumulative resinPi released per resin extraction. The parameters of the equations are presented in Table 4.
•
•
•
•
these acid soils were reported decreased the P sorption maxima (Hartono et al., 2005). It suggested that exchangeable AI associated with smectite increased k value of resinPi released from soils.
PD 1 soil exhibited the lowest a value (Table 4). It was due to high factor score of PCI . The
stepwise regression showed that
a
valuesignificantly (P < 0.05) decreased with increasing of PCI and increased with increasing of PC2 as in
the equation below:
a = 199 18.3 PCl
+
14.8 PC2 (R2=
0.88*)PC) which is Crelated factor (organic C and organically bound Fe) was considered as not component to estimate
a
value because PC) made the equation was not significant statistically.P desorbability was reported to decrease with increasing Alo
+
Feo (Lookman etai.,
1995;Maguire et aI., 2001; Vadas and Sims, 2002). This
:::tSO
..r
::t::tIItI
.w :::too
g,.
II
•
tIItI
..§.. .A.
.:t to> ISO
•
Xt
+
%
:a
to>•
.A.
•
1!
g,.i
•
x
X
100
...
r: セ@.A.
'iI
•
]
SO セ@(3
J. Tanah Trop., VoL 13, No.2, 2008: 87.94
result suggested that not only oxiderelated factor where Alo
+
Feo was included but also the presence of exchangeable Al which is associated with 1.4 nm minerals should be included to estimate P desorbability in these acid upland soils. Due to low factor ウ」ッセウ@ of PCI thea
value of two lowoxides soils Kota Bangun and SMBP was higher than that of soil from PO 1. Low factor score of PCI
caused significant amounts of P distributed in the NaHC03Pi fraction (Table 3).
Two high oxides soils Pringsurat and PD1, exhibited the quite different pattern in maximum P released. Although their rate constants were similar but soil from Pringsurat had a higher a value (maximum P release) than PDt. This is because of factor score of PCI of POI soil was higher than that
of Pringsurat soil. It meant that PDl soil had higher amount of oxides than that of Pringsurat soil. ..
::t:: X
•
X+
Darmagat
*
*
• Gajrug•
e e ... Pringsurat X XPDl x )t( Kota Bangun eSMBP X 00 4 6 8
[image:9.614.135.502.375.572.2]Numb er Q f extraction
Figure 2. Cumulative of resinPi release extracted by successive resin extraction.
Table 4. The parameters of the equation.
Location Depth (em) Ie A (mgP kg'!)
High fixing
PDt 014 0.40 128 0.975
Pringsurat 09 0.46 190 0.985
Darmaga 013 0.64 188 0.945
Gajrug 014 0.88 205 0.914
Low fixing
Kota Bangun 04 0.53 232 0.972
SMBP Oll 0.21 200 0.995
[image:9.614.84.526.626.777.2]A. Harlono: Releasing Pattern and Change ofPhosphorus Fractions with Resin
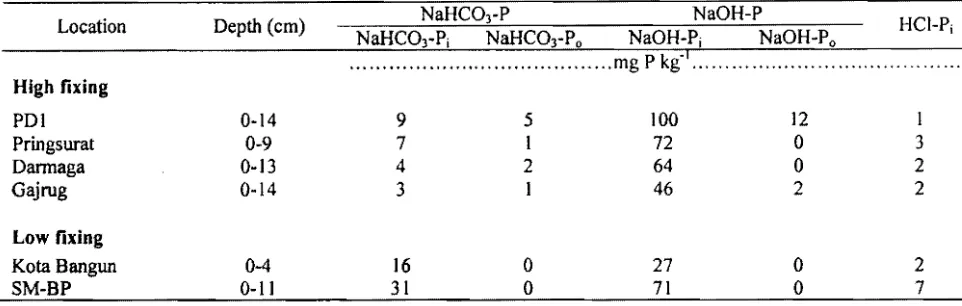
Table 5. P distribution after successive extraction excluded resinPi of 300 mg P kg'l added P.
NaHCO)P NaOHP
Location Depth (cm) HCIPi
[image:11.614.95.576.129.282.2]NaHCO)Pj NaHC03Po NaOHPi NaOHPo P k ,I
...mg g ... High fixing
PDl 014 9
Pringsurat 09 7
Darmaga 013 4
Gajrug 014 3
Low fixing
KotaBangun 04 16
SMBP 011 31
The Changes of P Distribution after Successive Resin Extraction of Soil Samples
The changes of P distribution after successive extraction of soil samples was evaluated to investigate how P released from P stronger bond fractions. The P distribution after successive extraction of soils samples except resinPi is presented in Table 5.
The amounts ofNaHC03Pj and NaOHPj were decreased after successive resin extraction. Compared to initial P fraction distribution (Table 3), it suggested that both labile and less labile Pj in the fOr:" of NaHC03Pj and NaOHP; fractions, respectIvely, can transform into resinPi when the resmPi decrease. The resinPj, NaHC03Pi and
NaOHPj appeared to be in equilibrium. Most of P rel:ased ゥセ@ high oxides soils namely Oarmaga, GaJrug, Prmgsurat and POI were from NaOHP fraction while low oxides soils, namely KoU: b。ョセオョ@ and SMBP were from NaHCO:\Pj.
5 100 12 I
I 72 0 3
2 64 0 2
I 46 2 2
0 27 0 2
0 71 0 7
Contribution from NaHC03Pj and NaOHPj to
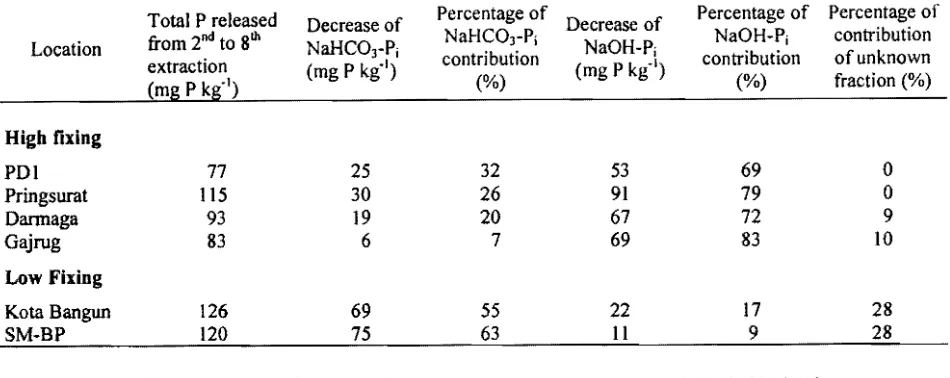
the total P released from 2nd to 8th extraction were calculated from the decrease of the data of P transformation experiment (Table 3) compared to the data of P distribution after successive extraction (Table 5).
The total P released from 2nd to 8th is presented in Table 6. The percentage of contribution of NaHC03Pj and NaOHP; to the total P released
2nd t 8th • • •
firom 0 extractIon IS presented m Table 7.
In high oxides soils (PO I, Oarmaga, Gajrug, Pringsurat ) more than 60% of P release derived from NaOHP; while in low oxides soils (Kota Bangun and SMBP) more than 50% P release derived from NaHC03Pj and only small amount P release derived from NaOHP; fraction. In soils from Kota Bangun and SMBP there was 28% contribution of P released from unknown fraction. This was probably derived from residual P.
Table 6. P イ・ャ・。セ・、@ in the form ofresinP; from lSI to 8th extraction and total P released from 2nd to Sth
extraction.
Location Depth
(cm) 2
Extraction number
3 4 5 6 7 8
Total P released from 2nd to 8th extraction
...gPkg,I ...
High fixing
POI 014 49 21 16 II 9 7 7 6 77
Pringsurat 09 77 39 24 15 II 9 II 6 115
Oarmaga 013 100 33 16 15 12 7 5 5 93
Gajrug 014 132 31 IS II 8 6 5 4 83
Low fixing
KotaBangun 04 108 43 25 20 13 10 12 3 126
SMBP 011 43 2S 22 IS 15 13 14 10 120
J. Tanah Trop., VoL 13, No.2, 2008: 87-94
Table 7. Contribution from NaHC03Pj and NaOHPj fractions to total P released from 2nd to Sib extraction.
Percentage of Percentage of Percentage of Total P released Decrease of Decrease of
NaHC03Pj NaOHP; contribution
from 2nd to 8th
Location NaHC03Pj NaOHP;
contribution contribution of unknown extraction (mg P kg·l
) (mg P kg·l)
(%) (%) fraction (%)
(mg P kg·l ) Higb fixing PDl 77 Pringsurat 115 Darmaga 93 Gajrug 83 Low Fixing Kota Bangun 126 SMBP 120 25 30 19 6 69 75 32 26 20 7 55 63 53 91 67 69 22 11 69 0 79 0 72 9 83 10 17 28 9 28
Among the high oxides soils, NaHC03Pj,
which originally occupied a small portion, seems to be firstly depleted. According to Table 3 and 5, the amount of NaOHPj which was left in that fraction after the successive extraction was higher (65%) in the soil from POI than in the soil from Pringsurat (44%), suggesting that P in POI soil were more difficult to release than that of Pringsurat soil due to higher factor scores of PC,.
Concerning two soils from Kota Bangun and SMBP, lower amounts of P was released from NaOHPi fraction than that from NaHC03Pj (Table
7), indicating that NaHC03Pi was released first when resinPi decreased. These two soils accumulated 300 mg P kg'\ added P in significant amounts into NaHC03Pj fraction (Table 3). When NaHC03Pj was high, NaOHPi was relatively more stable than NaHC03Pi despite resinPi removal as shown clearly in soil from SMBP. The results suggested that NaHC03Pj and NaOHPj are very
important P fractions in replenishing the labile resinPi in these acid upland soils because accumulation of added P mostly in these fractions and they can be readily dissolved. It was reported by Beck and Shanchez (1994), Guo el al. (2000),
and Zheng el al. (2003), NaOHPj was not a static fraction, instead it declined under crop. However for comparison, in Andisols the P replenishment from this fraction was very slow as reported by Beck el al. (1999). It suggested that chemisorbed P which partly to crystalline Al and Fe oxides in these soils was different from chemisorbed P to amorphous AI and Fe oxides in Andisols in term of bonding energy of P sorbed.
CONCLUSIONS
The study suggested that exchangeable AI which is associated with smectite increased rate constant of P released from soils.
The maximum P released was decreased by oxiderelated factor i.e. aluminum (AI) plus
112
iron (Fe) (by ammonium oxalate), crystalline AI and Fe oxides, cation exchange capacity, and clay content and increased by acidity plus 1.4 nm minerals-related factor i.e. exchangeable AI and 1.4 nm minerals (smectite and vermiculite).P fractionation analysis after successive resin extraction showed that both labile and less labile Pj
in the form of NaHC03-Pj and NaOH-Pi fraction,
respectively, can transform when in the resin-Pi is depleted. Most of P released in high oxides soils were from NaOH-Pj fraction while low oxides soils
were from NaHC03-Pi where P release from the
fonner fraction resulted in the a value lower than that of the latter one. When NaHC03-Pi was high, NaOH-Pi was relatively more stable than NaHC0
3-Pi despite resin-3-Pi removal.
NaHC03-Pj and NaOH-Pj are very important P
fractions in replenishing the most labile P (resin-Pi) in these acid upland soils.
REFERENCES
Amer, F., D.R. Bouldin, C. A. Black, and F. R Duke.
1955. Characterization of soil phosphorus by anion exchange resin adsorption and 32p equilibration.
Plant Soil 6: 391-408.
Beck, M.A, W.P. Robarge, and S.W. Buol. 1999.
A. fltlrtono: Releasing Pattern and Change ofPhosphorus Fractions with Resin
organic carbon by two Andisols. Eur. J. Soil Sci. 50: ) 57164.
Beck, M.A. and P.A. Sanchez. 1994. Soil phosphorus fraction dynamics during 18 years of cultivation on a typic paleudult. Soil Sci. Soc. Am. J., 58: 1424 1431.
Dalal, R.C. 1985. Comparative prediction of yield response and phosphorus uptake from soil using anionand cationanion exchange resins. Soil Sci. 139: 227231.
Delgado, A. and J. Torrent. 2000. Phosphorus forms and desorption patterns in heavily fertilized calcareous and limed acid soils. Soil Sci. Soc. Am. J. 64: 2031 2037.
Guo, F., R.S. Yost, N.V. Hue, C.l. Evensen, and J.A. Silva. 2000. Changes in phosphorus fractions in soils under intensive plant growth. Soil Sci. Soc. Am. J. 64: 16811689.
Hartono, A., S. Funakawa and T. Kosaki. 2005. Phosphorus sorptiondesorption characteristics of selected acid upland soils in Indonesia. Soil Sci. Plant Nutr. 51: 787799.
Hartono, A., S. Funakawa and T. Kosaki. 2006. Transformation of added phosphorus to acid upland soils with different soil properties in Indonesia. Soil Sci. Plant Nutr. 52: 734744
Lookman, R., D. Freese, R. Merckx, K. Vlassak, and W. H. Van Riemsdijk. 1995. Longterm kinetics of phosphate release from soil. Environ. Sci. Techno!. 29: 15691575.
Maguire, R.O., R.H. Foy, J.S. Bailey, and J.T. Sims. 200 I. Estimation of the phosphorus sorption capacity of acidic soils in Ireland. Eur. J. Soil Sci. 52: 479487.
Mattingly, G.E.G. 1975. Labile phosphorus in soils. Soil Sci. 119: 369·375.
Murphy, J. and J.P. Riley. ) 962. A modified single solution method for the determination of phosphate in natural waters. Anal. Chim. Acta 27: 3136. Saavedra, Co and A. Delgado. 2005. Phosphorus
fractions and release patterns in typical Mediterranean soils. Soil Sci. Soc. Am. J. 69: 607 615.
Saggar, S., MJ. Hedley, and R.E. White. 1990. A simplified resin membrane technique for extracting phosphorus from soils. Fert. Res. 24: 173180. Sibbesen, E. 1978. An investigation of anion exchange
resin method for soil phosphate extraction. Plant Soil 50: 305321.
Subagyo, H., N. Suharto, and A.B. Siswanto. 2000. Agricultural lands in Indonesia. In Indonesian Land Resources and Its management. p. 2165, Center for Soil and Agroclimate Research, (in Indonesian). Tiessen, H., and J.O. Moir. 1993. Characterization of
available P by sequential extraction. In Soil Sampling and Methods of Analysis, Ed. MR Carter, p. 7586, Canadian Society of Soil Science, Lewis Publishers.
Vadas, P.A. and J.T. Sims. 2002. Predicting phosphorus desorption from MidAtlantic coastal plain soils. Soil Sci. Soc. Am. J. 66: 623631.
Van Raij, B., J.A. Quaggio, and N.M. Da Silva. 1986. Extraction of phosphorus, potassium, calcium and magnesium from soils by an ionexchange resin procedure. Commun. Soil Sci. Plant Anal. 17: 547 566.
Releasing Pattern of Applied Phosphorus and Distribution Change
of Phosphorus Fractions in the Acid Upland Soils
with Successive Resin Extraction
Arief HartonoJ
Received 9 January 2007/ Accepted /9 December 2007
ABSTRACT
Releasing Pattern of Applied Phosphorus and Distribution Change of Phosphorus Fractions in the Acid Upland Soils with Successive Resin Extraction (A. Hartono): The releasing pattern of applied P in the acid upland soils and the soil properties influencing the pattern were studied. Surface horizons of six acid upland soils from Sumatra, Java and Kalimantan were used in this study. The releasing pattern of applied P (300 mg P kg'l) of these soils were studied by successive resin extraction. P fractionation was conducted to evaluate which fractions released P to the soil solution after successive resin extraction. The cumulative of resinPjlllltganic (Pi) release of soils was fitted to the first order kinetic. Regression 。ョ。ャケウセウ@ using factor scores obtained from the previous principal components analyses was applied to determine soil properties influencing P releasing pattern. The results suggested that the maximum P release was significantly (P < 0.05) increased by acidity plus 1.4 om mineralrelated factor (PCl ) i.e. exchangeable Al and 1.4 om minerals (smectite and vermiculite) and decreased by oxide related factor
(PCI ) i.e. aluminum (AI) plus 112 iron (Fe) (by ammonium oxalate), crystalline Al and Fe oxides. cation exchange
capacity. and clay content. P fractionation analysis after successive resin extraction showed that both labile and less labile in the form of NaHCOrPj and NaOHPj fractions, respectively, can be transformed into resinPi when in the most labile resinPi is depleted. Most of P released in high oxides soils were from NaOHPj fraction while in low oxides soils were from NaHC01Pi. P release from the former fraction resulted in the maximum P release lower than that of the latter one. When NaHCOJPi was high, NaOHPj was relatively more stable than NaHCOJPi despite resinPi removal. NaHCOJPj and NaOHPj are very important P fractions in replenishing resinPi in these acid upland soils.
Keywords: Acid upland soils. phosphorus, rea/easing pattern, successive resin extraction
INTRODUCTION
Most of the upland soils in Indonesia are acidic in reaction and found to be deficient in available phosphorus (P). Acid soils account approximately
57% of total upland soils and are developed from different kinds of parent materials (Subagyo el al.•
2000). P fertilization is a key component for increasing soil productivity in these acid upland soils. Transformation study of applied P in these soils showed that much of P fertilizer in soils with high amount of oxides in one cropping season (90
days) was transformed to chemisorbed aluminum (AI) and iron (Fe) oxides while in soils with low amount of oxides was transformed not only tochemisorbed to AI and Fe oxides but also on the
surface of AI and Fe oxides (Hartono el al., 2006).
P forms dictate the P release to soil solution. The P release in acid upland soils from P bonded by AI and Fe oxides in these acid soils are not evaluated. It is essential to know the longterm effects of the applied P in the soil. By using successive resin extraction, there is possibility to study the long term effect due to the characteristic of anion exchange resin as reported by Arner et al. (1955), Sibbesen (1978). Dalal
(1985), and Van' Raij et al. (1986). They reported that in determination of available P with anion exchange resin extractions, available P correlated well with plant P uptake. The resin acts as a sink for desorbed P in the same way as plant roots. Recently it was used to evaluate the
I Department or Soil Science and Land Resource. Faculty ofAgriculture, Bogor Agricultural University Jln Meranti,
Kampus IPB Darmaga 16680
J. Tanah Trop., VoL 13, No.2, 2008: 87·94 ISSN 08S2·2S7X
•
A. Ihrrtono: ReleaJing PalJern and Change ofPIlm;pllOrm Fractions witlt Resin
release pattern of P in heavily fertilized calcareous soils and limed acid soils (Delgado and Torrent, 2000) and in typical mediterranean soils (Saavedra and Delgado, 2005). Since the use of resin does not dismpt the chemical structure of the soil, it should be possible to make a series of extractions from one soil sample allowing the examination of the release characteristics of soil P from stronger P bond over time.
The P release characteristics may be different among soils with high or low amount of oxides due to difference of soil properties. The objective of the study were to evaluate the releasing pattern of P on soils with high amount of oxides and on soils with low amount of oxides using successive resin extractions and to evaluate the distribution change of P fractions after successive resin extraction.
MATERIALS AND METHODS
Soil samples. Surface horizons of six acid upland soils from Sumatra, Java and Kalimantan were used in this study. These soil samples were selected based on the results of P transformation study (Hartono et al., 2006). Based on the results of that study, PO I (Sumatra), Pringsurat (Java), Darmaga (Java). Gajrug (Java) represented soi Is with high amount of oxides. While Kota Bangun (Kalimantan) and SMBP (Kalimantan) represented soils with low amount of oxides. For convenience in discussion, soils with high amount of oxides is called high oxides soils and soils with low amount of oxides is called low oxides soils.
Parent materials and selected chemical and physical properties of the soils are listed in Table J. The methods to obtain their values were described in Hartono e/ al. (2005). Dominant si licate clay minerals in soi Is from PO I were kaolinite and AIinterlayered vermiculitechlorite intergrades, while soils from Pringsurat and Darmaga were kaolinite. Dominant silicate clay mineral in soil from Gajrug was smectite, while soils from Kota Bangun and SMBP were kaolinite and vermiculite.
In the previous study, the principal component analysis (PCA) was applied and three principal components (PCs) were extracted from the chemical and physical properties of 13 original soils (Hartono el al., 2005). PC I was interpreted as an
oxiderelated factor (amorphous AI and Fe oxides, crystalline AI and Fe oxides, cation exchange 88
o
¢
t " " I セBi@
...: t..) 00 d
N セ@
(;)"1>,0
Mr:",I.f"'I vB|セ@
t"'loo:t >,0 ヲセ@ (" セ@
... r . ... セ@ ッセセ@ N'l:1'M セセセ@ v)MM NNイZセセ@
'rl 00 0
lr. 00 t""
t"l ('01('" <Xl • . N '" .,, N t" セ@ 00
- -M
セッ
0\ :v\
セ@ セZ「@
セ@ 00
"<Or ""t
...oIr'lM I"!
カMゥセBGZ@ "1"
.,.
[image:19.625.394.530.152.749.2]J. Tanah Trop., VoL 13, No.2, 2008: 87-94
Tabel2. Factor scores of PC), PC2and PC3 of the soils used.
Soil samples Factor scores of PC I Factor scores of PC2 Factor scores of PCl
High fixing POI 2.09 Pringsurat 0.48 Darmaga 0.69 Gajrug 1.88 Low fixing
Kota Bangun 1.37
SMBP 1.05 1.55 1.06 0.15 2.69 0.02 0.01 2.89 0.96 0.29 1.67 0.81 1.09
capacity and clay content). PC2 was interpreted as an acidity plus 1.4 nm mineralrelated factor (exchangeable AI and 1.4 nm minerals i.e. smectite and vermiculite), and PC3 was interpreted as an
organic carbon (C)related factor (organic C and organically bound Fe). They were used again to describe soil properties in this study. Factor scores of PC" PC2 and PC) of the soils used is presented in
Table 2.
Incubation procedure. Duplicate 1 g samples were treated with 300 mg P kgI soil as a solution of KH2P04, mixed thoroughly, and incubated for 30 days at 25° C and 80% of field capacity. Controls without P addition were also included for each soil. 30 days was selected as a period of incubation, because most of selected soils in this study reached their equilibrium of P transformation in 30 days
(Hartono el al., 2006). The results of P fractionation according to Tiessen and Moir (1993) method of these selected soils after 30 days incubation based on the previous P transformation study is presented in Table 3 (Hartono et aI., 2006).
[image:21.614.69.557.563.735.2]Successive resin extraction procedure. Two resin strips oversaturated with bicarbonate and 30 mL of deionized water were applied to 1 g of soil in 50 mL centrifuge tubes and then shaken for 16 h. Resin strips were removed and washed with deionized water over a glass vial. Any soil trapped in the resin strips and lost from the bottle was collected, dried, and the weight loss was taken into account in the calculations of the amount of P extracted. Resin strips were placed in a clean 50 mL tube and applied 20 mL 0.5 mol L1 HCI and shaken for 16 h. After that resinPi was determined.
Table 3. P distribution of300 mg kg· 1 P added after 30 d of incubation.
NaHC03P NaOHP HCIPj
Location Depth (cm) ResinPi NaHC01Pi NaHC0 Recovery (%)
3Po NaOHPj NaOHPIl
k ·1
... m& :&
...
セ@....
"...
High fixing
POI 014 60 34 0 153 0 2 83
Pringsurat 09 72 37 0 163 19 8 100
Darmaga 013 108 23 2 131 4 2 90
Gajrug 014 144 9 5 115 39 2 100
Low fixing
Kota 04 128 85 0 49 0 1 88
Bangun
____________________ _______ ___ ____________________ - - - _ _ _ _ _ _ A. Hartono: Releasing Pattern and Change ofPhosphorus Fractions with Resin
MMMMMMMMMMMMMMMMMMMNMセセMMMMNMMセMMMMMMMMMMMMMMMMMMMMMMMMMMMMMMMMMMMMMMMMMMMMMMM
Duplicate I g soH samples
l
A set of eight successive resin extraction+
Determine Pinorsanic (Pi) ResinPi II
I I
I
セ@ セ@ セ@ セ@ 1
I
Add 30 mL 0.5 mol L ·1 NaHCO) and then shaken for 16 hセ@
Bicarbonate extractable Plolal (PI) . " Digest, detennine P,セMMMMMMMMMMMMMMMMセセセ@
1
P organic (Po) '" Pt Pi: NaHC03 PoPrecipitate organic matter
tIo"
Determine Pi : NaHC03Pi Add 30 mL 0.1 mol L ·1 NaOH and then shaken for 16 hMMMMMMMMMMMMNセ@ OH extractable PI セ@ Digest, determine P,
1
Porganic ( Po) = PI Pi : NaOH PoPrecipitate organic matter
tIo1Jo
Determine Pi : NaOHPi Add 30 mL I mol L·1 HCI and then shaken for 16 h [image:23.614.86.543.106.426.2]NMMMMMMMMMMMMMMMMMエiッセ@ HCI extractable Pi II> Determine Pi : HClP;
Figure I. Flow chart of the P fractionation into various inorganic and organicP fractions.
The resin strips was removed, washed and regenerated for further use as described by Saggar
et al. (1990) and Tiessen and Moir (1993). The
extraction of P from each sample was continued by placing a regenerated resin strips in the original centrifuge containing the soil and water suspension and the procedure was repeated. A set of eight successive extractions was performed. The values were obtained by subtracting the release resinPi with those of control.
P fractionation. After a set of eight successive extractions, P fractionation was performed to evaluate the changes of P fractions. P fractionation procedure was described in Figure I. Characterization of sequential soil P extraction was explained as follows: (i) resinPi was interpreted as P that is readily available to plant, (ii) NaHC03Pi, Porganic (Po) were interpreted as P which are strongly
related to P uptake by plants and microbes and bound to mineral surface, (Mattingly 1975; Tiessen and Moir 1993) (iii) NaOHPi• Po were interpreted as P which are more strongly held by chemisorption to Fe and AI components of soil surface and (iv) HCIPj was interpreted as CaP of low solubility.
The values were obtained by subtracting control from the recovery of P fractions.
RESULTS AND DISCUSSION
Successive Resin Extraction of Soil Samples
The cumulative of resinPi released by soi Is are presented in Figure 2. For describing the releasing of P pattern, the data was fitted to the first order kinetic as written below:
ResinPi = a (l_ek(numberofextnll:tion})
where the constant a is the maximum resin Pi release and k is the rate constant of cumulative resinPi released per resin extraction. The parameters of the equations are presented in Table 4.
•
•
•
•
these acid soils were reported decreased the P sorption maxima (Hartono et al., 2005). It suggested that exchangeable AI associated with smectite increased k value of resinPi released from soils.
PD 1 soil exhibited the lowest a value (Table 4). It was due to high factor score of PCI . The
stepwise regression showed that
a
valuesignificantly (P < 0.05) decreased with increasing of PCI and increased with increasing of PC2 as in
the equation below:
a = 199 18.3 PCl
+
14.8 PC2 (R2=
0.88*)PC) which is Crelated factor (organic C and organically bound Fe) was considered as not component to estimate
a
value because PC) made the equation was not significant statistically.P desorbability was reported to decrease with increasing Alo
+
Feo (Lookman etai.,
1995;Maguire et aI., 2001; Vadas and Sims, 2002). This
:::tSO
..r
::t::tIItI
.w :::too
g,.
II
•
tIItI
..§.. .A.
.:t to> ISO
•
Xt
+
%
:a
to>•
.A.
•
1!
g,.i
•
x
X
100
...
r: セ@.A.
'iI
•
]
SO セ@(3
J. Tanah Trop., VoL 13, No.2, 2008: 87.94
result suggested that not only oxiderelated factor where Alo
+
Feo was included but also the presence of exchangeable Al which is associated with 1.4 nm minerals should be included to estimate P desorbability in these acid upland soils. Due to low factor ウ」ッセウ@ of PCI thea
value of two lowoxides soils Kota Bangun and SMBP was higher than that of soil from PO 1. Low factor score of PCI
caused significant amounts of P distributed in the NaHC03Pi fraction (Table 3).
Two high oxides soils Pringsurat and PD1, exhibited the quite different pattern in maximum P released. Although their rate constants were similar but soil from Pringsurat had a higher a value (maximum P release) than PDt. This is because of factor score of PCI of POI soil was higher than that
of Pringsurat soil. It meant that PDl soil had higher amount of oxides than that of Pringsurat soil. ..
::t:: X
•
X+
Darmagat
*
*
• Gajrug•
e e ... Pringsurat X XPDl x )t( Kota Bangun eSMBP X 00 4 6 8
[image:25.614.135.502.375.572.2]Numb er Q f extraction
Figure 2. Cumulative of resinPi release extracted by successive resin extraction.
Table 4. The parameters of the equation.
Location Depth (em) Ie A (mgP kg'!)
High fixing
PDt 014 0.40 128 0.975
Pringsurat 09 0.46 190 0.985
Darmaga 013 0.64 188 0.945
Gajrug 014 0.88 205 0.914
Low fixing
Kota Bangun 04 0.53 232 0.972
SMBP Oll 0.21 200 0.995
[image:25.614.84.526.626.777.2]A. Harlono: Releasing Pattern and Change ofPhosphorus Fractions with Resin
Table 5. P distribution after successive extraction excluded resinPi of 300 mg P kg'l added P.
NaHCO)P NaOHP
Location Depth (cm) HCIPi
[image:27.614.95.576.129.282.2]NaHCO)Pj NaHC03Po NaOHPi NaOHPo P k ,I
...mg g ... High fixing
PDl 014 9
Pringsurat 09 7
Darmaga 013 4
Gajrug 014 3
Low fixing
KotaBangun 04 16
SMBP 011 31
The Changes of P Distribution after Successive Resin Extraction of Soil Samples
The changes of P distribution after successive extraction of soil samples was evaluated to investigate how P released from P stronger bond fractions. The P distribution after successive extraction of soils samples except resinPi is presented in Table 5.
The amounts ofNaHC03Pj and NaOHPj were decreased after successive resin extraction. Compared to initial P fraction distribution (Table 3), it suggested that both labile and less labile Pj in the fOr:" of NaHC03Pj and NaOHP; fractions, respectIvely, can transform into resinPi when the resmPi decrease. The resinPj, NaHC03Pi and
NaOHPj appeared to be in equilibrium. Most of P rel:ased ゥセ@ high oxides soils namely Oarmaga, GaJrug, Prmgsurat and POI were from NaOHP fraction while low oxides soils, namely KoU: b。ョセオョ@ and SMBP were from NaHCO:\Pj.
5 100 12 I
I 72 0 3
2 64 0 2
I 46 2 2
0 27 0 2
0 71 0 7
Contribution from NaHC03Pj and NaOHPj to
the total P released from 2nd to 8th extraction were calculated from the decrease of the data of P transformation experiment (Table 3) compared to the data of P distribution after successive extraction (Table 5).
The total P released from 2nd to 8th is presented in Table 6. The percentage of contribution of NaHC03Pj and NaOHP; to the total P released
2nd t 8th • • •
firom 0 extractIon IS presented m Table 7.
In high oxides soils (PO I, Oarmaga, Gajrug, Pringsurat ) more than 60% of P release derived from NaOHP; while in low oxides soils (Kota Bangun and SMBP) more than 50% P release derived from NaHC03Pj and only small amount P release derived from NaOHP; fraction. In soils from Kota Bangun and SMBP there was 28% contribution of P released from unknown fraction. This was probably derived from residual P.
Table 6. P イ・ャ・。セ・、@ in the form ofresinP; from lSI to 8th extraction and total P released from 2nd to Sth
extraction.
Location Depth
(cm) 2
Extraction number
3 4 5 6 7 8
Total P released from 2nd to 8th extraction
...gPkg,I ...
High fixing
POI 014 49 21 16 II 9 7 7 6 77
Pringsurat 09 77 39 24 15 II 9 II 6 115
Oarmaga 013 100 33 16 15 12 7 5 5 93
Gajrug 014 132 31 IS II 8 6 5 4 83
Low fixing
KotaBangun 04 108 43 25 20 13 10 12 3 126
SMBP 011 43 2S 22 IS 15 13 14 10 120
J. Tanah Trop., VoL 13, No.2, 2008: 87-94
Table 7. Contribution from NaHC03Pj and NaOHPj fractions to total P released from 2nd to Sib extraction.
Percentage of Percentage of Percentage of Total P released Decrease of Decrease of
NaHC03Pj NaOHP; contribution
from 2nd to 8th
Location NaHC03Pj NaOHP;
contribution contribution of unknown extraction (mg P kg·l
) (mg P kg·l)
(%) (%) fraction (%)
(mg P kg·l ) Higb fixing PDl 77 Pringsurat 115 Darmaga 93 Gajrug 83 Low Fixing Kota Bangun 126 SMBP 120 25 30 19 6 69 75 32 26 20 7 55 63 53 91 67 69 22 11 69 0 79 0 72 9 83 10 17 28 9 28
Among the high oxides soils, NaHC03Pj,
which originally occupied a small portion, seems to be firstly depleted. According to Table 3 and 5, the amount of NaOHPj which was left in that fraction after the successive extraction was higher (65%) in the soil from POI than in the soil from Pringsurat (44%), suggesting that P in POI soil were more difficult to release than that of Pringsurat soil due to higher factor scores of PC,.
Concerning two soils from Kota Bangun and SMBP, lower amounts of P was released from NaOHPi fraction than that from NaHC03Pj (Table
7), indicating that NaHC03Pi was released first when resinPi decreased. These two soils accumulated 300 mg P kg'\ added P in significant amounts into NaHC03Pj fraction (Table 3). When NaHC03Pj was high, NaOHPi was relatively more stable than NaHC03Pi despite resinPi removal as shown clearly in soil from SMBP. The results suggested that NaHC03Pj and NaOHPj are very
important P fractions in replenishing the labile resinPi in these acid upland soils because accumulation of added P mostly in these fractions and they can be readily dissolved. It was reported by Beck and Shanchez (1994), Guo el al. (2000),
and Zheng el al. (2003), NaOHPj was not a static fraction, instead it declined under crop. However for comparison, in Andisols the P replenishment from this fraction was very slow as reported by Beck el al. (1999). It suggested that chemisorbed P which partly to crystalline Al and Fe oxides in these soils was different from chemisorbed P to amorphous AI and Fe oxides in Andisols in term of bonding energy of P sorbed.
CONCLUSIONS
The study suggested that exchangeable AI which is associated with smectite increased rate constant of P released from soils.
The maximum P released was decreased by oxiderelated factor i.e. aluminum (AI) plus
112
iron (Fe) (by ammonium oxalate), crystalline AI and Fe oxides, cation exchange capacity, and clay content and increased by acidity plus 1.4 nm minerals-related factor i.e. exchangeable AI and 1.4 nm minerals (smectite and vermiculite).P fractionation analysis after successive resin extraction showed that both labile and less labile Pj
in the form of NaHC03-Pj and NaOH-Pi fraction,
respectively, can transform when in the resin-Pi is depleted. Most of P released in high oxides soils were from NaOH-Pj fraction while low oxides soils
were from NaHC03-Pi where P release from the
fonner fraction resulted in the a value lower than that of the latter one. When NaHC03-Pi was high, NaOH-Pi was relatively more stable than NaHC0
3-Pi despite resin-3-Pi removal.
NaHC03-Pj and NaOH-Pj are very important P
fractions in replenishing the most labile P (resin-Pi) in these acid upland soils.
REFERENCES
Amer, F., D.R. Bouldin, C. A. Black, and F. R Duke.
1955. Characterization of soil phosphorus by anion exchange resin adsorption and 32p equilibration.
Plant Soil 6: 391-408.
Beck, M.A, W.P. Robarge, and S.W. Buol. 1999.
A. fltlrtono: Releasing Pattern and Change ofPhosphorus Fractions with Resin
organic carbon by two Andisols. Eur. J. Soil Sci. 50: ) 57164.
Beck, M.A. and P.A. Sanchez. 1994. Soil phosphorus fraction dynamics during 18 years of cultivation on a typic paleudult. Soil Sci. Soc. Am. J., 58: 1424 1431.
Dalal, R.C. 1985. Comparative prediction of yield response and phosphorus uptake from soil using anionand cationanion exchange resins. Soil Sci. 139: 227231.
Delgado, A. and J. Torrent. 2000. Phosphorus forms and desorption patterns in heavily fertilized calcareous and limed acid soils. Soil Sci. Soc. Am. J. 64: 2031 2037.
Guo, F., R.S. Yost, N.V. Hue, C.l. Evensen, and J.A. Silva. 2000. Changes in phosphorus fractions in soils under intensive plant growth. Soil Sci. Soc. Am. J. 64: 16811689.
Hartono, A., S. Funakawa and T. Kosaki. 2005. Phosphorus sorptiondesorption characteristics of selected acid upland soils in Indonesia. Soil Sci. Plant Nutr. 51: 787799.
Hartono, A., S. Funakawa and T. Kosaki. 2006. Transformation of added phosphorus to acid upland soils with different soil properties in Indonesia. Soil Sci. Plant Nutr. 52: 734744
Lookman, R., D. Freese, R. Merckx, K. Vlassak, and W. H. Van Riemsdijk. 1995. Longterm kinetics of phosphate release from soil. Environ. Sci. Techno!. 29: 15691575.
Maguire, R.O., R.H. Foy, J.S. Bailey, and J.T. Sims. 200 I. Estimation of the phosphorus sorption capacity of acidic soils in Ireland. Eur. J. Soil Sci. 52: 479487.
Mattingly, G.E.G. 1975. Labile phosphorus in soils. Soil Sci. 119: 369·375.
Murphy, J. and J.P. Riley. ) 962. A modified single solution method for the determination of phosphate in natural waters. Anal. Chim. Acta 27: 3136. Saavedra, Co and A. Delgado. 2005. Phosphorus
fractions and release patterns in typical Mediterranean soils. Soil Sci. Soc. Am. J. 69: 607 615.
Saggar, S., MJ. Hedley, and R.E. White. 1990. A simplified resin membrane technique for extracting phosphorus from soils. Fert. Res. 24: 173180. Sibbesen, E. 1978. An investigation of anion exchange
resin method for soil phosphate extraction. Plant Soil 50: 305321.
Subagyo, H., N. Suharto, and A.B. Siswanto. 2000. Agricultural lands in Indonesia. In Indonesian Land Resources and Its management. p. 2165, Center for Soil and Agroclimate Research, (in Indonesian). Tiessen, H., and J.O. Moir. 1993. Characterization of
available P by sequential extraction. In Soil Sampling and Methods of Analysis, Ed. MR Carter, p. 7586, Canadian Society of Soil Science, Lewis Publishers.
Vadas, P.A. and J.T. Sims. 2002. Predicting phosphorus desorption from MidAtlantic coastal plain soils. Soil Sci. Soc. Am. J. 66: 623631.
Van Raij, B., J.A. Quaggio, and N.M. Da Silva. 1986. Extraction of phosphorus, potassium, calcium and magnesium from soils by an ionexchange resin procedure. Commun. Soil Sci. Plant Anal. 17: 547 566.