Lipid peroxides level in the Indonesian elderly
Purwantyastuti*, Sudijanto Kamso, F.D. Suyatna*
Abstrak
Suatu penelitian “cross-sectional” dilakukan untuk mempelajari hubungan antara kadar peroksida lipid plasma dengan usia serta factor-faktor lain yang ada pada kelompok lanjut usia. Empat ratus empat puluh pria dan wanita berusia 55-85 tahun dipilih secara random dari para lanjut usia binaan puskesmas di Jakarta. Pemeriksaan fisik setelah anamnesa dan juga pengambilan sampel darah dilakukan pagi hari dalam keadaan puasa. Lipid plasma dan peroksida lipid plasma diukur jumlahnya menggunakan metode standard. Didapatkan perbedaan kadar peroksida lipid yang berhubungan dengan umur; yaitu kadarnya terus meningkat sampai kelompok umur 70 tahun. Para lanjut usia yang berusia 70 tahun atau lebih mempunyai kadar peroksida lipid plasma yang lebih rendah. Kadar peroksida lipid ini tidak dipengaruhi oleh kadar lipid plasma. Kadar peroksid lipid meningkat pada mereka yang men-derita penyakit kronis degeneratif, makin banyak jenis penyakitnya makin tinggi kadar peroksida lipid. (Med J Indones 2005; 14: 71-7)
Abstract
A cross-sectional study was done to see the possible association of plasma lipid peroxides in the elderly with age and other factors. Plasma lipid peroxides is a product of free radical reactions which according to the latest theory of aging is the cause of aging process. Lipid peroxides were also found high in coronary heart disease. Four hundred forty relatively healthy elderly, age 55-85 years, were randomly chosen from free living elderly under guidance of health care centers (PUSKESMAS) in Jakarta. Anamnesis and physical examination were done in the morning in the health centers. Blood samples were taken in fasting conditions, plasma lipids and lipid peroxides were measured according to standard methods. There was an age difference of lipid peroxides level in the elderly, which increased with age up to 70 years old. Elderly 70 years old and over had low plasma lipid peroxides. The level was not related to high plasma lipids.Higher level was found when more chronic degenerative diseases were found. (Med J Indones 2005; 14: 71-7)
Keywords:lipid peroxides, aging
Many theories have been proposed to explain the aging phenomenon, and amongst all, the free radical theory fits best with the pathological processes in the elderly.1 Harman, who conceived the free radical theory of aging in 1956, presents evidence that endogenous free radical reaction cause cancer, atheroclerosis, hypertension, Alzheimer’s disease, and diabetes, among others.2
There is now much evidence that a substantial number of free radicals are produced in vivo and these agents can produce damage. By-products of oxygen metabolism have since been intensely studied and one of the most studied reactions in relation with aging is lipid
peroxidation. Lipid peroxidation lead to the formation of fluorescent, ceroid, and lipofuscin pigments, which are known to accumulate with age in tissues of a number of animals and are called “age pigment” found largely in the brain, myocardial cells, and liver parenchyma cells.3 Another support for the free radical theory of aging is observations that a major cause of pathological aging is atherosclerosis, a disease by itself related to lipid peroxidation.
Other data supporting this conclusion is the observation that the concentration of serum lipid peroxides is lower in human and higher in shorter-lived species.4 Lipid peroxides are the products of peroxidation reactions of fatty acids by oxygen free radicals in the body. Age dependent variation in the plasma concentration of lipid peroxide (MDA) in human is shown by Rodriguez-Martinez and Ruiz-Torres,5 which pointed out that there is a significant increase with age.
*
Department of Pharmacology, Faculty of Medicine, University of Indonesia, Jakarta, Indonesia
The objective of this study is to know whether lipid peroxides in the Indonesian elderly relates with their age, and whether there are conditions affecting its level in the elderly.
METHODS
The study is a part of a larger cross-sectional study in urban Jakarta, Indonesia. Subject were selected according to multistage random sampling, and the number was calculated based on probability proportionate to size (PPS) sampling method. Sample needed was 392, considering 10% drop-outs and rounded it became 440.
Subjects were members of elderly groups guided by Public Health Centers in Jakarta’s five municipalities. Subjects included were 55-85 years old, apparently healthy, ambulatory and not under treatment with vitamin E 100 mg / day or lipid lowering drugs. Total number of elderly registered in PHC in Jakarta was 3523.
Data collection
Fasting blood samples were collected in anticoagulant EDTA added (1 mg/ml) tubes in the morning starting at 8 a.m. Blood samples in the form of frozen plasma were stored in a freezer around -70o Celcius and were analyzed at the earliest possible time.
Plasma lipid peroxide levels were measured using the method introduced by Wills et al.6 For validation, a standard curve was developed for each batch and all measurements were done in duplicate. The results were expressed in nmol malondialdehyde/ml. The thio-barbituric acid reacting substances (TBARS) value was calculated against the standard and is considered as the lipid peroxides content of plasma.
Plasma lipid profiles were assessed by analyzing quantitatively plasma total cholesterol, HDL, LDL, triglyceride using standard procedures utilizing kits from Boehringer-Mannheim.
This study has been approved by the ethical committee of Faculty of Medicine University of Indonesia.
RESULTS
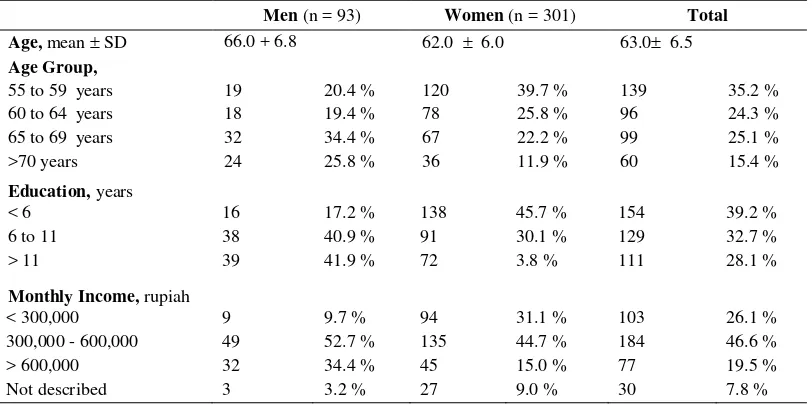
Educational levels were quite varied. There were 10.6% university graduates while 39 % did not finish
elementary school, including those with no formal education. Income levels were presented in quartiles, and majority was between Rp.300.000, - to Rp.600.000,-/month. Minimal income was Rp. 75.000,- and maximal Rp. 3.500.000, -.
Long term health status of the subjects was assessed through interview for chronic diseases that are related to aging and CHD. Incidences of chronic diseases found in the elderly are listed in Table 2. The chronic diseases reported here were based on the information received earlier by the subjects from their physicians or paramedics.
The percentage do not round up to 100% since one respondent may have more than one disease.
The most prevalent disease was cardiovascular diseases, and among them hypertension was the most suffered (33-35%) by the subjects. Included in atherosclerosis were angina pectoris, heart attack, and stroke. Dyslipidemia, which was also assessed objectively in this study, was known only by 9-11% of the subjects.
The most common digestive disorders were gastritis or gastric discomfort (22-24%). A small number of subjects with liver disease were included in this disease category. Not more than 18% of the subjects did not have any complaint or were considered healthy or free from chronic diseases by their medical personnel.
Table 1. General Characteristics of the Subjects by Gender
Men (n = 93) Women (n = 301) Total
Age, mean SD 66.0 + 6.8 62.0 6.0 63.0 6.5
Age Group,
55 to 59 years 19 20.4 % 120 39.7 % 139 35.2 %
60 to 64 years 18 19.4 % 78 25.8 % 96 24.3 %
65 to 69 years 32 34.4 % 67 22.2 % 99 25.1 %
>70 years 24 25.8 % 36 11.9 % 60 15.4 %
Education, years
< 6 16 17.2 % 138 45.7 % 154 39.2 %
6 to 11 38 40.9 % 91 30.1 % 129 32.7 %
> 11 39 41.9 % 72 3.8 % 111 28.1 %
Monthly Income, rupiah
< 300,000 9 9.7 % 94 31.1 % 103 26.1 %
300,000 - 600,000 49 52.7 % 135 44.7 % 184 46.6 %
> 600,000 32 34.4 % 45 15.0 % 77 19.5 %
Not described 3 3.2 % 27 9.0 % 30 7.8 %
Table 2. Self-Reported Chronic Diseases of the Indonesian Elderly Subjects in Jakarta, by Gender
Chronic Diseases Men (n= 93) Women (n= 301)
n % n %
Bone/Joint diseases: 33 35.2 113 39.1
Vascular diseases :
Hypertension 31 33.0 105 34.8
Atherosclerosis 6 6.4 38 12.6
Metabolic disorders:
Hyperlipidemia 8 8.5 33 10.9
Diabetes Mellitus 13 13.8 35 11.6
Obesity 4 4.3 31 10.3
Digestive disorders: 21 22.3 71 23.6 Respiratory diseases: 10 10.6 20 6.6 Genito-urinary diseases: 12 12.7 5 1.7 Others:
Cancer 1 1.1 8 2.6
Table 3. Plasma Lipid Profile of the Elderly Subjects in Jakarta by Gender
Plasma levels Male (n = 94) Women (n = 301)
Total Cholesterol, mg/dl 242.33 48.93 253.95 44.89
HDL, mg/dl 72.50 38.31 66.96 32.62
Cholesterol / HDL ratio 4.15 2.13 4.63 2.38
LDL, mg/dl 139.25 39.43 158.46 37.94
Triglycerides, mg/dl 147.84 53.29 147.28 56.15
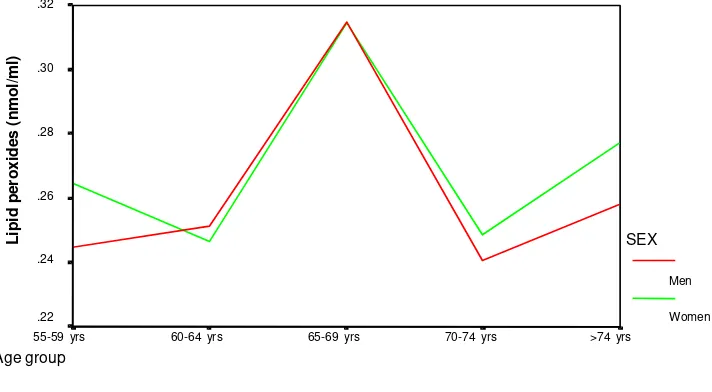
Fig. 1 Plasma Lipid Peroxides by age group and gender Age group
>74 yrs 70-74 yrs
65-69 yrs 60-64 yrs
55-59 yrs .32
.30
.28
.26
.24
.22
SEX
Men
Women
L
ip
id
p
e
ro
x
id
e
s
(
n
m
o
l/
m
l)
There was a tendency for the lipid peroxides levels to be higher with increasing age up to 69 years, but then after 70 years it was similar to those less than 65 years. The highest level of lipid peroxides in the elderly was in the age group of 65-69 years, and this value was significantly different from the other age groups (Figure 1). Using 65 years as a cut-off point, significantly different levels of plasma lipid peroxides were found between those aged less than 65 (0.2575 nmol/ml) and those aged more than 65 years old (0.2921 nmol/ml).
Table 5 shows that the highest range of plasma lipid peroxides level were found in the ages younger than 70 while the minimum level increases with age. Lipid peroxides in elderly with chronic diseases known as
risk factors for CHD was analyzed and compared according to number of diseases suffered. The result is presented in Table 6. It seemed that there was a similar trend in term of increasing number of selected CHD risks and lipid peroxides level. In the elderly men, lipid peroxides level tend to increase with more than one disease, while in women it started to increase when they had more than three diseases. Not all subjects were included in this assessment because 11 elderly men and 46 elderly women could not answer the specific questions.
Multiple regression analysis revealed that number of chronic diseases was not among the determinant of lipid peroxides level.
Figure 1. Plasma lipid peroxides by age group and gender
Table 4. Plasma Lipid Peroxides and the Age of the Subjects
Lipid peroxides, nmol/ml
n Men n Women
Gender 94 0.2700 0.1200 301 0.2702 0.1357
Age, years
55 –59 19 0.2448 0.1055 120 0.2646 0.1392
60 – 64 18 0.2519 0.1181 78 0.2466 0.1298
65 – 69 32 0.3148 0.1428 67 0.3146 0.1345
70 – 74 15 0.2405 0.0989 25 0.2486 0.1278
> 74 10 0.2528 0.0748 11 0.2770 0.1173
p ns 0.03
<65 yr 37 0.2459 0.0191 198 0.2575 0.0104
>65 yr 57 0.2750 0.0170 103 0.2921 0.0140
Table 5. Ranges of Lipid Peroxides Level in the Age Groups of the Elderly Subjects
Lipid peroxides levels Age groups
55-59 y 60-64 y 65-69 y 70-74 y > 74 y
Minimum nmol/ml 0.0245 0.0365 0.0840 0.0850 0.0912
Maximum nmol/ml 0.7658 0.7075 0.7245 0.5260 0.4485
Table 6. Plasma Lipid Peroxides in Elderly with One or More Chronic Degenerative Diseases by Gender
Lipid peroxides level (nmol/ml)
n Male n Women
No chronic disease 15 0.2592 0.0220 53 0.2616 0.0137
One disease 33 0.2569 0.0185 88 0.2792 0.0155
Two diseases 23 0.2764 0.0254 65 0.2599 0.0160
Three diseases 7 0.2991 0.0536 27 0.2385 0.0200
More than three 4 0.3403 0.0972 22 0.2904 0.0357
Values are in Mean SD
DISCUSSION
The present results showed that there was no gender
difference in plasma lipid peroxides levels in the elderly. Gender differences in the risk of getting CHD7 and in the mortality rate due to CHD8 have been reported in women before menopause, but not afterwards. Since all elderly women in this study were already in the menopausal stage, it is understandable that the lipid peroxides level, hypothesized as a CHD risk factor, was similar to the elderly men.
In term of age of the elderly, the highest lipid peroxides level was observed in the age group of 65 to 69 year for both genders, preceded by a steady increase with increasing age from 55 up to 65 year (Fig. 1). Observing that there was a lower level in the age group of 70 and over, the higher level in the former age group might indicate a higher risk in that age group. Further analysis of the high level of plasma lipid peroxides in this age group failed to reveal any associations with risk factor of CHD such as high plasma lipids, or with a certain food habit such as high fat intake. Therefore, the high level of lipid peroxides might be an independent factor relating to higher risk in that particular age group, especially since Indonesian’s life survival is in this age range, that is 66 for women and 63 for men.9
Rodriquez-Martines and Ruiz-Torres5 also showed that level of lipid peroxides is getting higher with advancing age. If lipid peroxides level could be considered as an established risk factor for CHD as proposed before10 the current finding indicates that the age of 65-70 year old is a critical period for the occurrence of CHD.
The group of elderly aged 70 years and over, who had survived the life survival limits, were likely consisted of those who had low lipid peroxides level, and it is possible that they have had that low level since they were younger. Interestingly, in the age groups of less than 70 years old the maximum level of lipid peroxides was at least 0.7075 nmol/ml, but in the groups older than 70 years there was no more such “high level” of lipid peroxides, the maximum was 0.5260 nmol/ml (Table 5). To what extent the level of lipid peroxides in old age could be used as a predictor of survival; a cohort study would be needed to answer this question. There was an observation earlier, though, that the concentration of serum lipid peroxides is lower in human than in shorter-lived species.4
against those toxic species. Since different species would be expected to have different endogenous levels of production of active oxygen species because of body size differences, then positive correlation of the ratio of antioxidant per SMR (specific metabolic rate) with MLSP (maximum life span potential) could be expected. To determine if this was true, earlier studies measured different antioxidant levels in different mammalian species having a wide range of life span. The first antioxidant measured in this way was superoxide dismutase (SOD) and the result showed a linear correlation between SOD concen-tration per SMR in liver of mammals and their MLSP. Men with the highest MLSP have the highest level of SOD concentration per SMR, and house-mouse with the lowest MLSP have the lowest level of SOD concentration per SMR. Men was followed by chimpanzee, gorilla, baboon, and rhesus in terms of life spans as well as SOD concentrations.11
Antioxidants that have been found so far to have positive correlation with life span of different mammalian species are Cu-Zn-SOD, Mn-SOD, carotenoids, and alpha-tocopherol. These positive correlation data strongly suggests that oxygen radicals are important in controlling aging and antioxidants maybe are important as anti-aging factors.3
Using 65 year as a cut-off point; the current study demonstrated that lipid peroxides level was significantly higher in the older age group (p<0.05). Currently 65 years was considered by some group of researcher to be the starting age of “old-elderly”. Harlan and Manolio12 found that coronary athero-sclerosis was present in autopsy in up to 60% of those aged 65 and older, but was absent in the remainder.
Even though this study showed a trend of increasing lipid peroxides level with increasing number of selected chronic diseases known as having high CHD risks, this trend was not affecting the findings related to age. In the elderly men as well as in women, this was proven through the screening of the significant determinant of lipid peroxides level in the elderly. Age was found as one of the determinants, while number of chronic diseases was not.
CONCLUSION
There was an age difference of lipid peroxides level in the elderly, which increased with age up to 70 years. Elderly of 70 years old and over had low plasma lipid
peroxide level. There was no gender difference in lipid peroxides level in the elderly. Even though this study showed a trend of increasing lipid peroxides level with increasing number of selected chronic diseases known as having high CHD risks, this trend was not affecting the findings related to age. Age was found as one of the determinants of plasma lipid peroxides level, while number of chronic diseases was not. Probably specific study on this aspect with sufficient sample size would be able to show a better result. The high level of lipid peroxides was not associated with high plasma lipids neither with high fat intake. Therefore, the high level of lipid peroxides might be an independent factor relating to higher risk in a particular age group, especially since Indonesian life survival is in this age range.
A larger study should be done to get the average levels of oxidation by free radicals in the elderly. Related conditions should be assessed as well to understand the conditions related to aging process. A cohort study should be started in Indonesia to understand the aging process and the possible related factors in relation to free radical theory of aging, such that efforts for prevention of early aging can be inisiated.
A cohort study would be needed to answer the question of “to what extent the level of lipid peroxides in old age could be used as a predictor of survival”.
REFERENCES
1. Gutteridge JMC, Halliwell B. Antioxidants in nutrition, health and disease. Oxford University Press, New York 1994.
2. Harman D. The aging process. Proc Natl Acad Sci 1981; 78:7124-8.
3. Ochi H. The Control of Human Aging. Japan Institute For The Control of Aging. Fukuroi, Japan, 1995.
4. Cutler RG. Evolutionary biology of aging and longevity. In: Aging and Cell Structure vol.2, Ed. Johnson JE pp371-428, Plenum, New York, 1984
5. Rodriquez Martinez MA, Ruiz-Torres A. Homeostasis between lipid peroxidation and antioxidant enzyme activities in healthy human aging. In: Mechanisms of Aging and Development, pp:213–222. Elsevier Publication, Ireland, 1992.
6. Wills ED. Evaluation of lipid peroxidation. In: Biochemical Toxicology a Practical Approach. Eds. Snell K and Mullock B. IRL Press, Oxford, Washington DC, 1987. 7. Lerner DJ, Kannel WB. Patterns of coronary heart
8. Khaw KT, Barret-Connor E. Sex differences, hormones, and CHD. In: Coronary Heart Disease Epidemiology. Eds. Marmot M, Elliot P pp274-86. Oxford University Press, Oxford, 1995.
9. Ananta A, Anwar EN. Projection of Indonesian population and labor force: 1995-2025. The Demographic Institute, Faculty of Economics, University of Indonesia, Jakarta, 1995.
10. Stringer MD, Gorog PG, Freeman A, Kakkar VV. Lipid peroxides and atherosclerosis. BMJ 1989; 298:281-4. 11. Tolmasoff JM, Ono T, Cutler RG. Superoxide dismutase:
Corellation with lifespan and specific metabolic rate in primate species. Proc Natl Acad Sci, 1980; 77:2777-81. 12. Harlan WR, Manolio TA (1995). Coronary heart disease