216
Halim et al. Med J IndonesRelationship Between Calcium Intake, Serum Ionized Calcium
and
Elevated
Blood Pressure
in Primigravida
after
24
weeks
of Gestation
Lukman
Halim*, Savitri Sayogo**, Handaja***
Abstrak
DatasuweiKesehatanRumahTanggatahun 1992 memperlihatkanangkakematianibudilndonesiamasihtinggi,425 per 100.000
kelahiran hidup. Salah satu penyebab kematian ibu ialah Eklampsia. Penyebab eklnmpsia belum diketahui dengan pasti, namun selalu didahutui dengan Preeklampsia. Hasil penelitian para ahli membuktikan terdapat hubungan terbalik antara masukan Kalsium (Ca) dengan angka kejadian Preeklampsia. Penelitian ini bertujuan untuk membuktikan adanya hubungan antara masul<an Ca, kadar ion Ca serum dengan kejadian Preeklampsia. Subyek penelitian meliputi 86 primigravida dengan usia kehamilan 24 minggu kemudian diikuti sampai usia kehamilan 36 minggu. Hasil penelitian menunjukkan bahwa masukan Ca pada usia kehamilan 24, 32 dan 36 minggn masing-masing 63%, 67Vo dan 63Va dari Angka Kecukupan Gizi (AKG). Kadar ion Ca serum pada usia kehamilan 24 dan 36 minggu, masing-masing 1,06 dan 1,05 mmol/I. Angka kejadian Preeklampsia didapatkan sebanyak 8,IVo,
I
orang didiagnosis pada usia kehamilan 32 minggu, sisanya pada usia kehamilan 36 minggu. Analisis statistik tidak mendapatkan hubungan yang bermakna antara masukan Ca, kadar ion Ca serum dengan Preeklampsia (p>0,05).Abstract
Data
from
the 1992 National Household Survey revealed that Matemal Mortality Rate (MMR) in Indonesia was still high, 425per 100,000
live births. One of the major cause of this high MMR is Eclampsia. Research has shown an inversed relationship betvveencalcium (Ca) intake and the incidence of Preeclampsia. Preeclampsia
it
self can be followed by Eclampsia. This study involving 86 primigravidas observedfrom 24 weeks to 36 weeks of gestation. The result showed Ca intake on 24th, 32nd and 36thweeks of gestation were 63 Vo, 67 Vo and 63 Vo of the Recommended Dietary Allowances (RDA) respectively. Serum ionized Ca bn 24th and 36th weeksof
gestation were L06 and 1.05 mmol/L The incidence of Preeclampsia was 8,1 Vo,I
diagnosed at 32 weeks of gestation and the other at 36 weeks of gestation. Statistical analysis showed no significant relationship between Ca intake, serum ionized Ca and the incidence of P re eklamp sia (p> 0.0 5 ).Keyw ords : calcium, preeclampsia, primipravida
INTRODUCTION
It
was noted
that Indonesia
hadthe highest Maternal
Mortality
Rate
(MMR)
among the Asean Countries.
Data
from
The
1992
National Household
Surveyshowed
that
MMR
decreasedfrom 450 per
100,000live
births to 425 per
100,000live births
in 1992. One
of
themajor
causeof this high MMR
is Eclampsia.
It
wasrevealed that Preeclampsia,
aPregnancy-induced
hypertension with proteinuria
and or edemacould
be aserious complication
to
Eclampsia.l
From
several
studies
in
Indonesia, the incidence
of
Preeclampsia* Department of Nutrition, Facuby of Medicine, Trisakti University, J akarta, Indonesia
**
Department of Nutrition, Faculty of Medicine, University of Indonesia, Jakarta, Indonesia***
Department of Obstetics and Gynaecology, Facultyof
Medicine, University of Indonesia, Jakarta, Indonesiaaf-Vol 6, No 4, October - December 1997
fect
circulating
concentration
of
parathyroid
hormone andrenin,
which
may modulated
intracellular
ionized
Ca,resulting in its
observedeffect on smooth-muscle
relaxation.o The
purpose
of this
study was
to
deter_mine the relationship
between Ca intake,
serum
ionized Ca and the incidence
of
preeclampsia in
primigravida
after
24 weeksof
gestation.METHODS
The
designof this
study
is
a crosssectional,
followed
by
follow-up study
ftom 24
weeks
to
36
weeks
of
gestation
involving
110 pregnant women.Fourty eight
women were out patients of Department
of
Obstetrics
and
Gyn
e,University
of
Indonesi
Cipto
Mangun_kusumo
from Maternity
Hospital
in
Jakarta.
Thestudy
wasconducted from March
1996until
August
1996.
The
inclusion criteria
for
subjects
of this
study
wereprimigravida without
any
seriousillness,
noneof
sub_jects
had
a
history
of
hypertension, cardiac
andgastrointestinal tract
diseases,blood
pressurewithin
anormal
limits, no
edema, normal
blood urea
andand negative urine
protein.
tt,
ere
interviewed
toidentify
th
of
and level
of
income.
Body
odpressure,
dietary evaluation
using 2 daysrecall
methodfor
calorie,
protein
and Caintakes
andblood
examina_tion for
serumionized Ca
were also measured.Follow up study
consisted
of
three observations,
on28th,32nd
and 36th weeksof
gestation. On 2gth weeks o3 b d
Ca.
was
determined
using
,'Kertu
Men
il".
Statistic
analysis ddneusing
chi
sRESULT
Eleven
of
the48
subjectsfrom RSUpNCM
and
l3
of
tbe 62 subjects
from RSBBK
wereexcluded
from
this
(Table
l).
Calcium and Blood pressure in
pimigravida
Zl7
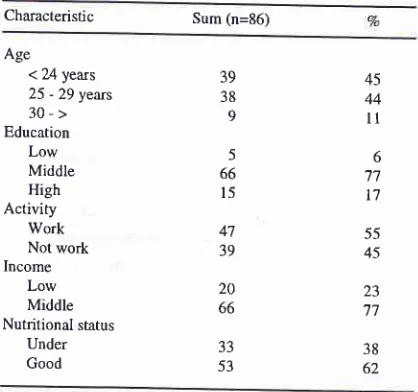
Table l. Characteristic of subjects
Characteristic Sum (n=86) Age
< 24 years 25 - 29 years 30-> Education Low Middle High
Activity
Work Not work Income
Low Middle Nutritional status
Under Good
39 38 9
5 66 l5
47 39
20 66
45 44
l1
6 '77
t7
55 45 23 '17
38 62 JJ
53
The
meancalorie intake
at
24,
32, and
36
weeks
of
gestation
were
1592+
358
,
1630+
352,
162g+
29g
KcaVdays, meanprotein
intake
were 59+
16,63+
16,
63
+
16grams/day
andmean Ca
intake
were 56g +
serum
ionized
Ca on24th
and36th
weeksof
gestationwere
1.06 + 0.06 and 1.05 + 0.05mmol/l
respecrively.
Table
2.
Result of Calorie, protein and Ca intakes according to Recommended Dietary Allowances( Vo Mean
t
Standard Deviation).24th weeks 32nd weeks 36th week Calorie
Protein Calcium
68.2 + 15.3 98.3 + 26.'1 63.1 + 25.9
69.8 + 15.I 105.0 + 26.7 67 .t + 22.7
69;7 + 12.8 105.0 + 26.7 62.6 + 22.6
Table
3.
Association between calcium intake and serum ionized calcium concentration on 24th and 36th weeks of gestation.Ionized Ca (mmoUl) <
1,03 > 1,03
0R24th weeks ofgestation
Ca intake(mg/day)
<900x
> 900 36th weeks ofgestation
Ca intake(rng/day) < 900 > 900
2t
0
25
I
57 8
55 4
1,89
0,18 - 46,72 [image:2.595.294.503.103.299.2]218 Halim et al.
There was no
significant difference
between Caintake
and serum
ionized
Caat24
and 36 weeksof
gestation(Table
3).Table
4.
Mean and standard deviation ofblood pressure on weeks ofgestation
Med J Indones
Table
6.
Association between diastolic blood pressure and variable factors on 24th,36Th weeks ofgestation.Var.iable
Diastolic Blood Pressure
(mmHg)
n
24weeks n
36 weeksBlood
pressure 24 wks
7O
L6
'lO r.7
71
t6
73+5 70+6
71 +8
7l
t7
70L6
67
+6
* 72+'l
7l
t7
67
t5
70+5 70+7
70 L7
71
f8
72r5
72+5 73+8 72+7
'14 r.9
72
xg
7l+8
'74+8
73rB
68 r.6
73+8
7l+8
Weeks of gestation28
wks
32wks
36 wksAge
< -24 25-29 30-> Education Low Middle High Income Low Middle
Nutritional status
Under Good
Ca intake(mg/day)
< 900 > 900
Ionized Ca (mmol/L) < 1.03
1,03-t,23 39 38 9 39 37 9 33 52
Systolic(mHg)
105r
9Diastolic(mmHg) 69 +7
106r.l0
107r.10
109r1070+7
7l+7
72+8 < 0.05 < 0.05 5 66 l5 20 66 33 53 2l 65 78 8 5 66 t4 l9 66 80 5 26 59 VariablesThere was an increased
systolic
and diastolic
blood
pressure
at 24
and36 weeks
of
gestation, but no
sig-nificant
difference (Table
4).Table
5.
Association between systolic blood pressure and variable factors on 24th and 36 weeks ofgestation.Systolic Blood Pressure
(mmHg)
36 weeks
*
p
0.05There
wasno significant difference between diastolic
blood
pressure andvariables, except nutritional
status(Table
6).Table
7.
Mean value and standard deviation of calorie intake, protein intake, Ca intake and serum ionized Ca concentration innormal and preeclamptic group.
Preeclampsia
Normal
p 24weeks
nAge(year)
<-24
25 -29 30-Education Low Middle High Income Low Middle
Nutritional status
Under Good
Ca intake(mg/day)
< 900
> 900
Ionized Ca (mmol/L) < 1.03 1.03- 1.23 39 38 9 5 66 l5 104+9
105
t
l0 109+6104t6
104i9
1091
ll
108+ll
104+9
l0l 17
*107
r
l0106+9 100+8
105i8
105
r
10109 + 1l
109 + 10
109+8
ll0f7
109ill
ll0+
5110+ l1 109+l
10619 *
lll r
l0ll0+
l0 105+5l10r
l0109
r
l0 39 37 9 5 66 l4 20 66 JJ 53 l9 66 33 52Calory intake (KcaVday) Week of gestation
32
weeks
1482xl84
36
weeks
1753 r.119Protein intake (g/day) Week of gestation
32
weeks
54t7
36weeks
62t16
1643
1362
> 0.051618i306
>0.0564x16
>0.05'13
tl4
> 0.05617
r.206
> 0.05567r208
>0.051,06 r.
0,06
> 0.051,06i0,05
>0.0578 8 2t 65 80 5 26 59
* p 0.05
There was no significant
difference between systolic
blood
pressure andvariables,
exceptnutritional
status(Table
5).Calcium intake (mg/day) Week of gestation
32 weeks
36 weeks Ionized Ca con.(mmol/L)
Week of gestation 24 weeks 36 week
455
r
l0l
508r
1231,07
f
0,05 [image:3.595.281.521.113.422.2] [image:3.595.26.262.178.264.2] [image:3.595.26.262.383.663.2] [image:3.595.287.525.514.735.2]Age
<-24
4 (10.3)25-29*
3(7.9)30->
*
0 EdùcationLow*
0Middle
*
5 (7.6)High
2 (13.3)Income
Low
3 (15.0)Middle
6 (6.1)Nutritional status
Under
4 (12.1)Good
3 (5.7)Ca intake(mg/day) <
900
7 (8.6)>900
0IonizedCa con(mmoUl)
VoI 6, No 4, October - December 1997
There was no significant difference
between calorie
intake, protein intake,
Caintake and serum ionized
Ca amongPreeclamptic
andNormal
subjects.Table 8. Association between Prceclampsia and Selected variables.
Prceclampsia
+
(7o)
- (Vo) Odds ratio (95VoCl)Calcium and Blood Pressure in
Pimigravida
219other hand, the maternal adjustment mechanism that
accomodatesthis high
Ca requirementis partially
in-hibited during this
period.
Increased
renal
Caexcre-tion
and matemal bone Caoccurs during
prognancy.
However, intestinal
absorption can increasefrom}7
Vobefore pregnancy
to
ashigh
as50
Voduring
gestationto
maintain
serum
ionized Ca concentration within
normal
limit.
In this
case acompensatory
increasein
parathyroid hormone levels
has beenobserved.lo This
mechanism
will
maintain
ionized Ca
concentration
within
normal
limir
(
1.03-
1.23mmoyl).
Parathyroid hormone
serum
level would involve
an increase in theintracellular cytosol concentration
ofCa
in several types of cells, such
askidney,
liver
andHeLa
cells. Two
mechanisms
can mediate
this
action:
anincrease
in
Ca
cellular
membrane
permeability
andactivation
of
adenyl cyclasewith
an increaseof
cyclic
adenosine monophosphate. Consequently
Ca
is
liberated from the mitochondria
to
the cytosol.
Theconcentration
of
intracellular (cytosolic) free Ca in
vascular smooth musclecells
determines the degreeof
tension
in
the muscle
and
is
a trigger
for
musclular
contraction.
This hypothesis
suggest
that
avasoconstrictive
effect, with
a risein blood
pressure,result
from
an
increase
in
vascular smooth'muscle
tension.l
IHypertension
with
edema
and
or
proteinuria
called
Preeclampsia. The uteroplacental bed holds the key tothe
understanding
of
the
cause and pathogenesis
of
Preeclampsia. The defect seen
in Preeclampsia
is alack
of or
anincomplete invasion
of
trophoblast into
thematernal
spiral
arteries.
This
changein
development
within
the spiral
arteries
establishes
a
mechanism
whereby
endothelial
cell injury
begins
with
the
production
of
mitogens,
a decreaseof
prostacyclines
and an increase of thromboxanA-II,
avasoconstrictor
and
platelet
proaggregator.
The
placental production
ofprostacycline
is
decreasedsignificantly.
This result
in
lessdilatation
in
the cardiovascular system
with
arelative
greater balanceof
the vasoconstrictor, throm-boxan,which probably contributes
to thevasoconstric-tion. These gradual and subtle changes
ultimately
leadto
an alteration
in cardiovascular
reactivitv
and
theeventual development
of
hypertension.12This
condi-tion with
increased
vascular
smooth
muscle
tension
caused increasedsensitivity
to
circulating
pressors.In this study there were
7preeclamptic subjects,
1 was diagnosed at 32 weeksofgestation
and theother at 36
weeks
of
gestation
(8.1Vo).
When compared with
Irawati,z
incidence
of
Preeclampsia
in
this
study was
lower. This
was due
to
subjects having
normal blood
35 (89.7)35 (82.1) 9 (r00)
5 (100) 6t (92.4)
l3 (86.7)
r7 (85.0) 62 (93.9)
29 (87,9) 50 (94.3)
74 (91.4) ** 5 (100)
2s (e2.6) 54 (el.s)
168
o49
(o.29-1o.25)
(0.07-4.14)
(o.43-16.62)
(0.40-14.15) 2.74
230
< 1.03 2 (7.4) (0.1 l -5.58)
1,03-1,23
5 (8.s)* Grouped for statistical analysis.
** p > 0.05
There
was
no significant
difference
between
Preeclampsia and Selected
variables (Table
8).DISCUSSION
Within
the
study
period,
serum
ionized Ca
declined
from
1.06 mmol/l
in
24
weeks
of gestation
to
1.05mmol/l
in
36
weeks
of
gestation. Dependent
t
teststatistical analysis showed that
the decreased was
not
significant (p>0.05).
In
the
same
period, Ca
intake
slightly
decreasedfrom 568 mg
day
at 24
weeks
of
gestation
to
563 mg/day at 36 weeks
of
gestation. Ca
intake
at24,32
and 36 weeks of gestation were63.l%o,67 .l%o and 62.6Vo
of
RecommendedDietary
Allowan-ces(RDA) for
pregnant women (900 mg/day)
respec-tively (Table
2). Data
of
Caintake
were collected by
recall
2
x
24 hours recall
method.
It
is
a
very
weak
assessment because
of its
dependanceon the
of
sub-jects to recall food
intake. The value
of
2
x
24 hours
recall
in
assesing the average intakeof
groupsis well
established.In this
study, multiple2x24 hours
recall
at
24, 32
and
36
weeks
of
gestation
improve
the
[image:4.595.40.275.148.413.2]220 Halim et aI.
pressure
at
enrollment,
normal blood
urea
and
creatinine
andfollow
up doneuntil
36 weeksof
gesta-tion.
Statistical
analysis between Preeclampsia
and
somevariables such
as age, education, income,nutritional
status,
Ca
intake
dan serum
ionized
Ca were
not
sig-nificant.
Neverless Ca intake
in
the
Preeclamptic
group was
lower
than the
Normal
group
at32
and 36weeks
of
gestation (Table
9).We
have observedin this
study:1.
The incidence
of Preeclampsiain
this study
was8.1Vo.
2.
There were no relationship between Ca
intake,
serumionized
Ca and elevated blood pressureafter
24 weeksof
gestation.Acknowledgment
The authors
wish to express
our thanks to
Dr.
SunartoWironagoro, DSOG
Head
of
"Rumah Sakit
Bersalin
Budi
Kemuliaàn"
for his valuables help in preparation
of this
study.REFERENCES
1. Departemen Kesehatan
RI,
Pola dan Faktor-faktor yang Berhubungan Dengan Kematian Ibu Melahirkan di RumahSakit Kelas C dan D di Indonesia. Jakarta,1995.
Med J Indones
2. Irawati D. Pola Tekanan Darah pada Kehamilan
"normoten-sil'
dan preeklampsia serta pengaruh paritas. Thesis. Jakarta:Universitas Indonesia, 1985
3. Zuspan FP. New Concepts in the Understanding of Hyper-tensive Diseases During Pregnancy.
In :
Sibai BM, editor.Clinics
in
Perinatology. Philadelphia: Saunders WB,1991; I 8:653-9.
4. Bardosono S. Magnesium and Blood Pressure Changes in Pregnancy. Thesis. Jakarta: Universitas Indonesia, 1 992.
5. Catatan Medik Instalasi Gawat Darurat. Rumah Sakit Umum
Pusat Nasional Cipto Mangunkusumo. Iakala, 1994 6. Forbes
GB.
Calcium Accumulation by the Human Fetus.Pediatrics,1976 ; 57 : 9'l 6.
l.Belizan
JM, Pineda O, Sainz E, MenendezLA,
Villar
J.Rise of blood pressure
in
calcium-deprived pregnant rats.Am J Obstet Gynecol.l98l; 14l:163-9.
8. Repke
JT,
Villar
J.
Pregnancy-induced hypertension andlow birth weight: the role of calcium. Am J Clin
Nutr
1991;54:2375-41S.
9.
Witschi JC.
Short-Term Dietary Recall and Recording Methods. In: Willett W, editor. Nutritional Epidemiology. New York: Oxford University Press, 1990:52-68.10. Heaney RP, Skillman TG. Calcium metabolism in normal
human pregnancy. J Clin Endocrinol Metab, 1971;
36:661-70.
11. Belizan JM, Villar J, Repke J. The relationship between
calcium intake and pregnancy-induced hypertension:
Up-to-date evidence. Am J Obstet Gynecol 1988; 158: 898-902.
12. Zuspan FP. New Concepts in the.Understanding of Hyper-tensive Diseases During Pregnancy.
In:
SibaiBM,
editor. Clinicsin
Perinatology. Philadelphia: Saunders WB, I 99 I ;