Faculty of Information and Communication
Technology
IDENTIFICATION MODEL FOR HEARING LOSS SYMPTOMS USING
MACHINE LEARNING TECHNIQUES
Nasiru Garba Noma
Doctor of Philosophy
IDENTIFICATION MODEL FOR HEARING LOSS SYMPTOMS USING MACHINE LEARNING TECHNIQUES
NASIRU GARBA NOMA
A thesis submitted
In fulfilment of the requirements for the degree of Doctor of Philosophy in Information and Communication Technology
Faculty of Information and Communication Technology
UNIVERSITI TEKNIKAL MALAYSIA MELAKA
DECLARATION
I declare that this thesis entitled “Identification Model for Hearing Loss Symptoms using
Machine Learning Techniques’’ is the result of my own research except as sited in the
references. The thesis has not been accepted for any degree and is not concurrently submitted
in candidature of any other degree.
Signature : ……….
Name : ………..
Date : ……….
DEDICATION To My Parents, My Beloved Wife, Whom without their Support
AKNOWLEDGEMENTS
I will like to show my appreciation to Professor Madya Dr. Mohd Khanapi Abd Ghani for his
immense contribution in supervising me throughout the research period. His advice, guidance
and encourage is immeasurable. I sincerely thank him for his tolerance and effort in providing
the direction of my research. Thank you, I am grateful.
It is in my delight that I express my admiration to the Faculty of Information and
Communication Technology for providing me with such great condition during the period of
my study and all the staff who assist in one way or the other during this period.
I wish to thank the Department of Otolaryngology, Hospital Sultanah Fatimah, Muar,
Johor for their support and cooperation and for making the sample medical audiology
records available for this research.
Finally, I am most indebted to my family, especially my father, Alh. Garba Mohd Noma, for
taking care of my tuition fees and living expenses. My mother, my wife, Rukayya, my
siblings, friends, and well-wishers for their immense support and prayers.
TABLE OF CONTENTS PAGE
1.3.2 To Design an Identification Model for Hearing loss Symptoms ... 3
1.3.3 To Evaluate the Identification Model ... 3
1.4 Research Questions ... 3
1.5 Relevance and Contribution of the Research ... 4
1.6 Organisation of the Thesis... 5
2.5 Hearing Loss Symptoms and Existing Method of Diagnosis ... 18
2.6 Review of other Approaches for Investigating Hearing Loss ... 26
2.7 Proposed Technique for Detecting Hearing Loss Symptoms ... 30
2.7.1 Relationship between Audiometry Thresholds and Patients Data... 32
2.8 Clinical Decision Support System ... 36
2.8.1 Impact of Clinical Decision Support System ... 38
2.9 Summary ... 42
CHAPTER 3 METHODOLOGY ... 44
3.2 Theoretical Perspectives and Research Methodologies ... 44
3.3 Data Collection ... 45
3.3.1 Selecting Data Samples ... 47
3.3.2 Data Preparation ... 49
3.3.3 Ethical Considerations ... 50
3.5 Discovering Relationship in Audiometry Dataset ... 50
3.5.1 Small Sample Dataset ... 51
3.5.2 Large Sample Dataset ... 52
3.6 Identifying Relationship with Association Analysis Algorithm ... 52
3.7 Feature Transformation with FP-Growth Algorithm ... 63
3.8 Patterns Evaluation ... 65
3.9 Symptoms Identification with Naïve Bayes Algorithm ... 67
3.10 FP-Growth and Bayesian Classifier ... 68
3.11 Performance Evaluation and Validation ... 73
3.12 Summary ... 74
CHAPTER 4 IDENTIFICATION MODEL FOR HEARING LOSS SYMPTOMS ... 76
4.1 Background ... 76
4.2 FP-Growth Algorithm ... 76
4.3 Naïve Bayes Algorithm ... 79
4.3.1 Naïve Bayes Algorithm in Healthcare ... 85
4.4 Proposed Identification Model ... 89
4.5 Summary ... 91
CHAPTER 5 RESULTS AND ANALYSIS ... 93
5.1 Background ... 93
5.2 Results from Association Analysis using Small Sample Dataset ... 93
5.3 Results from Association Analysis using Large Sample Dataset ... 101
5.4 Symptoms Prediction and Model Evaluation ... 104
6.4 Constraints and Limitations ... 121
6.5 Future Work ... 122
6.6 Reflections and Concluding observations ... 122
List of References... 124
5.11 Observed Giddiness association rules from the conditional FP-tree 101
5.12 Summary of Tinnitus and Vertigo association rules from Table 5.11 102
5.13 Summary of Results for Multivariate Bernoulli Model with 104
FP-Growth Feature Transformation
5.14 Summary of Results for Multivariate Bernoulli Model Without 105
FP-Growth Feature Transformation
5.15 Summary of Results for Multinomial Model with FP-Growth 106
Feature Transformation
5.16 Summary of Results for Multinomial Model without FP-Growth 107
3.12 Algorithm for Calculating Parameters for the Multinomial 72
Likelihood
3.13 Algorithm for Calculating Parameters for the Multivariate 73
Bernoulli Likelihood
4.1 Naïve Bayes Models Comparison for different Vocabulary 82
Sizes on Yahoo Dataset
4.2 Naïve Bayes Models Comparison for different Vocabulary 83
Sizes on Newsgroups Dataset
4.3 Naïve Bayes Models Comparison for different Vocabulary 84
Sizes on Industry Sector Dataset
4.4 Naïve Bayes Models Comparison different Vocabulary Sizes 85
on WebKB Dataset
4.5 Identification Model for Hearing Loss Symptoms 88
5.1 Validation Results using Multivariate Bernoulli Model 103
With FP-Growth Feature transformation
5.2 Validation results using Multivariate Bernoulli Model without 105
FP-Growth Feature transformation
5.3 Validation results using Multinomial Model with FP-Growth 106
Feature transformation
5.4 Validation results using Multinomial Model without FP-Growth 107
LIST OF APPENDICES
APPENDIX TITLE PAGE A Source Code 137
B Expert Validation 145
ABSTRACT
There is potential knowledge inherent in vast amounts of untapped and possibly valuable
data generated by healthcare providers. Clinicians rely in their knowledge and experience
and the basic diagnostic procedure to determine the likely symptom of a disease.
Sometimes, many stages of diagnosis and longer procedures can leads to longer
consultation hours and can consequently results to longer waiting time for other patients
that need to be attended to. This can results to stress and anxiety on the part of those
patients. This research presents an efficient way to facilitate the hearing loss symptoms
diagnosis process by designing a symptoms identification model that efficiently identify
hearing loss symptoms based on air and bone conduction pure-tone audiometry data. The
model is implemented using both unsupervised and supervised machine learning
techniques in the form of Frequent Pattern Growth (FP-Growth) algorithm as feature
transformation method and multivariate Bernoulli naïve Bayes classification model as the
classifier. In order to find, the correlation that exist between the hearing thresholds and
symptoms of hearing loss, FP-Growth and association rule algorithms were first used to
experiment with a small sample and large sample datasets. The result of these two
experiments showed the existence of this relationship and the performance of the hybrid of
the FP-Growth and naïve Bayes algorithms in identifying hearing loss symptoms was
found to be efficient with very minimum error rate.
ABSTRAK
Terdapat sejumlah besar pengetahuan yang dihasilkan daripada penyedia penjagaan
kesihatan yang masih belum diterokai dan sangat berharga. Kebiasaanya, para pengamal
perubatan menggunakan pengetahuan, pengalaman dan prosedur diagnosa untuk
mengenalpasti simptom bagi sesuatu penyakit. Kadangkala, proses diagnosa yang rumit
dan prosedur yang banyak mengakibatkan masa menunggu dan jangkamasa konsultansi
mengambil masa yang panjang dan lama. Senario sebegini boleh mendatangkan rasa stres
dan kebimbangan kepada pesakit. Penyelidikan ini membentangkan kajian kaedah yang
cekap dan memudahkan proses diagnosa bagi mengecam simptom kehilangan
pendengaran melalui kaedah rekabentuk model pengenalpastian simptom yang cekap
berdasarkan data “on air and bone conduction pure-tone audiometry”. Model yang
dicadangkan menggunakan kedua-dua kaedah pembelajaran mesin yang diselia dan tidak
diselia. Kaedah pembelajaran mesin yang digunapakai adalah dengan menggunakan
algorithma “Frequent Pattern Growth (FP-Growth)” yang bertindak menggunakan
kelebihan kaedah transformasi dan model klasifikasi “multivariate Bernoulli naïve Bayes”
sebagai pengkelasan. Untuk mencari hubungan yang wujud di antara ambang pendengaran
dan simptom kehilangan pendengaran, algorithma FP-Growth dan peraturan bersekutu
akan digunakan di peringkat awal bagi proses ujikaji dengan menggunakan sampel data
yang kecil dan juga dataset yang besar. Hasil kedua-dua ujikaji yang dijalankan
menunjukkan wujudnya hubungan dan gabungan prestasi algorithma FP-Growth dan
naïve Bayes di dalam proses mengenalpasti simptom kehilangan pendengaran. Hasil
CHAPTER 1 INTRODUCTION
1.1 Research Background
The overall aim of the research is to efficiently identify hearing loss symptoms from
pure-tone air and bone conduction audiometry thresholds in order to facilitate the procedure for
investigating hearing loss symptoms.
The process involves finding relationship that exist between pure-tone audiometry
thresholds and symptoms and other attributes in patient's medical audiology datasets and
utilizing these relationships in identifying hearing loss symptoms. The symptoms can be
accurately predicted with the aid of an identification model that employs hybrid machine
learning techniques that can predict a class or label of a given input air and bone
conduction pure-tone audiometry data.
1.2 Problem Statement
Statistics have shown the prevalence of disabling hearing loss to be very high in Asia
pacific; a region which Malaysia is part of (WHO | Estimates, 2012). In Malaysia alone,
about 31,000 cases of hearing loss were recorded in 1980 (Gallaudet encyclopedia, 1987).
In 2005, statistics from National Survey Disorder shows prevalence of 17.4% within the
population and about 3,962,879 cases were recorded during this period. This has made
hearing loss as one of the top 10 reported disease by the Ministry of Health Malaysia
(Mohd Hashim & Gazali, 2011). Hearing loss is one of the most common conditions that
affect children, younger and elderly adults, which if not diagnosed and treated on time can
leads to disability.
An otorhinolaryngology specialist classifies the hearing loss symptoms of a patient on the
basis of their knowledge and after going through the basic hearing loss symptom
diagnostic procedures. These procedures include 5 stages that are followed according to
order. They include collection of patient case history, Otoscopy, Audiometric hearing
tests, Tympanometry and Acoustic reflex. Considering the number of patients that usually
visits ENT department of various hospitals for consultation with the otorhinolaryngology
specialist in order to get their hearing problem diagnosed, the number of procedures and
the time it takes for each procedure to be completed, these stages can significant delay the
process and leave many patients waiting in a queue for many hours. On the part of the
patients that were on the queue, longer waiting time can cause stress and anxiety. This can
taint the patients’ perception of the health system. Therefore, possible solutions are needed
to reduce average patients waiting time in order to decrease the relative cost of
consultation to the hearing loss patients.
1.3 Research Objectives
The research objectives of this research are summarised as follows:
1.3.1 To Study the Existing Literature
The first objective of this research is to study the existing basic method of investigating
hearing loss symptoms in patients and to find the problems associated with the method.
And also, to study the existing body of literatures that show the existence of relationship
or connection between hearing loss patient’s pure-tone audiometry data and any attribute
1.3.2 To Design an Identification Model for Hearing loss Symptoms
The second objective is to design an identification model for identifying hearing loss
symptoms that employs hybrid machine learning technique to efficiently detect hearing
loss symptoms given pure-tone audiometry thresholds. The model will be made up of both
unsupervised and supervised learning techniques that detect the symptoms with high
accuracy. FP-Growth algorithm is used as the unsupervised learning algorithm and naïve
Bayes classification algorithm will be used as the supervised learning algorithm.
1.3.3 To Evaluate the Identification Model
The third objective is to evaluate the efficiency of the identification model using both
expert validation and a statistical validation technique. The statistical technique to be used
is the random repeated sub-sampling cross validation technique. It is a statistical method
for evaluating learning algorithms by partitioning the data into training and validation sets.
It will be used to estimates the accuracy of the model in identifying hearing loss symptoms
given both air and bone conduction pure-tone audiometry data.
1.4 Research Questions
After the survey of various literatures on pure-tone audiometry, hearing loss etiologies and
attributes in medical audiology records of hearing loss patients. Those studies that
indicates a connection between patient’s audiogram thresholds and their age, gender or
disease have motivates raising the question of whether there is a relationship or connection
between patients audiogram configuration and the diagnosed symptoms. This has also led
to the question of whether the existence of relationship between audiogram thresholds and
diagnosed symptoms could help in predicting hearing loss symptoms. Based on this the
two research questions are:
Research Question 1
Is there any relationship between patient’s pure-tone audiometry thresholds and hearing
loss symptoms?
As earlier mention this question was brought about due to the engagement with relevant
body of literature. It depicts possible connection between two variables that are to be
tested. Gray (2009) pointed out that a good research question should describe potential
relationships between and among variables that are to be tested.
Research Question 2
Can patterns that describe the relationship between pure-tone audiometry thresholds and
hearing loss symptoms be used to predict symptoms?
This research question is dependent on the first research question. It is only applicable if
those extracted patterns from the computational algorithm employed show any
relationship. That is if patients audiogram configuration had any effect on the symptoms,
otherwise it will not be applicable. For this research it is applicable because those patterns
generated by FP-Growth algorithm have revealed relationship between pure-tone
audiometry and hearing loss symptoms.
1.5 Relevance and Contribution of the Research
There is large amount of data that pervade the healthcare industry (Mowerman, 2007).
This data needs to be utilized using the proper techniques in order to realize the value and
the knowledge that may be inherent in it. With the advancement in information technology
and the wide adoption of health information system (HIS) healthcare providers can no
The healthcare worker goes through multi-spectral data and various information sources
when diagnosing a disease in order decide on the appropriate treatment strategy. This
research can help in the discovery of new and useful patterns in audiometry datasets of
patients. The computational algorithm can be used to implement audiology decision
support system (ADSS) that learns from past experiences and predict likely symptoms
with high accuracy and minimal error rate. The clinician can use both his knowledge and
the system to make better analysis of patient hearing test result and make more informed
and better decision than either him or the ADSS could make.
This work contributes to the existing body of knowledge by providing an efficient
approach to feature transformation that can enhance the accuracy of text classification
algorithms. The current findings of this research can also add to a growing body of
literature on connection between patient’s audiogram configurations and structured data
like age and gender and free text data such diagnosis and medical history in patients’
medical record.
1.6 Organisation of the Thesis
The thesis is structured in this order: Chapter 1 starts with the Research background which
is 1.1, then Problem statement and Research objectives in sections 1.2 and 1.3
respectively. Research questions are in section 1.4, Relevance and contribution of the
research in section 1.5 and Organization of the thesis on section 1.6.
Chapter 2 introduces the main components that make up the research. Literatures relating
to each of these components are reviewed. Problems that are presented in Chapter 1 are
also highlighted.
Chapter 3 summarises the theoretical research perspective adopted for the research. It also
presents the research methodology used and data collection methods; the ones that were
adopted for this research and why they were adopted.
Chapter 4 discusses the proposed identification models for hearing loss symptoms that
help in accomplishing the research objective. Detailed explanation of the proposed
solution is provided.
Chapter 5 depicts the results in tabular form and bar graph and discusses the findings from
experiments carried out in the research.
Chapter 6 concludes the thesis by restating the aims and objectives of the research. The
research contribution is discussed. It summarises the research findings and their
CHAPTER 2
LITERATURE REVIEW
2.1 Background
The overall aim of this chapter is to discuss the prevalence of hearing loss in selected
regions with focus on Asia Pacific and Malaysia in particular, the categories, severities
and symptoms of hearing loss and the existing method of investigating hearing loss
symptoms. Then, identify the problem with the existing method. Most part of the chapter
reviewed the current approaches or techniques proposed by other literatures in order to
improve the process of investigating hearing loss. The chapter critically evaluate these
different methods and the problems associated with them. The chapter also introduce the
proposed appropriate technique for detecting hearing loss symptoms in patient; a
technique which also addresses the research questions for this research. This chapter
provide some review of literatures indicating relationship between audiometry
configuration and some hearing loss patients attributes. It ends with discussing the
meaning and impact of clinical decision support system and the contribution of researchers
in this area.
2.2 Prevalence of Hearing Loss
It was estimated, about of 360 million people around the world are affected with hearing
impairment (WHO, 2013 ). That is approximately 5.3% of the world’s population. The
prevalence of hearing loss has been found to be the highest in Sub-Saharan Africa, South
Asia and Asia pacific (WHO | Estimates, 2012). In Malaysia, about 31,000 cases of
hearing loss were recorded in 1980 (Gallaudet encyclopedia, 1987). In 2005, statistics
from National Survey Disorder shows prevalence of 17.4% within the population and
about 3,962,879 cases were recorded. This has made hearing loss as one of the top 10
reported disease by the Ministry of Health Malaysia (Mohd Hashim & Gazali, 2011).
According to the World Health Organization (WHO), disabling hearing loss or deafness is
a type of hearing loss that is greater than 40 decibels (db) in adults and greater than 30
decibels in children between the ages of 0 – 14 years (WHO Estimates, 2012).
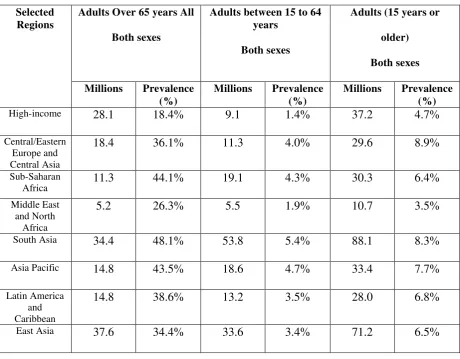
Table 2.1 Prevalence of disabling Hearing Loss in Population (15 years and above)
Among Regions across the World
From table 2.1, it can be observed, within the population of people with hearing loss, the
percentage of aged people that are over 65 years with disabling hearing loss years is higher
in Sub-Saharan Africa, South Asia and Asia Pacific. It is highest in South Asia with 48.1%