Editor-in-Chief
Sung H. Han
Dept. of Industrial and Management Engineering, POSTECH
San 31 Hyoja, Pohang, 790-784, South Korea
Tel: 82-54-279-2203, Fax: 82-54-279-2870 E-mail: [email protected]
Founding Editor-in-Chief
Min K. Chung
Dept. of Industrial and Management Engineering, POSTECH
San 31 Hyoja, Pohang, 790-784, South Korea
Tel: 82-54-279-2192, Fax: 82-54-279-2870 E-mail: [email protected]
Editors
Masaharu Kumashiro Dept. of Ergonomics,
University of Occupational and Environmental Health
1-1 Iseigaoka, Yahatanishi-ku Kitakyushu, 807, Japan Tel: 81-93-691-7458
E-mail: [email protected]
Mao-Jiun J. Wang
Dept. of Industrial Engineering and Engineering Management,
National Tsing Hua University 101 Sec. 2, Kuang Fu Rd., Hsinchu 300, Taiwan, ROC
Tel: 886-3-5717654 Ex. 3956 E-mail: [email protected]
Suebsak Nanthavanij Dept. of Industrial Engineering, Sirindhorn International Institute of Technology, Thammasat University Pathumthani 12121, Thailand Tel: 66-2-986-9009
E-mail: [email protected]
Barbara McPhee
The OH&S Services Network
6 Aitchandar Road, RYDE, NSW, 2112, Australia
Tel: 61-2-9808-2556
E-mail: [email protected]
Alan H. S. Chan
Dept. of Manufacturing Engineering and Engineering Management,
City University of Hong Kong
Tat Chee Avenue, Kowloon, Hong Kong Tel: 852-27888439, Fax: 852-27888423 E-mail: [email protected]
Sheng Wang
Dept. of Occupational and Environmental Peking University Health Science Center Beijing, 100083, China
Tel: 86-10-82801533, Fax: 86-10-82801533 E-mail: [email protected]
Rosnah Mohd. Yusuff
Dept. of Mechanical and Manufacturing Engineering, Faculty of Engineering, University Putra Malaysia
Editorial board
Eric Min-yang Wang, National Tsing Hua University, Taiwan, ROC
Chia-Fen Chi, National Taiwan
University of Science and Technology, Taiwan, ROC
Sheue-Ling Hwang, National Tsing Hua University, Hsinchu, Taiwan, ROC Eui S. Jung, Korea University, Seoul,
Korea
Mitsuyuki Kawakami, Tokyo
Metropolitan Institute of Technology, Tokyo, Japan
Lihua He, Peking University Health Science Center, Beijing, China Xianghong Sun, Chaoyang District
Institute of Psychology, Chinese Academy of Sciences, Beijing, China Chiuhsiang J. Lin, Chung Yuan Christian
University, Taiwan, ROC
Dyi-Yih Michael Lin, I-Shou University, Taiwan, ROC
Koya Kishida, Takasaki City University of Economics, Takasaki-city, Japan Ian Gibson, Ergotec, Ashfield, Australia Kwan S. Lee, Hongik University, Seoul,
Korea
Kee Yong Lim, Nanyang Technological University, Singapore
Min Yong Park, Hanyang University, Seoul, Korea
Akihiko Seo, Fukui Medical University, School of Medicine, Fukui, Japan Antonios Vitalis, Massey University,
Palmerston North, New Zealand Youlian Hong, Chinese University of
Hong Kong, Hong Kong
Richard So, University of Science and Technology Clear Water Bay, Hong Kong
Simon Yeung, Hong Kong Polytechnic Universit, Hong Kong
Asian Journal of Ergonomics is published biannually by the Pan-Pacific Council on Occupational Ergonomics. Dept. of Ergonomics. IIES, UOEH, 1-1, Iseigaoka,
Yahatanishi-ku, Kitakyushu, 8078555, JAPAN. Annual subscription rates are: US$20 for PPCOE members; US$40 for individual; and US$100 for institutions.
Subscriptions outside Hong Kong are requested to pay by bank draft payable to the Pan-Pacific Council on Occupational Ergonomics. All correspondence regarding subscriptions should be sent to: Dr. Alan Chan, Treasurer of PPCOE, Department of MEEM, City University of Hong Kong, 83 Tat Chee Avenue, Kowloon, Hong Kong([email protected])
ㅋㅋ
Vol. 9
2009
Contents
Development and Evaluation of Bus Seat Dimension to Improve the Fit and Comfort of Malaysian Bus Drivers
M.Y. Rosnaha, Y. M. Shahira, M.T. Samsul Baharib, W.C. Zaharahb
1
Data entry task in mobile computing:
effects of vibration, display colour, and user age
Zulquernain Mallick
19
Cognitive performance of grass trimmers in noisy conditions – the effect of user age
Zulquernain Mallick
33
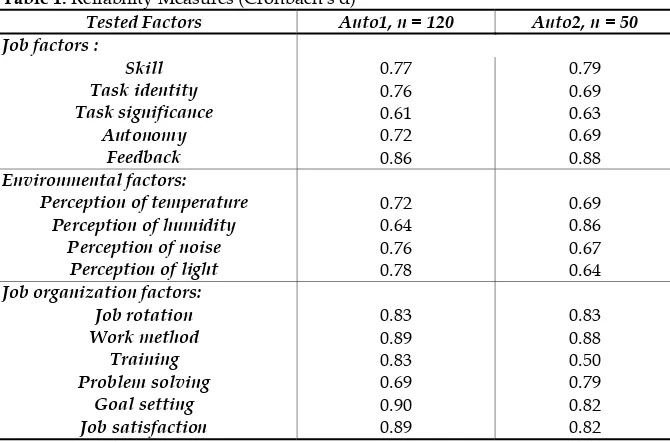
Correlation of job satisfaction with job characteristics, job organization and environmental factors in two Malaysian automobile factories
S.Z. Dawal, Z. Taha, Z. Ismail
49
Chronic Exposure Index Model to Assess Ergonomic Risk Factor Related to Upper Extremity Musculoskeletal Disorders
Seyyed Ali Moussavi-Najarkola
63
Laboratory Study of Factors Affecting Sitting Comfort and Discomfort 79
M.G.Mohamed Thariq , Weining Fang , Lijian Zhang , Harsha Munasinghe
A study of ergonomic factors contributing to the occurrence of occupation related musculo-skeletal problems in garment workers
Senthil Kumar.R.K, Bobby Joseph, Padmanaban sekaran, Sulekha, Kurian Zachariah, Rajalakshmi Hariharan
99
Redesign of a hand pallet truck by integrating ergonomics analysis and quality function deployment
109
Asian Journal of Ergonomics Vol.9 (2009) 1-17
Development and Evaluation of Bus Seat Dimension to
Improve the Fit and Comfort of Malaysian Bus Drivers
M.Y. Rosnaha1∗, Y. M. Shahira1, M.T. Samsul Baharib2, W.C. Zaharahb2
1 Department of Mechanical and Manufacturing Engineering, Faculty of Engineering, 2 Department of Community Health, Faculty of Medicine and Health, University Putra Malaysia,
43000 UPM, Serdang, Selangor, Malaysia
Abstract
A bus seat design that increases the comfort of the drivers may help to reduce their fatigue and to increase their alertness, thus reducing the accident rate. Commercial vehicles in Malaysia are imported, but the fit between their dimensions and those of the Malaysian population has not been studied. The objective of this study is to use anthropometry to design a seat that is appropriate for Malaysian bus drivers. This study uses qualitative methods including observation and a survey to collect the data. Anthropometric data were used to propose the recommended seat design. The current and recommended seat designs were simulated to analyse the comfort of the seat for bus operators and comparisons were made. In simulations of the current seat dimensions with the drivers’ anthropometric dimensions, the Rapid Upper Limb Assessment (RULA) score showed that the design of the seat must be modified to accommodate the range of dimensions of the population of Malaysian bus drivers. The proposed seat design based on the anthropometric dimension of the bus drivers showed a lower RULA score, indicating that considering ergonomics in the design of the seat can increase the comfort, safety and health of the drivers, and also the safety of the passengers.
Keywords: Bus seat design, Malaysian, anthropometry, comfort, biomechanics, work-related musculoskeletal disorder
1. Introduction
Bus driving is characterized by psychological and physical stresses. Most severe are the stresses of traffic in big cities, because of the heavy traffic and frequent stops. In most transit companies, the drivers must, in addition to driving responsibilities, handle tasks such as selling tickets, observing passenger loading and unloading and providing information to passengers. Psychological stresses result from the
*
responsibility for the safe transport of passengers, scant opportunity to communicate with colleagues and the pressure to keep to a fixed schedule. Rotating shift work is also psychologically and physically stressful. Ergonomic shortcomings in the driver’s workstation increase physical stresses [1].
Musculoskeletal disorders (MSDs) are among the leading causes of occupational injury and disability, with back pain the most common reason for the filing of workers’ compensation claims. Back pain accounts for about 25% of all disability claims and for about 40% of absences from work. In the United States, in 1990, the cost of back pain was estimated to be between $50 billion and $100 billion [2].
Strong evidence exists that musculoskeletal disorders are associated with workplace physical factors and non-work related characteristics. The workplace physical factors include heavy physical work, lifting and forceful movements, awkward postures, whole-body vibration, and static work postures. Static work postures of prolonged standing, sitting, and sedentary work are isometric positions where very little movement takes place. These postures are typically cramped or inactive and cause static loading on the muscles [3].
In studies of back pain among professional drivers, postural stress, muscular effort and long-term exposure to whole-body vibration were consistently associated with driving motor vehicles for extended periods of time [4]. Even in non-driving postures, bus drivers reported back and neck pain more frequently than workers in other professions [5].
This paper presents the development of bus seat design parameters for Malaysian bus drivers as an engineering intervention to improve their comfort and health.
1.1. Bus driving posture
Analysis of driving postures used by bus drivers should consider biomechanical factors, and ensure that all driving tasks are conducted within a comfortable reach range. The posture of the seated person depends on the design of the seat itself, on individual sitting habits, and on the work performed.
The primary interest in the bus operator’s workstation is the relationship between the operator’s seat, steering column and wheel, and pedals. Bus operators are required to interact and maintain constant contact with each of these components. It is the use and combination of these components that influence the operator’s posture [6].
The driver’s seat is fitted into a cramped space because the vehicle is usually designed to maximise the number of passenger seats. The design of the driver’s workstation must not only consider the tasks performed by the driver but also the physical characteristics of the driver and the accommodations required that permit the full range of seat adjustments [2].
Development and Evaluation of Bus Seat Dimension to
Improve the Fit and Comfort of Malaysian Bus Drivers 3
position of the neck, shoulders, and upper extremities. Therefore, along with the seat itself, the work to be performed must be considered [6], [7].
A body position or posture is considered appropriate if the weight of an individual’s body is transmitted to the seat with the least possible stress on the body [8]. The weight of the head, the trunk, and the thighs are borne by the headrest, backrest, and seat pan; the weight of the lower legs and feet is transmitted to the floor, suitable footrest, or in the case of a bus operator’s workstation, the foot pedals.
1.2. MSDs among Malaysian bus drivers
The prevention of musculoskeletal disorders is achieved by interventions, which reduce the probability and severity of injuries. Ergonomic design may reduce the incidence of compensable back pain by up to one-third [9].
In a study [10] of MSDs among 308 Malaysian bus drivers, the most common complaint (63.2%) was lower back pain while driving, followed by neck pain (54.3%), upper back pain (41.8%), and shoulder pain (30.7%), (Figure 1). Elbow pain occurred least frequently.
The bus drivers also attributed their discomfort to the vibration of the vehicle. Vibration comes most commonly from the steering wheel (43%), followed by the seat (31%), the gear-shift (15%) and the pedal (11%), (Figure 2). Thus, in designing the seat, the need to reduce vibration must also be considered.
43% 31% 15%
11%
Percentage of Vibration by Source
Stering
Seat
Gear
Pedal
Figure 2.Source of vibration
Saporta [2] suggested that to minimize musculoskeletal stresses, the seat should be designed such that:
(1) It permits shifting or changing of posture (2) It has a large adjustable back support;
(3)The seat surface should be accommodating, but not spongy, to accommodate the forces transmitted to it: and
(4) Seat height and angle should be easily adjusted.
All of these features can contribute to good seating posture.
1.3. Anthropometry data and design
Measurement of people’s physical characteristics and abilities (anthropometry) provides information that is essential to guide appropriate design of occupational and non-occupational environments, as well as for the design of consumer products, clothing, tools and equipment [11] and to resolve the dilemma of ‘fitting people to machines’ [12]. Anthropometry allows evaluation of the suitability of vehicle design for drivers [13]; designs that conform to users’ sizes in one country may not be appropriate in other countries in which the users may be smaller or larger, so users may choose to modify the designs unilaterally [14].
2. Methods
2.1. Sampling and observation
Development and Evaluation of Bus Seat Dimension to
Improve the Fit and Comfort of Malaysian Bus Drivers 5
2.2. Anthropometry data of bus drivers
A cross-sectional study was conducted to measure the anthropometric dimensions of Malaysian Commercial Vehicle Bus Drivers (Table 1). A total of 176 bus drivers from seven bus depots in the Klang Valley serving the capital city participated in the study. Twelve anthropometric parameters were measured using Martin’s type anthropometer; however, only ten were relevant to the seat design:
• buttock-popliteal depth; (1)
• sitting eye height; (2)
• weight; (3)
• shoulder height; (4)
• elbow-rest height; (5)
• knee height; (6)
• popliteal height; (7)
• hip breadth; (8)
• buttock-knee depth, (9)
• and lumbar support height.(10)
2.3. Body part symptom survey
Twenty five drivers who used these seats were interviewed to identify any musculoskeletal pain that might be related to the design of the seat used. A body part symptom figure was used based on the sitting posture; drivers were asked to indicate the body parts experiencing problems, i.e., neck and head, shoulder, upper back, arm and hand, lower back, thigh, knee and ankle and leg. The frequency of the response for each part was calculated.
2.4. Modeling and evaluating the seat design
Seat designs were then modeled using CATIA software version V5R14. The CATIA software was used to design and simulate the current and recommended seat using the anthropometric dimensions of the bus drivers. The Rapid Upper Limb Assessment (RULA) tool available in the software was used to give a quick assessment of the potential problems that bus drivers may encounter with each seat design and to justify the need for a better seat design.
2.4.1. RULA analysis
in a risk score between one and seven, where higher scores signify greater levels of apparent risk. RULA analysis examines the following risk factors: number of movements, static muscle work, force, working posture, and time worked without a break. RULA evaluates stress on each body part; the level of severity suggests which features of the chair should be modified to make it more comfortable.
2.4.2. Current seat measurement
Several measurements were taken on the current seat (Figure 3).
3. Results
3.1. Sampling and Observation
The seats in the three buses sampled, none had armrests, headrests or seatbelts. Armrests support the arms and prevent or reduce arm, shoulder, and neck fatigue. The headrest supports the weight of the head to reduce amount of stress on the body. Therefore adding armrests and a headrest should reduce fatigue among bus drivers. However, the lack of a seat belt simply showed a disregard for safety.
3.2. Body part Symptom survey
The respondents for this study were mostly (12) 31-40 years old and had worked as bus drivers for an average of 5-7 years. Of the 25 respondents, 18 indicated that they experience some musculoskeletal problems and 16 of these indicated that these problems first occurred after they had become drivers. In 23 of the workers, the most frequent problems were in the lower back, followed by pain in the neck or head (21), in the ankle or leg (20), in the thigh (17) and in the arm or hand (15). This result is consistent with that of the larger survey. Based on interviews and chair design observation, possible causes of the prevalent problems were identified (Table 1).
3.4. Current Seat measurement
Development and Evaluation of Bus Seat Dimension to
Improve the Fit and Comfort of Malaysian Bus Drivers 7
Figure 3.Seat dimensions measured.
(a. seat pan height, b. seat width, c. seat depth, d. backrest height, e. backrest width and g. lumbar support height, f. angle of inclination.)
Table 1.Summary of complaints and possible causes
Driver Complaints Observation of Seat Used
Lower back Absent or improper lumbar support
Neck/head No headrest
Ankle/Leg Inadequate support;
Inadequate leg room
Thigh Seat height is not
adjustable
Arm/hand No armrest
Table 2. Mean and standard deviation anthropometric.
Dimension Mean SD
Stature 164.63 5.57
Weight 72.31 11.88
Eye height 115.28 4.57
Shoulder height 98.54 4.06
Elbow-rest-height 64.37 3.31
Knee height with shoes 52.79 3.06 Knee height without shoes 50.15 2.48 Popliteal height with shoes 43.06 2.53 Popliteal height w/o shoes 40.88 2.27 Elbow breadth 47.03 5.06
Hip breadth 35.23 4.11
Buttock-to-popliteal depth 43.47 3.04 Buttock-to-knee depth 54.10 3.37 Lumbar support height 42.50 9.16
Table 3. Measurements of current seat
Seat dimension Current measurement (mm) Seat pan
Height 470-530
Width 440
Adjustability Yes
Depth 500
Backrest
Height 500
Width 400
Lumbar support 200
Inclination 10º-15º
Steering wheel
Adjustability Yes
Diameter 500
Height 600
3.5. Redesigning the current seat
3.5.1. Seat pan
Seat height:
Seat height for the current seat ranged from 470 mm to 530 mm. In general, the optimal seat height for many purposes is close to the popliteal height and where this cannot be achieved a seat that is too low is preferable to one that is too high. For many purposes, the 5th percentile female popliteal height represents the best compromise [16]. Based on the Malaysian bus driver’s anthropometrics data [10], for the 5th and 95th percentile popliteal height, the seat height should be 370 mm to 480 mm.
Seat depth:
The current seat depth is 500 mm. If the seat depth is greater than the buttock-popliteal length, the user cannot engage the backrest effectively without unacceptable pressure on the backs of the knees and problems with standing up and sitting down will also increase. The lower limit of seat depth is less easy to define. A depth as little as 300 mm will still support the ischial tuberosities and may well be satisfactory in some circumstances [16]. Therefore, based on the Malaysian anthropometrics data obtained, the seat depth should be 380 mm by referring to the 5th percentile male popliteal-buttock depth.
Seat width:
Development and Evaluation of Bus Seat Dimension to
Improve the Fit and Comfort of Malaysian Bus Drivers 9
maximum breadth of the hips is all that is required. Hence 350 mm will be adequate. However, clearance between armrests must be adequate for the largest user. The hip breadth of the 95th percentile male will be considered [16]. Since the current seat width is 440 mm, it is acceptable because the 95th percentile male Malaysian hip breadth for the bus drivers is 420 mm.
3.5.2. Backrest
The backrest parameters consist of backrest height, width, lumbar support and backrest inclination angles. The current backrest height is 500 mm. A medium-level backrest should be used to support the upper back and shoulder regions [16]. For support to the mid-thoracic level, the overall backrest height should be about 500mm, and for full shoulder support about 650 mm (95th percentile male values rounded up). Whatever its height, preferably and sometimes essentially the backrest should be contoured to the shape of the spine, and in particular to give positive support to the lumbar region in the form of a convexity or pad. Based on the 95th percentile male sitting shoulder height, the height of the backrest should be 660 mm.
The backrest width of current seat is at 400 mm. The seat back width should allow users to be supported without arm interference. The shape should be convex from top to bottom to conform to the normal lordosis, and should be concave from side to side to conform to human anatomy and support the occupant in the seat [7]. Thus the 95th percentile male elbow-to-elbow breadth measurement of 560 mm is recommended to give full support for the back.
The high complaint of lower back pain is most probably due to the lack of lumbar support. Repeated high muscle activity in the lumbar region fatigues the lumbar muscles, so that the subjectively sensed fatigue is reported here [17]. The lumbar support should be placed in the lumbar region to achieve a more normal lordotic curvature when in the seated posture. To provide as much comfort as possible, the support should be adjustable in both height and size, and large enough to accommodate a wide range of users [2].
In the current seat design, the lumbar support is not adjustable. The lumbar support should be large enough to accommodate a wide range of users [2]. The lumbar support range of the 5th and 95th percentile anthropometric data was 180 mm to 280 mm.
3.5.3. Armrests
Since the current seat was not provided with an armrest, it should be considered as an option. Armrests might give additional postural support and be an aid to standing up and sitting down [16]. They also support the arms to prevent or reduce arm, shoulder, and neck fatigue. A gap of perhaps 100 mm between the armrest and the seat back may, therefore, be desirable. An elbow rest that is somewhat lower than sitting elbow height is probably preferable to one that is higher, if a relaxed posture is to be achieved. An elbow rest at 200-250 mm above the seat surface is generally considered suitable.
The height of the armrest was set at the 5th percentile male elbow-rest height at 600 mm from floor level and approximately 210 mm above the seat surface. The adjustability of the armrest is proposed to accommodate the 95th percentile male as well. Therefore the range of the adjustable armrest would be 210 mm-230 mm above the seat surface. The armrests should be designed such that drivers can move them out of the way if they so prefer.
3.5.4. Headrest
A headrest is also proposed in the new design because it can help reduce fatigue in the neck and head muscles. The headrest will help to align the eye-view of drivers. Without a headrest, the neck muscles are used to align the eye-view of drivers and this contributes to fatigue of the driver’s neck after driving for a period of time. The headrest should be adjusted to a minimum of 50 mm up and down from the top of the seat backrest and a minimum of 40º forwards from the vertical to fully support the user’s head [2]. By using the 95th percentile male sitting eye height as guidance, the headrest dimension is proposed with adjustable height and its inclination range based on the literature.
The recommended seat design has numerous differences from the current seat (Table 4).
3.6. Simulation results
Seat designs were drawn using CAD, then exported into CATIA and integrated with a 3-D human model. The 3-D human model (manikin) was edited using the Malaysian bus drivers’ anthropometry data. All missing data were calculated using the ratio scaling method by referring to the Japanese population. Thus, the manikin in the software represents the Malaysian bus drivers’ population. The human is located on the seat using the H-point and Seat Reference point (SRP) relationship [18].
Development and Evaluation of Bus Seat Dimension to
Improve the Fit and Comfort of Malaysian Bus Drivers 11
percentile male (Figure 5)).
In the simulations, the current seat showed that it does not provide adequate backrest support for the 5th percentile male because existing seat pan is 500 mm long, but the 5th percentile popliteal-buttock depth is only 386 mm.
Table 4.Summary of recommended seat design parameters (mm, except where noted)
Seat dimension Current Recommended Seat pan
Height 470-530 370-480 (5th-95th%ile popliteal height) Width 440 440 (95th%ile hip breadth + < 25mm all round)
Adjustability Yes Yes
Depth 500 380 (5th%ile buttock-popliteal length)
Backrest
Height 500 660 (95th%ile sitting shoulder height) Width 400 560 (95th%ile elbow-elbow breadth)
Lumbar support 200 180-280 (5th -95th%ile lumbar support height) Inclination 10º-15º 10º-15º (literature)
Armrest NA 210-230 (5th -95th%ile sitting elbow height above seat surface)
50 mm up/down
Headrest NA
40º forward 95th%ile male sitting eye-height)
Extra leg support
Current seat Recommended
Figure 4.Comparison of current seat and recommended seat design for 5th percentile
Current RecommendedRecomme
Also, an extra leg support is required for the current seat, indicating that the seat is too high for the 5th percentile drivers. When support for the leg is inadequate, the pressure distribution on the thighs increases. Blood circulation is restricted and this contributes to thigh fatigue. Leg support is critical to better distribute and reduce the load on the buttocks and the back of the thighs. The weight of the lower legs should not be supported by the front part of the thighs resting on the seat. Pressure applied to the front part of the thighs, the portion close to the knees, can result in swelling of the legs and pressure on the sciatic nerve [18].
3.7. RULA analysis
The results of the RULA analysis for the 5th and 95th percentile for the final score of posture for current seat is 3 (Tables 5 and 7), whereas for the recommended seat, the score is 2 (Tables 6 and 8).
Table 5.The RULA analysis for posture of current seat (5th percentile)
Arm and wrist analysis Score Neck, trunk and leg analysis Score
Upper arm position 2 Neck position 2
Forearm position 2 Trunk position 3
Wrist position 2 Legs 1
Wrist twist 1 Posture score 3
Posture score 3 Muscle use 0
Muscle use 0 Force/load 0
Force/load 0
Wrist and arm 3 Neck, trunk and leg 3
Final score 3
Table 6.The RULA analysis for posture of proposed seat (5th percentile)
Arm and wrist analysis Score Neck, trunk and leg analysis Score
Upper arm position 1 Neck position 1
Forearm position 2 Trunk position 1
Wrist position 2 Legs 1
Wrist twist 1 Posture score 1
Posture score 2 Muscle use 0
Muscle use 0 Force/load 0
Force/load 0
Wrist and arm 2 Neck, trunk and leg 1
Development and Evaluation of Bus Seat Dimension to
Improve the Fit and Comfort of Malaysian Bus Drivers 13
Table 7.The RULA analysis of current seat (95th percentile)
Arm and wrist analysis Score Neck, trunk and leg analysis Score
Upper arm position 2 Neck position 4
Forearm position 2 Trunk position 3
Wrist position 1 Legs 1
Wrist twist 1 Posture score 3
Posture score 3 Muscle use 0
Muscle use 0 Force/load 0
Force/load 0
Wrist and arm 3 Neck, trunk and leg 3
Final score 3
Table 8.The RULA analysis for posture of proposed seat (95th percentile)
Arm and wrist analysis Score Neck, trunk and leg analysis Score
Upper arm position 1 Neck position 4
Forearm position 2 Trunk position 1
Wrist position 1 Legs 1
Wrist twist 1 Posture score 2
Posture score 2 Muscle use 0
Muscle use 0 Force/load 0
Force/load 0
Wrist and arm 2 Neck, trunk and leg 2
Final score: 2
4. Discussion
The problems identified from the body part symptom survey can be attributed to the design of the chairs used. The low back pain is probably caused by the lack of lumbar support in the chairs which should be placed in the lumbar region to achieve a more normal lordotic curvature when in the seated posture. To provide as much comfort as possible, the support should be adjustable in both height and size [2].
The lack of a headrest may have contributed to the neck and head pains experienced by the respondents. The headrest, full-size backrest, and the seat pan should receive the weight of the head, the trunk, and the thighs [2].
Problems in the ankle, leg and thighs occurred probably due to inadequate support of the legs caused by incorrect seat height. Leg support is critical to better distribute and reduce the load on the buttocks and the back of the thighs. The weight of the lower legs should not be supported by the front part of the thighs resting on the seat. Pressure applied to the front part of the thighs; can result in swelling of the legs and pressure on the sciatic nerve [7].
The seat height adjustment of the current seat was not in working order. This may have caused the drivers not able to accommodate their legs adequately. If the seat is too low, the knee flexion angle becomes large and the weight of the trunk is transferred to the seat pan surface over a small area at the ischial tuberosities [7]. The large knee and hip angles soon become uncomfortable, and the spine is flexed as the pelvis rotates backwards. When the seat is too high, the feet do not reach the floor, so the pressure on the back of the thighs becomes uncomfortable. Individuals tend to slide forward to the front of the seat. This allows the feet to be supported, but the seat back is not used properly to support the back. The seat height should be adjustable so that the feet can rest firmly on the floor with minimal pressure beneath the thighs.
Although only 15 respondents reported pain in their arm and hand, an armrest is important in providing support for the arm and in reducing fatigue to the arm, shoulder and neck. A seat should allow for relaxation of the muscles not required for the task as well as for intermittent relaxation of those that are [19].
More than half of the drivers complained that the leg room is inadequate. Adequate leg room is essential for the operator to adopt a satisfactory posture. The leg room was found to be constrained by the steering wheel. Drivers were observed to have difficulty sitting in the seat smoothly because of inadequate leg room between the seat and steering wheel. The lateral leg room must give clearance for the thighs and knees [17]. For vertical leg room, in some circumstances will be determined by the knee height of a tall user (95th percentile). A more relevant measurement would be to consider the thigh clearance above the highest seat height position using the 95th percentile male popliteal height and thigh thickness. The knee clearance is determined by buttock-knee length (95th percentile male) from the back of a fixed seat. Forward leg room is rather more difficult to calculate.
According to the literature, a RULA score of 3 or more indicates that further investigation is needed and that change may be required. With the recommended seat, the final score was reduced to 2 (Tables 6 and 8). This indicates that the posture is acceptable if it is not maintained or repeated for long periods of time.
Therefore, from the simulation results, the recommended seat design is acceptable because it can help reduce drivers’ fatigue while driving, especially in improving the posture of the arm and wrist and for the trunk and legs. A more comfortable seat will increase the performance of the bus drivers. However, though the overall score for the posture has improved, the score was 4 for the neck position of the 95th percentile in both the current and recommended seat design, and this is cause for concern. Further investigation must be conducted out to identify further the cause of this problem.
5. Conclusions and recommendations
Development and Evaluation of Bus Seat Dimension to
Improve the Fit and Comfort of Malaysian Bus Drivers 15
parameters (Table 4) will accommodate 90 percent of Malaysian bus driver’s population and it can probably be used as a guide in designing the driver’s seat for other Asian bus drivers. The importance of designing using the anthropometric dimensions of the users has been shown in several studies [11, 12, 13, 14].
However the study has been limited to bus drivers in one region. A bigger sample which includes other regions may provide more accurate anthropometry data. Also different buses may have different seat designs that should be evaluated.
Though the use of RULA maybe subjective, it has been used in many studies to direct attention to design shortcomings. Due to its rapid assessment, potential problems can be identified earlier and actions taken much faster.
Also, the simulation was carried out only between the seat and the bus drivers. Bus driving is more complicated because it entails the various interactions with the dashboard, steering wheel and other aspects of driving in which the posture of the bus drivers maybe affected and compromised. The effect of these interactions on posture must also be studied.
References
Alfons Grösbrink and Andreas Mahr., 1998. Ergonomics of bus drivers, transport industry and warehousing. In Encyclopaedia of Occupational Health and Safety (4th edn). Geneva:International Labour Office, Vol. 3, Pt XVII.
Saporta H., 2000. Durable ergonomic seating for urban bus operators, Tri-Country Metropolitan Transportation District of Oregon.
National Institute for Occupational Safety and Health (NIOSH)., 1997. Musculoskeletal disorders and workplace factors. U.S. Department of Health and Human Services.
Brovenzi M and Zadinim A., 1992. Self-reported low back symptoms in urban bus drivers exposed to whole body vibration. Spine, 17 (12), 1048-1059.
Anderson R., 1992. The back pain of bus drivers - prevalence in an urban area of California. Spine 17:1481.
Gilmore BJ, Bucciaglia J, Lowe B, You H and Freivalds A., 1997. Bus operator workstation evaluation and design guidelines. TCRP Report F-4, Transportatation Cooperative Research Program (TCRP), Transportation Research Board.
Chaffin DB and Anderson G., 1991. Occupational biomechanics, John Wiley and Sons.
Waller PF and Green PA., 1997. Handbook of human factors and ergonomics, Chp. 59 - Human Factors in Transportation. John Wiley and Sons, Inc.
Levy BS and Wegman DH., 1995. Occupation health- recognizing and preventing work-related disease. Third edition. Little, Brown and Company.
Wan CZWH, Hamiraj AF, Shamsul BMT, Rosnah MY, Nasaruddin AA, Juliana J, Rosnan H and Yunus A., 2005. Anthropometrics measurements of Malaysian commercial vehicle bus drivers for Malaysian bus seat design, UPM Serdang, Malaysia.
powered wheelchair users. Int. J. of Industrial Ergonomics, 33, pp.191-204. Wang, E.M.Y., Wang, M.J., Yeh,W.Y., Shih, Y.C and Lin, Y.C., 1999. Development of
anthropometric work environment for Taiwanese workers. Int. J. of Industrial Ergonomics, 23. pp3-8.
Yisa,M.G., 2002. Ergonomics of tractors assembled in Nigeria. Biosystems Engineering. 81(2), 169-177.
Courtney AJ and Evans WA., 1987. A Preliminary investigation of bus cab design for Cantonese drivers. Journal of Human Ergology, Vol.16 pp 163-171.
Lueder RA., 1996. Proposed RULA for computer users. Proceedings of the Ergonomics Summer Workshop, UC Berkeley Center for Occupational and Environmental Health Continuing Education Program, San Francisco.
Pheasant S., 2001. Bodyspace: anthropometry, ergonomics and the design of work. Taylor & Francis Ltd., London.
Hubbard RP., 1993. New biomechanical models for automobile seat design. SAE 930110.
Diffrient N, Tilley AR and Harman D., 1981. Human Scale 7/8/9, Cambridge, Ma, The MIT Press.
Branton P., 1969. Behavior, body dimensions and discomfort, Ergonomics 12, pp 316-317.
Rosnah Mohd. Yusuff
Dr. Rosnah Mohd. Yusuff is an Associate Professor in the Department of Mechanical and Manufacturing Engineering, Faculty of Engineering, Universiti Putra Malaysia. She obtained her first degree from the University of Iowa, USA and her Masters degree from the same University in Industrial Engineering and Management and her PhD from Universiti Putra Malaysia in Manufacturing Systems. Her research areas of interest are ergonomics in systems and product design, msds, and in industrial engineering and management. She is currently an executive council member of Pan Pacific Council on Ergonomics, a council member of the Malaysian society of Engineering and Technology editorial committee of Asian Journal of Ergonomics and Asian journal of Science and Technology in Production and
Development and Evaluation of Bus Seat Dimension to
Improve the Fit and Comfort of Malaysian Bus Drivers 17
Mohd Shahir Yahya
Mr. Mohd Shahir Yahya is currently a lecturer at Universiti Tun Hussein Onn Malaysia. He received his bachelor’s degree in Mechanical (Industrial) Engineering from Universiti Teknologi Malaysia and Masters degree in Manufacturing System Engineering from Universiti Putra Malaysia. He is also a graduate member of Board of Engineer Malaysia. He has conducted and supervised research projects covering several areas of ergonomics. His current research interest is on application of ergonomics in product design.
Shamsul Bahri Mohd Tamrin
Shamsul Bahri Mohd Tamrin is a senior lecturer working in the Faculty of Medicine and Health Sciences, Universiti Putra Malaysia with 11 years experienced in the field of industrial hygiene and ergonomics. His research areas of interest are in industrial hygiene and ergonomics. He received his Bachelor in Doctor Veterinary Medicine from Universiti Putra Malaysia and MS degree in Public Health from Universiti Kebangsaan Malaysia. He obtained his PhD in Occupational & Environmental Health from Mie University, Japan.
Wan Chik Zaharah Wan Hassan
Asian Journal of Ergonomics Vol.9 (2009) 19-32
Data entry task in mobile computing: effects of
vibration, display colour, and user age
ZULQUERNAIN MALLICK*
Department of Mechanical Engineering, Jamia Millia Islamia, New-Delhi-110025 (India)
Abstract
Mobile computing devices are expected be become more ubiquitous in the near future. This study attempts to quantify the influence of text and background (text/background) colours in lap-top displays on the accuracy of data entry operators in an automobile. The accuracy of input by operators was quantified under varying levels of vehicular vibrations and combinations text and background color. Data entry accuracy was significantly affected by vehicular vibration and text/background color of the lap-top display. The finding suggest that designs of off-desktop computers should consider vibration-induced stresses that occur when users enter data while riding in a vehicle, and that proper text/ background colour combinations should be chosen.
Keywords: Vehicular vibration, Data entry, Text/background, driving environment, age
1. Introduction
The use of Visual Display Units (VDUs) is increasing rapidly, and recently emerging technologies based on Wireless Application Protocol (WAP) like lap-tops and palmtops are expected to be commonly used in future Human Computer Interaction (HCI). Such systems will be widely used in mobile settings, so the capacity of such systems to meet user needs must be evaluated ergonomically in mobile HCI environments.
Designing user interfaces for off-desktop computing, like mobile computing on lap-top and similar devices faces many challenges. Effective interfaces for text input and data entry are surprisingly difficult to design. Text writing constitutes one of the most frequent computer user tasks. The need for an effective interface for entering text off the desktop has driven numerous inventions in text entry, although
*
most have not been properly evaluated using either theoretically or empirically. Several factors may affect user performance when using VDUs for data entry or to search for items on the screen. These factors include vibration, the color of the text and the background, and user age. Therefore, these factors must be considered when designing devices for use in mobile settings.
The colours of the text and of the background (text/background) on a display affect user performance, especially in desktop and lap-top type computing systems. The text/background colours on a display affect user performance, especially in desktop and lap-top type computing systems. Users prefer a high contrast between text and background colour (Ling and Shaik 2002). Appropriately-chosen colours can also help convey information quickly. The readability of text increases with luminance contrast between the text and background colors (Shieh and Lin 2002) and users can find targets more quickly as color difference between the text and background increases (Wang et al. 2002). Normally, mobile computing is done during the day time; sunlight may cause glare, so a dark background and white text may be the best option.
Older people enter data more slowly than middle-aged and younger people (Khan 2002). People of different ages use computing systems in mobile environments, so possible age-related effects on task completion should be assessed, but little work has been done to do so. In tasks that require divided attention, performance of the task involved was significantly affected by age (Salthouse, 1982; Kaulser 1982). Younger subjects perform better than older subjects (Burke et al. 1980), and the time required to allocate attention increases with age (Madden 1992). The objective of this study was to quantify the combined effects of vibration, colour of text and background, and user age on users’ accuracy while entering data in a mobile environment.
2. Methods
2.1. Subjects
Forty-two male subjects’ different ages participated in this study; all had normal vision either with or without the aid of glasses, and none had any history of neuromuscular disorders. The subjects chosen had almost the same amount of experience with working on lap-computers in a stationary (zero-vibration) environment. The subjects selected were divided into three groups: 18-32, 33-47 and 48-62 years old. Each group included 14 subjects. Users’ input speed was measured as the number of characters entered per minute without spaces (NCEPMWS); to avoid any temporal effect that might affect subjects’ performance, data were recorded at approximately the same time of day throughout the experiment.
2.2. Stimuli and experimental task
Data entry task in mobile computing:
effects of vibration, display colour, and user age 21
The sensor of the vibration level meter was kept at a specially designed platform which did not affect the impact of vibration and the display was kept in front of the experimenter to allow him to constantly monitor the level of vibration.
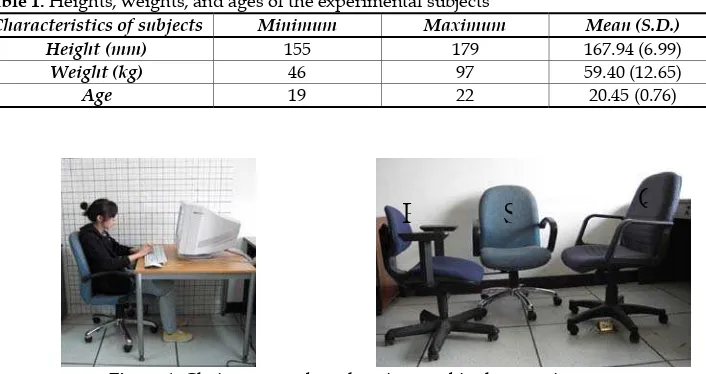
The mean value of the angle between eye level and the centre of the screen of the lap-top for all the subjects was kept at approximately 15° (SD = 3.16°). The temperature of the vehicle was maintained at approximately 26 ± 3 °C. While performing the experimental task the level of vibration in the driving environment was kept at a specified value by constantly monitoring the level of vibration in the x, y and z directions and running the vehicle at the appropriate speed.
Before the actual experiment in the test vehicle, a trial session was arranged; this was done for two purposes. The first purpose was to familiarize the subjects with the experimental procedure; the second was to determine the reaction of the subject in connection with the recorded text input in the audio-cassette that was replayed during the experimental session. Subjects did not adapt easily to this style of stimulus presentation style; therefore one experimenter sat beside of the subject and read the text to be entered. Out of 42 subjects 32 preferred this style of stimulus presentation but requested slow speed reading so that the text entry task could be completed without difficulty. Subjects were required to sit on the vehicle seat (without back rest) with the two hands on the keyboard (as was observed to be the practice of the end-users) while working on VDUs .Before performing the experimental task (data entry), the subject sat in the vehicle at a prespecified level of vibration for 60 minute and then the stimulus was presented to him. Each text entry task required 10 minutes. After completion of the task at each level of vibration separately, the content entered was saved with the name of the subject and later downloaded later to check it for errors. Subjects were allowed to rest for 30 min between successive trials; during this period they were isolated from the driving environment. Two text/background color employed in this experiment: black characters on white background and white characters on black background. The experimental task was repeated for both text/background colour combinations.
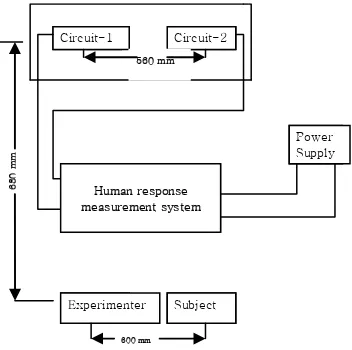
2.3. Experimental Set-up
Experimental investigations were carried out in a real life driving environment on a passenger car (Waja) manufactured in Malaysia. This particular type of car was chosen because ~ 65% of Malaysian people use this car. This car has a 1597-cc S4PH 4- cylinder 16-valve DOHC engine that has a maximum power of 82 kW at 6000 rpm, a maximum torque of 148 Nm at 4000 rpm, and a multi-point fuel injection system. The bore of this engine is 76.0 mm and its stroke is 88.0 mm. The front suspension uses a MacPherson strut with a stabilizer bar; the rear suspension uses Multilink with stabilizer bar. The car is 4465 mm long, 1740 mm wide, 1420 mm high and has a wheelbase of 2600 mm. Its maximum speed is 190 km/h.
2.4. Error and error handling
Another important dimension to consider in such experiments is the error rate. What matters is the effective speed, or speed after correction. Different methods of handling errors can be used; each has different implications to the text input study result. Some leave errors in the text and report them separately (MacKenzie and Zhang, 1999). Others do not allow errors, e.g. the testing program will not proceed until the correct character is entered (Zhai et al., 2002). Yet others require the participants to correct their errors, and measure their effective speed including error correction. The amount of time needed to correct errors depends on the design of the error correction mechanism; hence no set rules exist to compare tradeoffs between error and speed. Typing accuracy is defined as the percentage of characters correctly typed. In this experiment, error was counted on the basis of characters typed correctly. For example:
z Given Text: Please come to meet me at the play ground where match will be played.
z Entered Text: Please come to meet me at the flat ground where match well be played.
The given sentence has 55 characters without spaces and the entered text has two errors, one in the word ‘Please’ and the second in the word ‘Play’. Therefore the error rate is (2/55) x 100 = 3.63% and typing accuracy is (100 - 3.63) = 96.37%.
Data entry task performance is often measured in words per minute (WPM). In the present research performance of operators were measured in NCEPMWS. This style was adopted to nullify the subjects’ habit of leaving single or double spacing between words while performing data entry task.
POWER SUPPLY
LAPTOP SCREEN
KEY BOARD
VIBRATION LEVEL METER
EXPERIMENTER SUBJECT
SEAT
340 mm 340 mm
5
3
0
9
7
5
m
m
Figure 1. Schematic diagram of experimental set-up employed in all the experimental investigations undertaken in the present work without vibration (zero level) and vibration
Data entry task in mobile computing:
effects of vibration, display colour, and user age 23
2.5. Measurement of vibration
For vibration measurement the evaluation procedure ISO 2631-1: 1997 was adopted. A tri-axial accelerometer (Deltatron Type 4505, Bruel & Kjaer) was mounted on the test vehicle seat to register the vibration level. This accelerometer has a detection range of 5 m/s2 to 7500 m/s2 and a frequency range of 1 Hz to
1000 Hz. This instrument can make simultaneous measurements in X, Y and Z directions. The vibration level meter was calibrated in the X, Y and Z directions before measurement. To check the suitability of the basic evaluation method, the crest factor was calculated for X, Y and Z directions. According to ISO 2631-1 (1997), the crest factor is defined as the modulus of the ratio of the maximum instantaneous peak value of the frequency-weighted acceleration signal to its root-mean-square (rms) value. The crest factor values for the X, Y and Z directions obtained were within the limit prescribed by ISO 2631-1 (1997). For vibration with crest factors ≤ 9, the basic evaluation method is normally sufficient. The accelerometer was connected to a Whole Body Vibration front end (Bruel & Kjaer Type 2693) and this was connected to modular sound level meter (Bruel & Kjaer Type 2260) which was used for both data collection and display; data were later downloaded to a PC for further analysis. Total equivalent vibration was calculated using ISO 2631-1 (1997) recommendations. The vibration levels were measured with respect to the standard biodynamic coordinate system (Figure 2). Equivalent vibration level means the average power of the vibration measured in a specific period of time and was derived from the equivalent noise level of the sound level meter.
Total equivalent vibration = [(1.4awx)2 + (1.4awy)2 + ( awz)2]1/2 (1)
Where:
awx , awy and awz are the weighted rms acceleration values in the X, Y and Z directions
respectively, and the factor 1.4 is the ratio of the longitudinal to the transverse acceleration limits for the frequency range in which humans are sensitive.
The total vibration varied from 0.30 m/s2 to 1.75 m/s2 (Table 1). The vibration
levels for the present study were set at 0, 0.85 or 1.65 m/s2. Zero vibration occurred
only when the vehicle was not moving. Measurements at this level were necessary to determine the base line NCEPMWS value of the subjects.
3. Results
Three experiments were conducted to study the effect of experience level on data entry task performance.
3.1. Experiment 1
In this experiment, the subjects of 48-62 years of age were tested for the data entry task performance under varying levels of vibration and text/background color combination (Figure 3).
Analysis of variance (ANOVA) (Table 2) implied that the effects of vibration and color combination of the text and background, and the interaction of these two factors, were statistically significant.
The significant interaction between the vehicular vibration level and the text/background color combination necessitated an analysis of the simple main effects; the result (Table 3) indicated that level of vibration interacted significantly with text/background color combination only at 0.85 m/s2 and 1.65 m/s2 for (48-62
year-old) subjects in the real driving environment. However , the same was not true in case of vibration level under the varying levels of text/background color combination, i.e., black characters on white background and white characters on black background. The mathematical relationship between NCEMWS for varying levels of vibration under the influence of particular text/background color combination was explored for subjects of age group 45-55 Years and the following models were obtained:
(CE)B1 = 50.86 - 5.01V (2)
(CE)B2 = 68.72 - 8.24V (3)
Where (CE)B1 and (CE)B2 represent characters entered per minute without spaces for
text/background color combinations B1(black characters on white background and B2 (white characters on black background, and V is the value of vibration considered in this study (0, 0 .85 m/s2 and 1.65 m/s2).
Table 2. Analysis of variance of vibration effects when operators (48-62 Years) performed the data entry task under varying levels of vibration and text/background color combination.
Source of Variation SS df MS F
Between Subjects (S) 9
Within Subjects 50
A (Vibration) 1015.19 2 507.59 8.32
A x S ( Error I) 1097.64 18 60.98
B (Text/ background color) 686.72 1 686.72 10.94
B x S ( Error II) 564.75 9 62.75
Data entry task in mobile computing:
effects of vibration, display colour, and user age 25
P er for m a nc e ( i n N C EPMW S ) 0 10 20 30 40 50 60 70 80 Vibration level
0 0.85 1.65
B1 B2
Figure 3. Comparison of operators performance ( in NCEPMWS ) for varying levels of vibration and text/background color combination for subjects of age group 48-62 Years (B1:
black character on white background, B2: white character on black background )
0 20 40 60 80 100 120 Vibration level Pe rf o rm a n c e ( i n N C EPM W S )
0 0.85 1.65
B1 B2
Figure 4.Comparison of operators’ performance ( in NCEPMWS ) for varying levels of vibration and text/background color combination for subjects of age group of 33-47
Years. (B1: black character on white background, B2: white Character on black background)
Table 3. Analysis of Simple Main Effects when Subjects (48-62 Years) Performed the Data Entry task at varying levels of text/background color combination under varying levels of equivalent vehicular vibration
Source of variation SS Df MS F
B (Text/background color combination)
At A1 (vibration level 1) 26.70 1 26.70 0.97
At A2 (vibration level 2) 138.20 1 138.20 5.02*
At A3 (vibration level 3) 168.48 1 168.48 6.12*
B x S (Error) 495.54 18 27.53
A (Vibration Level)
At B1 (White character on black background) 35.42 2 17.71 0.87
3.2. Experiment 2
combination (Figure 4). ANOVA (Table 4) implied that the effects of vibration and color combination of the text and background, and the interaction of these two factors, were statistically significant.
The significant interaction between the vehicular vibration level and the text/background color combination necessitated an analysis of the simple main effects; results (Table 5) indicated that level of vibration interacted significantly with text/background color combination only at 1.65 m/s2 for subjects (aged 33-47
years) in the real driving environment However , the same was not true in case of vibration level under the varying levels of text/background color combination, i.e. black character on white background and vice versa. The mathematical relationship between NCEPMWS for varying levels of equivalent vibration under the influence of particular text/background color combination was explored for age group of 33-47 years; the following models were obtained:
(CE)B1 = 89.72-25.24V (4)
(CE)B2 = 98.86-30.81V (5)
[image:30.516.71.448.339.623.2]Where variables are defined as for Eqs. (2) and (3).
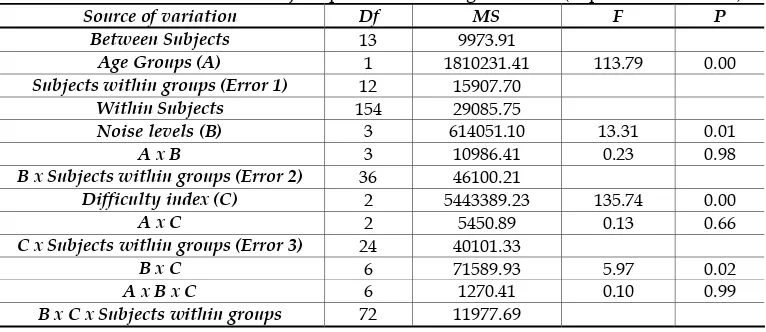
Table 4. Summary of ANOVA pertaining to the studies of vibration effects when operators (33-47 years old) performed the data entry task under varying levels of vibration and text/background color combination
Source of Variation SS df MS F
Between Subjects (S) 9
Within Subjects 50
A (Vibration) 1165.74 2 582.87 9.32*
A x S ( Error I) 1125.72 18 62.54
B (Text/ background color) 471.93 1 471.93 8.12*
B x S ( Error II) 523.08 9 58.12
A x B 777.16 2 388.58 7.18*
A x B x Ss (Error III ) 974.16 18 54.12
0 20 40 60 80 100 120 Vibration level P e rf o rm a n c e ( i n N C EP M W S )
0 0.85 1.65
B1 B2
Figure 4. Comparison of operator’s performance (in NCEPMWS) for varying levels of vibration and text/background color combination for subjects of age group of 33-47 Years.
Data entry task in mobile computing:
[image:31.516.72.453.118.238.2]effects of vibration, display colour, and user age 27
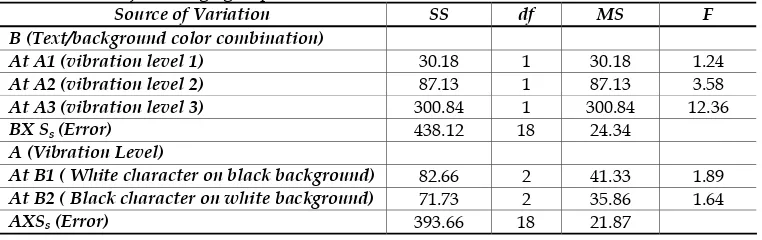
Table 5. Analysis of Simple Main Effects when Subjects Performed the Data Entry task at varying levels of text/background color combination under varying levels of vehicular vibration for subjects of age group of 33-47 Years.
Source of Variation SS df MS F
B (Text/background color combination)
At A1 (vibration level 1) 30.18 1 30.18 1.24
At A2 (vibration level 2) 87.13 1 87.13 3.58
At A3 (vibration level 3) 300.84 1 300.84 12.36
BX Ss (Error) 438.12 18 24.34
A (Vibration Level)
At B1 ( White character on black background) 82.66 2 41.33 1.89
At B2 ( Black character on white background) 71.73 2 35.86 1.64
AXSs (Error) 393.66 18 21.87
3.3. Experiment 3
In this experiment, the young subjects (18-32 years old) were tested for the data entry task performance under varying levels of vibration and text/background color combination (Figure 5).
ANOVA (Table 6) implied that the effect of vibration was statically significant, the effect of text/background color not statistically significant, and the interaction between the vibration and text/background was statistically significant.
The significant interaction between the vehicular vibration level and the text/background color combination necessitated an analysis of the simple main effects; results (Table 7) indicated that level of vibration interacted significant with text/background color combination only when vibration was 0.85 m/s2and 1.65
m/s2. However , the same was not true in case of vibration level under the varying
levels of text/background color combination, i.e. black character on white background and vice versa. The mathematical relationship between the number of characters entered per minute without spaces for varying levels of vibration under the influence of particular text/background color combination was explored for subjects of age group 18-32 Years and model obtained is as follows
(CE)B1 = 103.82-30.24V (6)
(CE)B2 = 98.27-14.54V (7)
0 20 40 60 80 100 120
Vibration level
P
e
rf
or
m
a
nc
e
(
i
n
N
C
E
P
MW
S
)
0 0.85 1.65
B1 B2
Figure 5. Comparison of operators performance (in NCEPMWS ) for varying levels of vibration and text/background color combination for subjects of age group 18-32Years. (B1:
lack character on white background and white character on black background )
Table 6. Summary of the analysis of variance (ANOVA) pertaining to the studies of vibration effects when operators (18-32 Years) performed the data entry task under varying levels of text/background color combination
Source of variation SS df MS F
Between Ss 9
Within Ss 50
A ( Vibration) 2006.78 2 1003.39 15.27*
A X Ss ( Error I) 1182.78 18 65.71
B ( Text/ background color) 64.45 1 64.45 1.24
BX Ss ( Error II) 467.82 9 51.98
AXB 1115.12 2 557.56 10.98*
AXBXSs (Error III ) 914.04 18 50.78
Table 7. Analysis of Simple Main Effects when Subjects Performed the Data Entry task at varying levels of text/background color combination under varying levels of vehicular vibration for subjects of age group 18-32 Years.
Source of Variation SS df MS F
B (Text/background color combination)
At A1 (vibration level 1) 91.76 1 91.76 2.64
At A2 (vibration level 2) 683.03 1 683.03 19.65
At A3 (vibration level 3) 408.77 1 408.77 11.76
BX Ss (Error) 625.68 18 34.76
A ( Vibration Level
At B1 (White character on black background) 167.12 2 83.56 3.23
At B2 (Black character on white background) 63.12 2 31.56 1.22
Data entry task in mobile computing:
effects of vibration, display colour, and user age 29
4. Discussion
People of different ages perform different kinds of computer related tasks in mobile settings; the results of this study reveal that people of different ages are not equally efficient in performing data entry in a mobile setting. The level of vibration significantly affects operators’ data-entry performance. Several studies have reported the affect of vibration on readability task but vibration’s effect on data entry task performance appears not to have been explored. Reduction in reading performance is dependent on the vibration frequency with a maximum reduction of visual acuity at a frequency of 12.5 Hz (Ishitake 1998). Subjects aged from 19-26 years had difficulty in recognizing characters and graphic patterns containing horizontal lines, and developed eyestrain in the presence of 5-Hz sinusoidal single and dual axis (vertical and lateral) whole-body vibration (Griefahn et al. 2000).
Another major finding of the present work is that the text/background color combination has a significant effect on operators’ data-entry performance. Similar results were reported by Wang et al , (2002 ) who reported that subjects’ searching performance while reading a display improved when the color difference between text and background increased, and by Shieh and Lin (2000), who indicated that visual identification performance and subjective preferences increased as the luminance contrast of the between text and background colors.
The polarity of the contrast is also important. Polarity is positive when dark letters are displayed on light backgrounds and negative in the reverse case. Displays with a positive polarity are easier to read than those with negative polarity because positive-polarity displays typically have higher luminance than negative-polarity displays (Buchner et al. 2009). Readibility of text presented on computer screens (e.g. on websites) is better when the overall display luminance level is high, as in positive polarity displays (dark letters on light background). The interaction between jump length and color combination of a reading display also has a significant effect on subjects’ reading performance (Wang and Chen 2003).
Another major finding of the present work is that the interaction of vibration with color combination is statistically significant. In the mobile environment the level of light is reasonably high because sunlight enters without any hindrance. Light falling on the screen may be source of glare and because the screen of the lap-top cannot maintain a definite viewing angle due to vehicle vibration, the combined effect of the vibration and text/background color combination may affect the performance of the operator. Subjects performed data entry tasks more successfully when white text was displayed on a black background (B2) than in the reverse case; this may be a result of the glare effect.
References
Bartzokis, G, Beckson, M., Lu, P. H., Nuechterlein, K. H., Edwards, N. And Mintz, J., 2001. Age-related changes in frontal and temporal lobe volumes in men: a magnetic resonance imaging study. Arch Gen Psychiatry 58 (5): 461-465.
Burke, M.W, Gilson, R.D. & Jagacinsik, R.J., 1980. Multimodal information processing for visual work load relief, Ergonomics 1980; 23 (10): 961-975.
Buxton, W., Billinghurst, M., Guiard, Y., Sellen, A., Zhai, S., 1994/2002. Human Input to Computer Systems: Theories, Techniques and Technology ( book manuscript ), available at http://www.billbuxton.com/inputManuscript.html. Buchner, A., Mary, S., Brandt., 2009. The advantage of positive text-background
polarity is due to high display luminance, Ergonomics 2009;52(7): 882-886. Czaja, S. J., and Sharita, J., 2000. Ability performance relationship as a function of
age and task experience for data entry task. Miami Center on Human Factors and Aging Research.
Ellis, K., 2003. Moving into m-learing. Traning 40(10) : 12-15.
Granjean E., 1980. Ergonomics of VDUs: Review of the present knowledge. In E. Grandjean and E. Vigliani (Ed), Ergonomics Aspects of VDTs, Taylor and Francis: London, 1-12.
Griffin, M.J., and Lewis, C.H., 1978. A view of the effects of vibration on acuity and continuous manual control part-1: visual acuity, Journal of Sound and Vibration, 56,383-413.
Griefahn B, Brode P, Jaschinski W., 2000. Contrast thresholds and fixation disparity during 5 Hz sinusoidal single-and dual axis (vertical and lateral) whole-body vibration. Ergonomics 43(3):317-332.
Huddlesaton, J.H.F., 1970. Tracking performance on a Visual display apparently vibrating at one to ten Hertz. Journal of Applied Psychology 54:401-408.
ISO 2631-5, 2004(E), Mechanical vibration and shock- Evaluation of human exposure to whole-body vibration. Geneva: International Standard Organization.
ISO 2631-1, 1997, Guide for the evaluation of exposure to whole body vibration, General requirements. Geneva: international Standard Organization.
Ishitake, T., Ando, H., Miyazaki, Y., Matoba, F., 1998. Changes of visual performance induced by exposure to whole-body vibration Kurume Med. J, 45(1), 59-62.
Jameson, A., 2002. Usability issues and methods for mobile multimodel systems. In Proceeding of the ISCA tutorial and research workshop on multi-modal dialogue in mobile environments (summary of a keynote address). Kloster Irsee, Germany.
Jernigan, T. L., Archibald, S. L., Fennema-Notestine,C., Gamst, A. C., Stout, J. C., Bonner, J, et al., 2001. Effects of age on tissues and regious of the cerebrum and cerebellum. Neurobiol Aging 22(4) : 581-594.
Jiang, X., Chen, N. Y., Hong, J. I., Wang, K., Takayama, L., & Landay, J. A., 2004a. Siren: Contex-aware computing for firefighting. In proceeding of CHI 2004 ( pp. 679-686). Vienna, Austria: ACM Press.
Kausler, D. H., 1982. Experimental Psychology and human aging. New York : Wiley. Khan, Z. A., 2000. Ergonomic investigation on human performance in HCI
Data entry task in mobile computing:
effects of vibration, display colour, and user age 31
New Delhi (Unpublished Ph.D. thesis).
Lewis, C.H., and Griffin, M.J., 1976. The effects of vibration on manual control performance, Ergonomics 19, 203-216.
Lewis, C.H., and Griffin, M.J., 1980b. Predicting the effects of vibration frequency, and axis and seating conditions on the reading of numeric displays, Ergonomics 25(3), 485-501
Ling, J., Schaik, P.V., 2002. The effect of text and background colour on visual search of web pages. Displays 23, 223-230.
Liu, X., Erikson, C. & Brun, A., 1996. Cortical synaptic changes and gliosis in normal aging, Alzheimer’s disease and forntal lobe degeneration. Dementia 7(3): 128-134.
MacKenzie, I.S., Zhang, S.X., Soukoreff, R.W., 1999. Text entry using soft keyboards. Behaviour and Information Technology 18, 235-244.
Madden, D. J.,1992. Selective and visual Search: Revision of an allocation model and application to age differences. J of Expr Psychology, Human Perception and Performance 18: 821-836.
Milby, T.H., and Spear, R.C., 1974. Relationship between whole body vibration and morbidity patterns among heavy equipment operators. NIOSH Contract No. HSM-099-71-29.
MacKenzie, I.S., Soukoreff, R.W., 2002. Text entry for mobile computing: models and methods, theory and practice. Human- Computer Interaction 17 (1), 147-198. Nawayseh, N. and Griffin, M.J., 2005. Tri-axial forces at the seat and backrest during
whole body fore-and-aft vibration. Journal of Sound and Vibration, 281, 921-942.
Rehn, B., Lundstrom, R., Nilsson, L., Liljelind, I., Jarvholm, B., 2005.
Variation in exposure to whole body vibration for operators of forwarder vehicle- aspects on measurement strategies and prevention. International Journal of Industrial Ergonomics 35, 831-842.
Rempel, D., Honan, M., Serina, E., Tal, R., 1995. Wrist postures while typing a standard and split keyboard. In: Bittner, Champney, (Eds.), Advances in Industrial Ergonomics and safety, Vol. Vll. Taylor & Francis, London.
Salthouse, T.A., 1982. Adult Cognition: an experimental Psychology on human aging. New York :Springer-Verlag.
Sauter, S., Schleifer, L.M., and Knutson, S. J., 1991. Work posture, Work station Design, and Musculoskeletal Discomfort in VDT Data Entry Task Human Factors 33,151-167.
Shieh, K.K., Lin, C.C., 2000. Effects of screen type, ambient illumination, and color combination on VDT visual performance and subjective preference. International Journal of Industrial Ergonomics 26, 527-536.
Wang, A. H, Chen, C.H., Chen, M.T., 2002. Effects of leading display design of dynamic information and visual fatigue. Journal of the Chinese Institute of Industrial Engineering 19, 69-78
Yokomizo, Y. and Komatsubra A., 1985. Measurement and evaluation of vocational ability for older workers. Ergonomics International ID Brown R, Goldsmith K, Coombes, Sinclair MA, London J1/5: 730-732.
Zhai, S., Smith, B.A., Hunter, M., 2002a. Performance optimization of virtual keyboards. Human-Computer Interaction 17 ( 2,3), 89-129.
Zhai, S., Sue, A., Accot, J., 2002b. Movement model, hits distribution and learning in virtual keyboarding. Proceeding of the CHI’2002: ACM Conference on Human Factors in Computing Systems, CHI Letters 4 (1), 17-24.
Zulquernain Mallick
Asian Journal of Ergonomics Vol.9 (2009) 33-48