ICACSIS 201!i
Monsoon Onset and Offset Prediction Model Using
Backpropagation and Moron Method: A Case in
Drought Region
Syeiva Nurul Desylvia
Department of Computer ScienceBogor Agricultural University Bogor. Indonesia ./ syeiva.ndjj grnail.corn
Taufik Djatna
Postgraduate Program of Agroindustrial Technology and Graduate Program of
Computer Science Bogor Agricultural L'niversity
Bogor. Indonesia tau [email protected]
Agus Buono
Department of Computer Science Bogor Agricultural University
Bogor. Indonesia
pudeshaggmail.com
zyxwvutsrqponmlkjihgfedcbaZYXWVUTSRQPONMLKJIHGFEDCBA
Abstract-First day (onset) and last da~' (offset) of monsoon are IIture phenomena which are important elements at cultivation
tsges in agriculture. These 2 sets of time value influent harvest lerformance but it is difficult to predict onset and offset at Irought region. One of technique that can be used to SOIH nentioned problem is prediction technique which is one of data nining task. In this research. Feed Fnrw ard Backpropagation BP:\:\) \\ ere combined \\ ith "oron method to predict onset and ,rrset at drought region. Data used" ere daily rainfall data from
983 to 2013. This experiment used 2kind of SP:\:\' models and bey used 5different values for learning rate (alpha) from range
1.01to 0.2. Root 'lean Square Error (R'ISE) is used to evaluate
esulted prediction models along with correlation value and tandard deviation of error for better understanding. For BP;\':\ ,nsrt model. lowest R'ISE value at alpha 0.15 is 32.05"'6 and ewest R'ISE value for BP:":" offset is 26.6977 at alpha 0.05. )C\'eloped model has been able to use for prediction. but the result ras still not close enough to actual data. In order to achieve a letter model" ith lower R'ISE. it is neccesary to improve model .rchitccture and to specify some methods to obtain certain lumber of input layer based on Southern Oscillation Index (SOl) lata.
Keywords-Rail/fail; Backpropagation: Prediction; Moron
.t!lhod.
zyxwvutsrqponmlkjihgfedcbaZYXWVUTSRQPONMLKJIHGFEDCBA
I. INTRODUCTION
Indonesia is a tropical climate country with only 2 seasons
vhich
are monsoon and summer. In drought region. it is difficult :>predict first day of monsoon (onset) and last day of monsoon offset) in Indonesia. Data mining task can be used to predict mset and ofTset in Indonesia. There are exist some of data nining tasks (e.g. classification, outlier analysis. clustering nalysis. and mining frequent pattern) and the most suitable task or prediction is classification task. Classification technique is a rocess to discover a model or a function which generalize or 'istinguish data classes or concepts. Model is constructed based In analysis of training data (labeled sample data). Resulted rodel can be used to predict unlabeled sample data (testing data)I].
Patterns about onset and ofTset at each year are important in cultivating sector. The farmers need to know when the start and the end of monsoon are. It is because they need to make a plan for their crops such as what kind of crops that suitable are. when they are going to start cultivating the crops. or at which day the crops will be ready.
There are some researches concerning rainfall prediction. Awan and Maqbool [2] constructed a rainfall prediction model in Pakistan using Artificial Neural Network (AN'N) namely Backpropagation and Learning Vector Quantization. The result showed advantage of neural network than it was of statistical model. Modeling for rainfall prediction also had been implemented in India [3]. In this research. a model based on ANN was compared with a model based on regression. As a result. ANN model was better than regression model. Abhishek et al. [4] compared 3 kinds of ANN for rainfall prediction
modeling. Modeled ANNs were Feed Forward
Backpropagation. Layer Recurrent. and Cascaded Feed Forward Backpropagation. As the outcome of their research. Feed Forward Backpropagation algorithm was better based on resulted MSE. Wan et al. [5] modeled Backpropagation (BP) for rainfall prediction at JiangXi Province. China. Preprocessing technique applied the combination of k-rneans clustering method and discriminant analysis. This study used 6 extreme rainfall index (PQ90. PX5D. PINT. PFL90. PNL90. PXCDD) as predictor. Based on resulted BP performance. constructed model had been capable to predict rainfall well.
Another research had been done by Nikarn and Meshrarn [6]. In this research. Bayesian Prediction was used to construct rainfall prediction model and the data was climate data from Indian Meteorological Departement (IMD) Pune. The data attributes were Temp. Station Level Pressure. Mean Sea Level Pressure. Relative Humidity. Vapor Pressure. Wind Speed. and Rainfall. Converting numeric data into categorical data based on given range (discretization) was one of preprocessing technique that was implemented. The best resulted accuracy was 96.15% at Delhi City dataset. Further research is rainfall prediction using Fuzzy Inference System [7]. The data were ~1ET AR 20 years data at Cairo airport station (HEC A) [1972 - 1992] and METAR
ICACSIS
201.')
5 years data at Mersa Matruh station (HEMM). Parameters which were used as input were relative humidity, total cloud cover, wind direction. temperature, and surface pressure. For evaluation model, this research applied rainfall cases data and
6
hours-before data. The outcome based on Brier Score (BS) and Fraction Skill Score (FSS) showed that
the
constructed model had been sufficient for rainfall prediction. This research still needed to be developed, for example. to add input parameter and to combine FIS method with ANN.Models constructed at some of mentioned researches had been capable to predict rainfall well. However. at those researches, on which day monsoon starts and on which day monsoon ends have not been discovered yet. Those researches are only predicting rainfall and measuring model performance based on resulted prediction. Therefore, in this research, models to predict monsoon onset and to predict monsoon offset was developed.
The objective of this research is to construct Backpropagation Neural Network (BPNN) model along with Moron Method [8] as feature extractor to predict monsoon onset and offset. In this case, Waingapu historical data was deployed. Waingapu is one of city at Nusa Tenggara Timur, Indonesia. BPNN was used as classifier to predict on which day monsoon onset and offset in Waingapu are. Root Mean Square Error (R\lSE) was applied to evaluate the model prediction performance. The data was temporal rainfall data at Waingapu and Southern Oscillation Index (SOl) data. which was used as predictor.
In order to achieve the outcome, the first step was feature extraction using Moron Method for getting monsoon onset and offset, the second step was the implementation of correlation method to determine the number of BPNN model input layer, and the last step was BPNN modeling for monsoon onset and offset prediction with SOl data as predictor. BPNN in combination with Moron Method can be used to predict monsoon onset and offset in Waingapu with sufficiently low error rate (RMSE). Also, the combination ofBPNN and Moron method can indicate at which day the first day of monsoon and at which day the last day of monsoon are. The first day and the last day of monsoon are difficult to predict but this developed BPNN model can be utilized to predict them.
This paper is organized as follow: Section 2 describe the method that is used in this research. section 3 describe the result and discussion of this research. and section 4 describe the conclusion.
[I. METHOD
The method consist of 4 main steps. that is. data collection. model construction. and evaluation. Fig. I shows flowchart of
mentioned method.
zyxwvutsrqponmlkjihgfedcbaZYXWVUTSRQPONMLKJIHGFEDCBA
D ata collection. The data in this research are:
/) Daily rainfall data at Waingapu City obtained from BMKG (Badan Meteorologi. Klimatologi dan Geofisika), from 1983 to 2013. There are 71 rain monitoring stations and 5 data attribute namely Tanggal, Tahun. Bulan. TGL. and Hujan. Attribute used only Hujan which is temporal numeric data.
2) Southern Oscillation Index (SOl) data is obtained National Oceanic Atmospheric Administration (NOAA) can be downloaded from http://www.esrl.noaa.gov/.
Preprocessing (er tr acti on,
correlation)
zyxwvutsrqponmlkjihgfedcbaZYXWVUTSRQPONMLKJIHGFEDCBA
r---I I
I I I j I I
I
I I I
I .
I
Model construction
FIg I Example ofa figure caption
zyxwvutsrqponmlkjihgfedcbaZYXWVUTSRQPONMLKJIHGFEDCBA
(figure capuon)Preprocessing. Preprocessing step is used to prepare before be utilized as input for the model. This process ,.",,,,,,""' •• of feature extraction to determine onset (the first day monsoon) and offset (the last day of monsoon) using method and the selection of months as BPNN input model correlation. First process is to specify onset using Moron that consists of several steps. In this technique. onset
np,prnnl",,,,,,.
by accumulating rainfall in 5 days. Onset will be start accumulated rainfall in 5 days is more than 40 mm. Next accumulation is conducted again for consecutive 10 days Sl
onset is determined. Ifduring 30 days since onset is choosen accumulated value at least 5 rnrn, onset determined before selected as onset (not canceled). These same steps are cond again for determining offset but rainfall data is reversed. process is to correlate onset and offset with SOl data August to July). The first day of monsoon in Waingapu September so June is choosen as model input because June is months before monsoon. The last day of monsoon in Wai is March so. with the same method. December is choosen. resulted correlation is conducted to determine how many months are used as input at BPNN model (how many months before the month that has been selected).
ICACSIS
")Ol'i
Model construction.
This research applies Backpropagation
eural Network
(BPN.
zyxwvutsrqponmlkjihgfedcbaZYXWVUTSRQPONMLKJIHGFEDCBA
I)also called multilayer
perceptron.
A
Plultilayer perceptron
with
Ihidden layer (unit
Z)is indicated
by
Fig.
2.At the network. output unit (unit
Y)and hidden unit
ve bias. Bias at output unit Y. is denoted by
wo,and bias at
hidden unit
Z)
is denoted by
VOl'Those biases act as weight at
connection from unit which it's output always
I.BP~~
training
-consists of 3 steps that are feed forward from input rraining data.
error
backpropagation
computation.
and adjusting weight. After
. training
process.
only
feed forward
step is applied
to the
network. More than
Ihidden layer might be
usefullfor some
plications
but
Ihidden
layer
is enough
for
most
of
applications.
BP~~
activation
function
should
have
some
important characteristics
such as continuous
function. derivable.
and
monotonlynot decreased.
For computation
simplicity.
derived activation
function should be convenient
to compute.
t
The most commonly used activation function are binary sigmoid
~and bipolar sigmoid. [9). Random weight initialization
is used in
the beginning
of BP'\~
training.
In this research.
5 different
learning rate (alpha) values is tested to obtain alpha value with
i
minimum resulted error. The data that is used to predict is the
, same data that is used to train (training data).
Evaluation.
Root Mean Square
Error (R\1SE)
is used to
measure model performance.
RMSE is square root of \1SE
[10].The \lSE
of
anestimator
e
with respect
to an unknown
parameter
e
is defined
as:Y,
is vector from n predictor
and
Y,is vector from actual
value. RMSE defined as:
Ill.
RESULT AND DISCl;SSIONPreprocessing.
This step yields onset and offset which are
obtained using Moron method. Onset and offset is indicated at
Fig. 3 and Fig.
-to
Based on those Figures. onset and offset value
is fluctuating
and some values
are far different
from other
values. Those different values might be extreme weather.
Next step is to compute correlation
between onset and offset
with 501 data from August to July. Table I denotes
resulted
correlation.
Correlation
value between
01 data at June with onset is low
so 501 data which is used as input model is July and August
data. Then. correlation
value between
501 data at December
with offset is sufficient so 501 data which is used as input model
is December. October and November.
'lode!
construction.
There are 2 BPl'-'N models which are
developed namely onset prediction
model and offset prediction
model. Those models differ at the number of input layer. Table
2 shows the architecture
of mentioned
models.'
Backpropagauon neural network 19J
'" - - - - '-- ::: - :: :: =- - . ,
-.
'"(I)
FIg 3 Onset at 19M3 to~u13
Offset
Waingapu Graphic(2)
,
..
,-Fig ~ OfTsct at 1983 to 2013
For those models. activation functions are purelin and tansig and
training
function
is trainlm.
There are 5 different
values for
learning rate (alpha) parameter
in this research. They are O.O!.
0.05. 0.1. 0.15.
and
0.2.Fig.
5indicates
prediction
result of
BPNN onset model and Fig. 6 indicates
prediction
result of
BPNN offset model with alpha
0.01.Based on those Figures.
both models are capable to predict onset and offset subject to
actual data. On the other hand. model architecture
still needs to
be advanced
further in order to achieve prediction
result closer
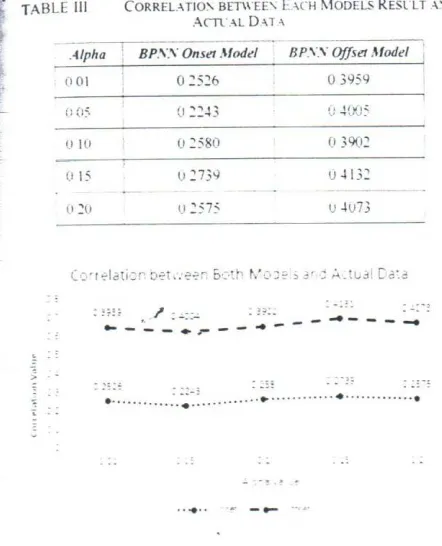
to actual data. To measure interrelationship
between actual data
and prediction
result. Table 3 represents
correlation
between
each model with actual data and Fig. 9 indicates plot of the same
information,
It can be concluded
from correlation
result that the
diverse of alpha values range tested in this research needs to be
improved.
This development
is based on correlation
values
which are similar to each other. Therefore.
in the future work. it
is necessary
to increase
alpha values range to obtain
better
interrelationship
between actual data and prediction result.
ICACSIS 201.'i
zyxwvutsrqponmlkjihgfedcbaZYXWVUTSRQPONMLKJIHGFEDCBA
_I
zyxwvutsrqponmlkjihgfedcbaZYXWVUTSRQPONMLKJIHGFEDCBA
~
,--zyxwvutsrqponmlkjihgfedcbaZYXWVUTSRQPONMLKJIHGFEDCBA
-1 ::>~~
s
·F.
2
zyxwvutsrqponmlkjihgfedcbaZYXWVUTSRQPONMLKJIHGFEDCBA
cE6~~~
Additionally,
in this research,
0.15 is the best alpha value
because it resulted the highest correlation value in both models.
BPNN Alpha: 0.01
::;.:
__ .:.: •.•• !' · · · :~c·...·
Fig 5 Resulted onset prediction" uhalpha 0.0I
,PNN Alpha" 0.01
;:::
_~_--->
;-e-; •.••..Fig 6 Resulted offset prediction With alpha 0 0 I
Resulted RMSE of Onset
32 S 326
.,
~ 324
r:
~ 322 V">
~
::::
3l 6
o
01 (IOS C 1 ~ 1; "v _,
Fig 7 Onset RMSE
Evaluation.
RMSE.
from (2). is used to evaluate
each
model. Fig. 7 and Fig. 8 denote RMSE of BPNN onset model
and offset model. Based on resulted RMSE. the best onset model
is at alpha 0.15 with RrvISE 32.0546 and the best offset model is
at alpha 0.05 with RMSE
26.6977.
Furthermore,
standard
deviation of error is also utilized to estimate model performance.
Error obtained in this study is subtraction
between actual data
with each model prediction
result. Table 4 presents standard
deviation of error for both models and Fig. 10 also shows the
same information.
Coming
from standard
deviation
of error
result. the amount of dispersion for each model is similar and the
data points tend to spread out over a wider range of values. This
similar value for each model is identical to correlation
Table 3 and at Fig. 9, so it can be analyzed
that
deviation of error result is related to alpha values range.
is possible to reduce error value by increasing diversity
value range.
Resulted RMSE of Offset
: 1
:
:~
to pha '.'a ue
Fig 8 Onset RMSE
TABLE I CORRELATIO:" BETWEES O:"SET A:"DOFFSET WITH SOl
~/On1~onSt't Offset
. Aug :.0 ~~ -010
i S~p
i -0 +l
i
Oktl _
iN
I
0\: -0 -11 . 0"2
.- +-- --
r-
---I
-0 ~6I
008I I
i
Dee -053 026
Jan -0.-16 040
Feb -043 043
Mar -040 0.44
Apr -038
o
~OMay -0 ~3
o
-l~·051 O ~5
I
Jul -004 017TI\BI.F. II BPNN \IODU,S ARCllnH,t'RE
Hidden Laver Output Layer
15
15
Moreover, Fig. II and Fig. 12 indicates Taylor Diagram
0onset and offset models as another representation
for bettel
understanding.
For each Figure. alpha value 0.0 1.0.05,0.1,0.15,
and 0.5 are represented
respectively
by blue dot. green doC;
yellow dot. brown dot. and gray dot. At each Figure. the doll
that represent
each model are close to each other and theiJ
correlation values are around 0.2 for onset and 0.4 for offset.
ICACSIS 20F)
zyxwvutsrqponmlkjihgfedcbaZYXWVUTSRQPONMLKJIHGFEDCBA
TABLE III CORRELATIO' BO-WEE' E~CH MODELS RESL"LT .~'D
ACn:AL D.~T~
zyxwvutsrqponmlkjihgfedcbaZYXWVUTSRQPONMLKJIHGFEDCBA
BPSS Offset Model
Alpha BP.\S Onset Modd
(101 02526 03959
010 (J258(1 (J3902
(115 u2739 u-1132
u -1u73
/ : :?: .
. .~-
zyxwvutsrqponmlkjihgfedcbaZYXWVUTSRQPONMLKJIHGFEDCBA
-
zyxwvutsrqponmlkjihgfedcbaZYXWVUTSRQPONMLKJIHGFEDCBA
':':' - :~:"':',..-- -
.•
-
-
-
..
-
- -
..•
zyxwvutsrqponmlkjihgfedcbaZYXWVUTSRQPONMLKJIHGFEDCBA
_ _ J !
•...
:.:.;~~
...•...•...
'.
...•.. -..-
-~
!ABU: IV
i
Alptu: I BP."''Y Onset Model ; BPN.Y Uffset .~-;;;;;;:;;I
001 32 6550 270095I
0os
32 78-19I
27 1149i
010 32 7903 2699ROI
015I
32 360-1 269061 I
1
I
020 32 6-1}.1 267805
Standard Di'vlatlon cf Error
31~5S s:-5-';; 3: ~;':3 !~!:-.:-' 3:~,.
•...•...•...•... ...
'.
...•.. -:-~~
-.-
:'~':'"Fig 10 Standard Dcvranon otI.rror lor Both ~lcldcls
Both models are successful
to follow the actual pattern so
far. but they still needs to develop further to obtain a better result
with higher
correlation.
lower
R\1SE.
and lower standard
deviation of error. Subject to correlation
result. R\1SE value.
and standard deviation
of error analysis.
it is fundamental
to
refine model architecture
and alpha value variations. It is also a
possibility of extreme weather in one or more year in Waingapu
which affected onset and offset prediction result.
Taylor Diagram
I·,~ i I la,lorDiagram of 81'\\ Onset \lode!
Taylor Diagram
0' 02
~ J~---7 · --£2 .. 9"
• - -5? ~
4() "-- ,.0f)
'"
1
.
c>
1
,•
10
>0 ._ -,O~
· \O~!"
\O~
,.-~~~-'
40
rig 12 Tav lor Diagram of BPNN Ortsct Model
IV.
CONCLUSIONThe constructed
models have been able to predict the first
day (onset) and the last day
(offset}of monsoon. Higher diverse
in parameter model and improvement
in model architecture
are
potentially
advance
model performance.
The resulted
R'v1SE
values from each model indicate that the model has been not
adequate
yet to predict
rainfall
onset and offset
based on
historical data in drought region. So. there is a possibility of
good RMSE result if the models is tested based on historical data
in high rainfall rate.
This research still needs developing
further to obtain better
models. In future work. several parameter variation. particularly
alpha value. will be tested along with enhancement
of model
architecture.
Besides. some specific methods to choose SOl data
months
as
input
model
will
be
considered
for
model
improvement.
RI'HRF:\CES
,I,
J lIan. \1 Kamber. and J PCI.D a ta If/lllllg Concept« a lie f7echntques~lorgan Kauffman, 2012
121
J ..\ ..\wan and 0 Maqbool. ....\rrllcatlon (If anrficral neural networks form o n s o o n ra in fa ll prcdicuon." 10
zyxwvutsrqponmlkjihgfedcbaZYXWVUTSRQPONMLKJIHGFEDCBA
(),h Internanonal Conference anrlllt'rJ iu n g Technologies ttct.t, 2010
zyxwvutsrqponmlkjihgfedcbaZYXWVUTSRQPONMLKJIHGFEDCBA
[31 R P Shukla. K.C. Tnpatht. A C. Pandey. and IM L Das.
zyxwvutsrqponmlkjihgfedcbaZYXWVUTSRQPONMLKJIHGFEDCBA
"Prediction of Indian summer monsoon rainfall using rufio indices: A neural networkapproach:'
zyxwvutsrqponmlkjihgfedcbaZYXWVUTSRQPONMLKJIHGFEDCBA
Atmospheric Research. 20II [~I K ..Abhishek. A Kumar. R Ranjan. and S Kumar. "A ramfall predictionmodel using aruficial neural network." In IEEE Contra! and Svstem Graduate Research Colloqium (ICSGRC lOlli. 2012
[51 D Wan. Y \\'an!!- " Gu. and Y Yu. ",.\ novel approach to extreme
rainfall prediction based on data nurung." In
zyxwvutsrqponmlkjihgfedcbaZYXWVUTSRQPONMLKJIHGFEDCBA
ll1 d InternauonolzyxwvutsrqponmlkjihgfedcbaZYXWVUTSRQPONMLKJIHGFEDCBA
Conference onCom puter Science and
zyxwvutsrqponmlkjihgfedcbaZYXWVUTSRQPONMLKJIHGFEDCBA
S t'!H arkTechnologv,zyxwvutsrqponmlkjihgfedcbaZYXWVUTSRQPONMLKJIHGFEDCBA
2012[61 VB \Ikam and B!3 Meshram. "Modeling. rainfall prediction usrng data rrurnng method." 10 F,{th lnternauonal Conference a ll Computauonal
lntelltgence .. vtodethng. and SIIIIII/alion. 2013
;'
[71 SA Asklanv. K Elhelow, I K Youssef. and 111Abd El-wahab, "Rainfall
events prediction using rule-based fuzzx inference system:' AIII/Ospnenc
Research. 201I
[81 V Moron. A\\, Robertson. and R Boer. "Spatial coherence and 5easonaJ predictahrlitv of monsoon onset over Indonesia." Journal of Climate
2009 .
[91 L Fauseu. Fundamentals ofXeurai .\'«11arks: .~rchuectures. A /goritnlllJ. and Appltcanons Prentice Hall. 19q~
!!uJ J Devore. Probabtluv andStaticucstor
zyxwvutsrqponmlkjihgfedcbaZYXWVUTSRQPONMLKJIHGFEDCBA
E n g llJ e c rin g and TheS ( le ff{ '~ !Ccngage Learning, 2010