CONFERENCE COMMITTEE
Coordinator : Yandra Arkeman, Dr. M.Eng
(Departement of Agroindustrial Technology, IPB) Co-Coordinator : Nastiti Siswi Indrasti, Prof. Dr. Ir.
(Head of Departemen of Agroindustrial Technology, IPB)
International Experts:
1. Kenneth De Jong, Prof.
(George Mason University, Fairfax, Virginia, USA) 2. Kim Bryceson, Prof.
(School of Agriculture and Food Science , University of Queensland, Australia) 3. Haruhiro Fujita, Prof.
(Department of Information Systems, Niigata University for International and Information Studies Japan)
4. Gajendran Kandamsany, Dr. (United Kingdom)
5. Noel Lindsay, Prof. (University of Adelaide, Australia)
Committee Members from IPB: 1. Kudang Boro Seminar, Prof.
(Departement of Mechanical & Bio-system Engineering, IPB) 2. Marimin, Prof.
(Departement of Agroindustrial Technology, IPB) 3. Endang Gumbira Said, Prof.
(Departement of Agroindustrial Technology, IPB) 4. Suprihatin, Prof.
(Secretary of Departement of Agroindustrial Technology, IPB) 5. Ono Suparno, Prof.
(Departement of Agroindustrial Technology, IPB) 6. Agus Buono, Dr.
(Head of Department of Computer Science, IPB)
PROCEEDINGS
2
ndInternational Conference on Adaptive and Intelligent Agroindustry (ICAIA)
September 16 – 17, 2013, IPB International Convention Center
Bogor – Indonesia
Organized by :
WELCOMING ADDRESS
Prof. Dr. Ir. Nastiti Siswi Indrasti Head of Agroindustrial Technology Department Faculty of Agricultural Engineering and Technology
Bogor Agricultural University On
Second International Conference on Adaptive and Intelligence Agroindustry (2nd ICAIA) Bogor, September, 16 – 17, 2013
Assalamu’alaikum Warohmatullahi Wabarokatuh In the name of Allah, the beneficent and the merciful,
Distinguish Guest, Ladies and Gentlemen
Let me first thank you all for accepting the invitation to participate in this 2nd International Conference on Adaptive and Intelligence Agroindustry (ICAIA). In particular I would like to thank Rector of IPB (Institut Pertanian Bogor/Bogor Agricultural University) Prof. Herry Suhardiyanto for supporting this event as part of the series academic event in celebrating the 50th Anniversary of Bogor Agricultural University.
In fact, the idea of organizing this conference was the continuation of the International Workshop on Computational Intelligence and Supercomputing Technology for Adaptive Agroindustry held by the Department of Agroindustrial Technology, Bogor Agricultural University last year.
Professor Kenneth A De Jong from George Mason University, US has successfully conducted joint international research with some staff from the Department of Agroindustrial Technology and Department of Computer Science, Bogor Agricultural University. The research aims to develop an integrated and intelligent system (namely SMART-TIN©) for the design of adaptive agroindustrial system in order to achieve a sustainable agroindustry that can mitigate global climate change and at the same time secure food, water, energy and natural medicine supply.
We are certainly proud to have been able to assemble this event in IPB, Bogor. The range of participants and audience at this conference is precisely something I would like to stress. The main goal of the conference is to provide an effective forum for distinguished speakers, academicians, professional and practitioners coming from universities, research institutions, government agencies and industries to share or exchange their ideas, experience and recent progress in Adaptive and Intelligent Agroindustry.
Distinguish Guest, Ladies and Gentlement,
Global climate change is the most challenging problems for us today and in the near future. This global change in our climate can lead to the shortage of the food, water, bioenergy and natural medicine that will affect the quality of human life. Many studies indicate that the threat of food, water, bioenergy and natural medicine crisis due to global climate change still worries our society. This problem can be solved by the development of agroindustry, i.e. an interrelated value chain entities from farming, to agro-processing industry and then to the end-customers. In fact, the design of agroindustry is complex and involves many factors and large data bases and more importantly, needs a good intelligence to process data and information to good decisions. Therefore, the way to design and manage agroindustry should be improved in order to meet the design objectives.
Agroindustries consume quite significant amount of energy on one side, on the other side they generate sizable amount of industrial wastes and its utilization as a captive energy resource is a kind of potential. Based on our study, a plywood industry with the production capacity of 200.000 m3/year could generate 32 percentage of solid waste. If this amount of waste used as an energy alternative, it may result on the saving of 131.037.768.597 rupiah per month. Similar to plywood industry, sugarcane industry with the production capacity of 480 ton per hour could generate 154 ton per hour of waste (bagasse) and this amount of waste contribute to the saving of energy consuming by 19.250 Kwh. Recent study we conducted, indicated that cassava starch industry may contribute to a significant amount of waste. It has also potential usage as an energy resource. Based on our study the conversion of its waste into energy will contribute to the saving of energy usage of 4100 liter biogas per ton material.
reduced. The new, incremental energy contributions that can be obtained from waste biomass will depend on future government policies, on the rates of fossils fuel depletion, and on extrinsic and intrinsic economic factors, as well as the availability of specific residues in areas where they can be collected and utilized. All of these factors should be in detail examined to evaluate the development of the industrial waste contribution. Hope this conference will also discuss this issue in more detail as it is an important matter for all of us. We should no more think just how to produce high value product but it is also necessarily important how to keep our live in good quality by understanding following old saying…” only when the last tree has been cut, only when the last fish has been angled, and only when the last river has been polluted, then we realized that we could not eat money”.
I do not to take up any more of your time with these opening remarks. Let me simply thank you once again for sharing your thoughts with us. Here’s wishing every success for the conference. May Allah bless all of us.
Thank you for your kind attention,
AGENDA of
2
ndInternational Conference on Adaptive and Intelligent Agroindustry
(ICAIA)
Time Activities Room
Day 1 (16 September 2013)
08.00 – 09.00
Welcoming Address: Prof. NastitiSiswiIndrasti (Head of Dept TIN, Fateta, IPB)
Conference Opening: Prof. HerrySuhardiyanto(Rector of IPB) o ABET Certification announcement and short ceremony o Launching International Double Degree Master Program in
Innovation and Technopreneurship in Cooperation with University of Adelaide, Australia
o Soft-launching Master in Logistik Agroindustri (Agroindustrial Logistics)
Ballroom
10.00 – 10.45 (45’)
Opening Speeches:
Prof. IrawadiJamaran (Agroindustry Guru, IPB: 25’) Prof. Eriyatno (Industrial and System Engineering, IPB: 20’)
Ballroom
Session 1 10.45 – 11.15
(30’)
Keynote Speech Dr. YandraArkeman (IPB) Ballroom
11.15 – 12.00 (45’)
Keynote Speech Prof. Kenneth De Jong (George Mason University, USA) Ballroom
12.00 – 13.30 Invited Speakers (1-4) (4 x 20 minutes) Discussion (25 minutes)
Tentative Schedule: Prof. Kim Bryceson (Australia), Prof. SyamsulMa’arif (IPB), Prof. KudangBoro Seminar (IPB), Prof. HaruhiroFujita (Japan)
Ballroom Invited Speakers (5-8) (4 x 20 minutes) Discussion (25 minutes)
Tentative Schedule: Dr. Gajendran (UK), Prof. Noel Lindsay (University of Adelaide), Dr. KuncoroHartoWidodo (UGM), Prof. UtomoSarjonoPutro (ITB)
Ballroom
Day 2 (17 September 2013) 08.00 – 08.30
(30’)
Registration
08.30 – 10.15 (105’)
Moderator: Prof. KudangBoro Seminar (IPB) Invited Speakers (9-12) (4 x 20 minutes) Discussion (25 minutes)
12.30 – 13.30 (60’)
Lunch Break
13.30 – 15.00 (90’)
Open Discussion (Open Forum) with Prof. Kenneth De Jong
Topic: Foundations and Applications of Genetic/Evolutionary Algorithms
Ballroom
15.00 – 15.30 (30’)
Conference Closing Ballroom
15.30 – 17.00 (90’)
Indonesian Agroindustry Association (AGRIN) National Congress (PIC: Prof. Suprihatin)
Ballroom
17.00 – 17.45 (45’)
CONTENT LIST
Conference Committee
Welcoming Address ….……….………... i
Agenda of 2nd ICAIA 2013... iii Content List …………..………...………... v
A. SMART-TIN© : An Integrated And Intelligent System For The Design Of Adaptive Agroindustry (A Conceptual Framework) (Yandra Arkeman)
1‐9.
B. GHG Emission Reduction By Waste Cooking Oil Recycling In Environmental Partnership Program Of Bogor City (Haruhiro Fujita, Atsushi Yoshimoto, Katsuyuki Nakano, Koji Okuhara, Noriaki Koide, Dadang Supriatna)
10‐16.
C. Challenge of Indonesian Logistics Infrastructure for Perishables Products (Kuncoro Hartoto Widodo, Yandra Rahardian Perdana, Joewono Soemardjito)
17‐28.
D. Design Of Grouping Traditional Market Distribution Using Fuzzy Clustering And Design of Routing of Packaging Cooking Oil From Distribution Center To Traditional Market Using Traveling Salesperson Problem– Genetic Algorithm in Indonesia (Case‐Jakarta) (Teja Primawati Utami, Syamsul Maarif, Yandra Arkeman, Liesbetini Hartoto)
29‐43.
E. Determining the degree of product rightness at the conceptual stage:A Case of the Low Cost Green Car (Ade Febransyah, Fransisca Tharia)
44‐53.
F. Co‐Composting Process Of Bagasse And Sludge From Sugarcane Industry With Influence Of Difference Initial C/N Value And Aeration (Andes Ismayana, Nastiti Siswi Indrasti, Tori Sane)
54‐62.
G. Analysis Of The Competitiveness Of The Agribusiness Sector Companies Using Porter's Five Forces (M. Hudori)
63‐72.
H. Design And Optimization Of Agro‐Scm For Food And Energy Security In Indonesia (Hoetomo Lembito, Kudang Boro Seminar, Nunung Kusnadi, Yandra Arkeman) Arifin, A. Fatikunnada)
100‐112.
L. Artificial Neural Network Model Based Capacitance Dielectric For Crackers Self‐ Life Prediction (Erna Rusliana Muhamaad Saleh, Erliza Noor, Taufik Djatna, Irzaman)
113‐121.
M. Characterizing Temporal Dynamic Of Weather Variability To Support Decision Making On Weed Control (Rizky Mulya Sampurno, Kudang B. Seminar, Yuli Suharnoto, Mohamad Solahudin)
N. Risk Management Model in Dairy Product Transportation With Fuzzy Logic Approach (Winnie Septiani, Yandra Arkeman)
131‐141.
O. Strategy to Increase Institutional Capacity of Farmer Groups to Support the Transportation System Agroindustry Products (Zulfiandri, Yandra Arkeman)
142‐156.
P. Adsorption Of Carotenoid From Palm Oil Methyl Ester By Using Attapulgite And Synthetic Silica Magnesium As Adsorbent (Sapta Raharja, Prayoga Suryadarma, Zuni Fitriyantini)
157‐163.
Q. High Accuracy Agroindustry Environment Monitoring System Based on Photonic Crystal Sensor Network (Mamat Rahmat, Muhamad Azis, Erus Rustami, Wenny Maulina, Kudang Boro Seminar, Arief Sabdo Yuwono, Husin Alatas)
164‐174.
R. Study on Effect ofTemperatureIncrease on the Productivity of Methanefrom POME Fermentation (Sarono, E. Gumbira Said, Ono Suparno, Suprihatin, Udin Hasanudin)
175‐180.
S. The Design and Implementation of Geographic Information Systems to Support Food and Energy Security (Arif Purnomo Muji Basuki, Yandra Arkeman, Musthofa)
181‐191.
T. Study Of White Crystal Sugar Distribution System In Indonesia (Suripto, Yandra Arkeman)
192‐199.
U. Corncob Biodelignification Process Using White Rot Fungi (Liesbetini Hartoto, Purwoko, Elis Nina Herliyana, Cucu Rina Purwaningrum)
200‐212.
V. Color Stability of Beet Dyes Label During Heating (Endang Warsiki, Asih Setiautami)
213‐219.
W Precipitation Classification Using LVQ on Dry Season Base on Global Climate Indices Case Study in Indramayu District (Indra Kelana Jaya, Agus Buono, Yandra Arkeman)
220‐225.
X. Wood Identification Type By Using Support Vector Mechine‐Based Image (A.A. Gede Rai Gunawan, Sri Nurdiati, Yandra Arkeman)
226‐232.
Y. Fuzzy Logic Systems and Applications in Agro‐industrial Engineering and Technology (Marimin, Mushthofa)
233‐241.
Wood Identification Type by
Using Support Vector Machine – Based Image
A.A Gede Rai Gunawan
Student of Computer Science Department Bogor Agricultural University
E-mail: [email protected]
Sri Nurdiati
Lecturer of Computer Science Department Bogor Agricultural University E-mail: [email protected]
Yandra Arkeman
Lecturer of Agicultural Engineering Science Department Bogor Agricultural University
E-mail: [email protected]
ABSTRACT
Wood identification type in Indonesia usually has been done manually. The identification is done by monitoring wood pore on wood longitudinal section using loupe or microscope with 10 times zooming. The minimum computerized methods has done, due to the lack of the research in this field and the difficulty to find wood databases. This research was aimed to classify four types of wood trade in Indonesia, by using support vector machine based on image data. We used two-dimensional principal component analysis (2D-PCA) methods for extracted image data. This methods can identify the type of wood quite fast, so it is speed up the identification of wood type. The best result of this researched has accuracy 95.83%. This proves that the methods used are suitable to be applied in identification of wood type.
Keywords: wood identification, support vector machine
1. INTRODUCTION
The identification of threes in the forest can be easily recognized by scrutineering the stem of the tree, the flower, the fruit and also the leaves. Nevertheless, after the wood has been cultivated, the identification becomes more difficult, because the microscopic characteristic shall be recognized for the identification. One special features of the wood microscopic is that the pore structures, the pore shape, the pore frequency and the polarline which can only be seen clearly by using device such as microscope or loupe with at least 10 times of zooming. The identification method of the wood type can be studied as a science, even so the skill to identify the type of the wood can only be acquired through a routine exercise process, repetitively and continuosly. The problem that emerged due to unskilled officer in handling the identification process require additional time and costs. (Mandang and Pandit, 2002). The decision making system is very needed to give an appropriate solution to this problem.
The research about wood identification with Neuro-Fuzzy method has been established by Purba (2009). Paying attention to the special features of wood pore to solve the problem of identifying building material and furniture wood type. This research had a high-level accuracy yet it has a weakness on the need of big training data, hasn’t been based on image daya and only suitable when applied if the sample of the wood used for the data is the same with the training data.
been commissioned and gained a good result with various experiments. (Maryana 2012). This following research did an identification of wood type by using wood microscopic image as the characteristic identifier and extracted the image by using 2D-PCA which reduced the original image data without removing its essential information from the image itself, so it can accelerate the learning process and used the Support Vector Machine (SVM) as the classsification of the wood microscopic image. This system is highly expected to assist the forestry officer and the associated parties in forestry in identifiying the type of the wood fast and precisely. This system using the Matlab 7.8 program.
2. MATERIAL AND METHODS
Stages in the research was started with the data collection, pre-processing, data partitioning (training data and experiment data), the feature extraction by using 2D-PCA method, testing and evaluating as it shown by the Figure 1.
Figure 1: Research Method
2.1 Data Collection
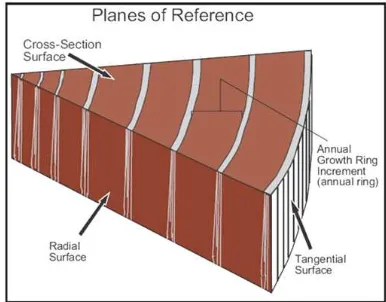
Bond and Hamner (2002) grouped the observation of wood surface into three category of geometrical field reference, i.e. the cross section, radial section, dan tangential section as shown on Figure 2.
Start
Wood Image
Pre-Processing
Data Partitioning (K-Fold Cross Validation)
Training Data
Evaluation
Finish Learning by SVM
2D-PCA
Testing by SVM Testing
The special feature of wood anatomy can be recognized on cross section by cutting the wood field perpendicularly with the direction of tree growth or wood profile. Before capturing the image the area of the wood profile had to be sliced first by using cutter to produce a good quality of wood pore image, as demonstated on Figure 3.
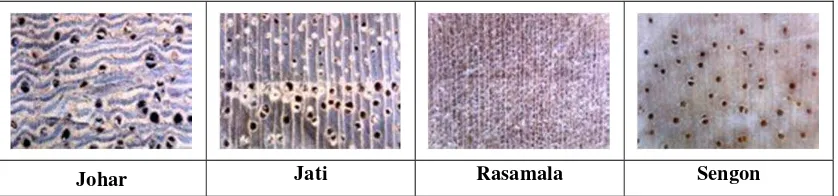
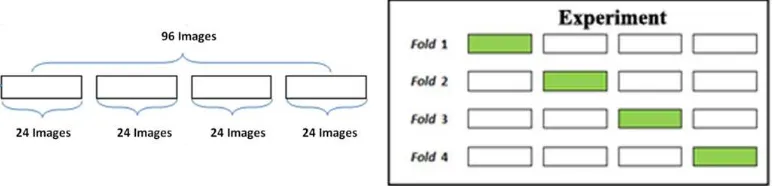
Data Acquisition of microscopic wood was implemented through wood sample image capturing that had some different kind. The total data numbers of this research was 96 images of four different woods, each of it is taken 24 wood images sized 640 x 480 pixels, as shown on Figure 4 and Figure 5.
Figure 3: The technique to slice Figure 4: Acquisition of wood wood profile area microscopic image
The image data of wood microscopic image in this research was acquired as many as four kinds and be grouped into four different classes.
Johar Jati Rasamala Sengon
Figure 5: Sample of wood microscopic data
2.2 Pre-processing
The stage of pre-processing was prepare the image which was used before proceeding into the feature extraction stage. This stage did change the size of the wood image become 128 x 96 pixels from the original size of 640 x 480 pixels and transforming the image into grayscale imag (Maryana, 2012).
2.3 Data Partitioning
Data that was used in this research was 96 images, the method that was taken into account in the data choosing process of training data and testing data is K-Fold Cross Validation (Fu, 1994). This data was then partitioned as training as many as 72 images, while testing data was 24 images, as shown on Figure 6.
Figure 6: Data Partitioning by using K-Fold
2.4 Feature Extraction
It wasexecuted by using 2D-PCA method, the part of the image that was extracted was the wood microscopic image which has been shaped equally. The result of the extraction with 2D-PCA will gather a main component in form of feature vector that was acquired by gathering the biggest feature values that cosidered as representing the collection of data. This feature vector was acquired from the covariant matrix for all exist training data.The beginning step of this 2D-PCA exraction, i.e. all of the data training image was exposured for its average first and then the process was illustrated, as shown on Figure 7. The Input of wood microscospic image had a smaller dimension than the original image, whereas for the diversity of the information, the numbers of 50% to 95% was used for the similarity of the wood microscopic image. (Maryana, 2012).
Figure 7: The Process of seeking average values of all image training data
After gaining the average mean values, then the next step was seeking the covariant matrix for the training data image by using te formula of equation number 1
̅ ̅
This Gt would than had a size of n × n dan M is the numbers of total training image data as many
as 96 images in this research. is the training image data that was used and Ā was the average
data of all the training data. And then, the feature value would be taken from the covariant matrix representing the image characteristic. From that values, the feature vector was then seek to generate feature matrix as the learning input by the SVM.
The formula to calculate acquire the feature value: | |
function, which on this research would use the function of RBF kernel and polinomial (Christianini and Taylor 2000), as shown in Figure 8.
Figure 8: The Problem of the non-lineary SVM
2.6 Analysis and Evaluation
The evaluation by using confusion matrix, was a table consisted of the numbers of testing data rows that predicted to be true and false by the classification system. This evaluation was used to determine the performance of a classification system. (Widowati, 2011). The process of training and testing by using SVM learning that was implemented to gain the result of accuracy level or the success of classsification of wood type recognition and the error level in wood microscopic image
on each of the classes. The accuracy was counted based on the testing data in four process of the fold cross validation.
Accuracy = total numbers of the true classification
total numbers of overall training data x 100%
3. TESTING AND RESULTS
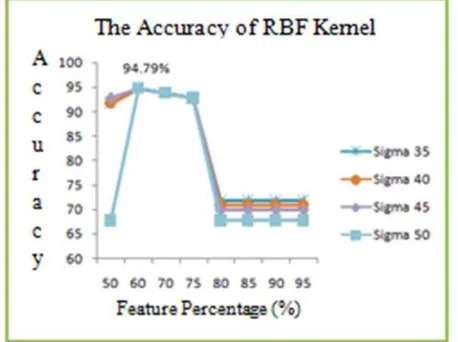
3.1 Experiment on the function of RBF kernel with sigma 35, 40, 45 dan 50
The experiment used RBF kernel function by using sigma parameter 35, 40, 45 and 50
with the feature extraction of 60%, which generated the highest accuracy level, 94.79%. The number of the false classified data was as many as 11 data of 96 data. The result of the experiment was as shown on the Figure 10.
The result of the error that was gained from the testing by using RBF kernel sigma parameter = 35, 40, 45 and 50 with the feature extraction of 60%, then asundered by using confusion matrix as shown in Tabe e1.
Table 1 Confusion matrix of the kernel RBF experiment with the sigma parameter sigma σ = 35,
40, 45 dan 50.
ACTUAL
PREDICTION
Class 1
Class 2
Class 3
Class 4
Class 1 24 0 0 0
Class 2 0 24 0 0
Class 3 0 0 21 3
Class 4 0 0 8 16
Table 1 demonstrated the classification in class 1 (Johar Wood) and Class 2 (Hardwood) classiefed 100%, while the class 3 (Rasamala Wood) had three identified data as the class 4 and class 4 (Sengon Wood) had eight data which was identified as the class 3. It marked that the class 3 and class 4 had the same image data pattern..
3.2 Experiment on polinomial kernel function with parameter order = 1
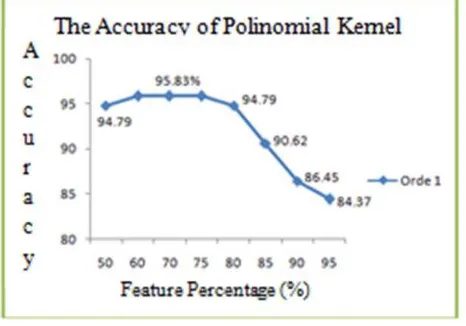
The experiment by using polinomial kernel with order parameter 1 generated the error level of 4.17% in the feature extraction of 60% until 75%. The numbers of the data which was false to be classified as many as four data from the 96 data, the result of the test was as shown in Figure 11.
Figure 11 The Graphic of polinomial kernel accuracy
Figure 11 showed the highest accuracy level on feature extraction of 60% to 75%, i.e. as many as 95,83%, while the testing in the order parameter 1 resulte that the feature extraction of 80% to 95% was happening on the decreasing accuracy until 84,3%. It demonstrated that the
Description:
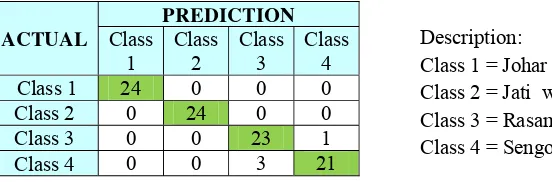
Table 2 Confusion matrix of the kernel polinomial experiment with order parameter = 1
Table 2 showed the classification on the class 1 (Johar Wood) and class 2 (Hardwood) had been identified 100%, whereas on the class 3 (Rasamala Wood) there was one identified data as the class 4 (Sengon Wood) on the predictor class and on the class 4 (Sengon Wood) there was three data that identified as the class 3 (Rasamala Wood) on the predictor class.
4. CONCLUSION
The identification of wood type based on the image data can be implemented by using the SVM and 2D-PCA as its feature extraction.
5. ACKNOWLEDGEMENT
A.A Gede Rai Gunawan would like to thank The Computer Science Department, Bogor Agricultural University for the supervision; and also The Ministry of Forestry, Republic of Indonesia for the partly supported financial.
6. REFERENCES
Bond B, Hamner P. 2002. Wood Identification for Hardwood and Soft wood Species. Tennesse (US): Department of Forestry, Wildlife and Fisheries The University of Tennessee. PB1692-1.5M-2/02.
Christianini Nello dan Taylor J.S. 2000.An Introduction to Support Vector Machines and Other Kernel-based Learning Methods.Cambridge University Press.
Fu L. 1994. Neural Network in Computer Intelligence. Singapura: McGraw Hill. ISBN: 0071133194.
Le Thai Hoang, Bui Len (2011), Face Recognation Based on SVM and 2D-PCA, International Journal of Signal Processing, Image Processing and Pattern Recognation, Vol.4. No.3. Page 85-93.
Mandang YL, Pandit IKN. 2002. Manual Series: A Guidebook to Identify the Field Wood Type.Bogor (ID): PROSEA.
Maryana S. 2012. The Support Vector Machine Modelling to Identify Edible Farn Plants
Based on Spore Image In the Eigen Room. [Thesis]. Bogor (ID): Institut Pertanian Bogor.
Purba FRBr. 2009. The System Engineering of Neuro-Fuzzy in Identifying the Meubelair Wood Type and Furniture. (ID): SNATI UII, ISSN 1907.
Widowati W. 2011. Comparation of The Classifiers to Identify Ornamental Plant [Script]. Bogor (ID): Institut Pertanian Bogor.
Description: