Modeling of ANFIS in predicting TiN coatings
roughness
1, 3
A.S.M. Jaya,
1S.Z.M. Hashim,
1H. Haron,
2R. Ngah
1Fac. of Computer Science and Information System, 2
Wireless Communication Centre, Fac. of Electrical Eng. Universiti Teknologi Malaysia
81310, UTM, Skudai Johor, Malaysia
[email protected], [email protected], [email protected], [email protected]
4
M.R. Muhamad,
4M.N.A. Rahman
3Centre of Advanced Computing Technology (C-ACT), 4
Fac. of Manufacturing Eng. Universiti Teknikal Malaysia Melaka Hang Tuah Jaya, 76100, Durian Tunggal
Melaka, Malaysia
[email protected], [email protected]
Abstract— In this paper, an approach in predicting surface roughness of Titanium Aluminum Nitrite (TiN) coatings using Adaptive Network Based Fuzzy Inference System (ANFIS) is implemented. The TiN coatings were coated on tungsten carbide (WC) using Physical Vapor Deposition (PVD) magnetron sputtering process. The N2 pressure, argon pressure and turntable speed were selected as the input parameters and the surface roughness as an output of the process. Response Surface Methodology (RSM) was used to design the matrix in collecting the experimental data. In the ANFIS structure, triangular, trapezoidal, bell and Gaussian shapes were used for as input membership function (MFs). The collected experimental data was used to train the ANFIS model. Then, the ANFIS model were validated with the actual testing data and compared with regression model in terms of the residual error and model accuracy. The result indicated that the ANFIS model using three bell shapes MFs obtained better result compared to the polynomial regression model. The number of MFs showed significant influence to the ANFIS model performance. The result also indicated that the limited experimental data could be used in training the ANFIS model and resulting accurate predictive result.
Keywords- ANFIS; TiN coatings; roughness; PVD magnetron sputtering
I. INTRODUCTION
High temperature on the cutting tip in high speed machining could exceed 800oC. This condition causes cutting tool wear and reducing tool life. Thus, the cutting tool with high resistance in wear is needed to face with this crucial condition. The high wear resistance tool promises better tool life and optimized the machining cost. This performance could be improved by applying thin film coating on the cutting tool. The main purpose of coating is to enhance the surface properties while maintaining its bulks properties. The coated tool has been proved forty times better in tool wear resistance compared to the uncoated tool [1]. Hard coatings such as Titanium Nitride (TiN) coating are used
Physical vapor deposition (PVD) and chemical vapor deposition (CVD) are two main techniques in depositing coating on the cutting tool. The PVD process uses a solid target as a source material which vapors in atom particle to be a thin film coating. However, the CVD process uses a chemical source as coating material. In the PVD coating process, the sputtered particle from harder material embedded on the cutting tool in presence of reactive gas. A process in PVD technique called magnetron sputtering is well-known technology used in hard coatings industry due to ability to sputter many hard materials such as titanium to be coated to cutting tool.
In PVD coating process, many factors are reported have significant influence to coating characteristics including surface roughness [2-4]. Coating roughness is one of important characteristic that influences machining performances. It effects the friction level and material pick-up behaviour of cutting tool upon sliding with workpiece material [5]. Some of the researches work done shown that N2 pressure, Argon pressure and turntable speed could have significant effect on the deposited coating roughness and surface morphology [6-8].
Modeling is an adequate way to address the coating process issues such as cost and customization. A model could be used to predict the coating performance value and indicates the optimum combination of input parameters to find best result. Many techniques has been applied to model coating works. Design of experiment based approaches such as Taguchi [9], full factorial and Response Surface Method (RSM) [10] have been reported in designing model with minimum experimental run [11]. Intelligent based approaches such as neural network [12] and ANFIS [13] also have been used to predict the coating performance.
out on application of ANFIS technique for predicting the surface roughness of TiN coatings. The main purpose of this study is to investigate the application of ANFIS model for predicting the surface roughness of TiN coatings by using limited number of experimental data. Part II explains the experiment and measurement works. Part III describes how the ANFIS modeling was done. Part IV indicates and discuss the result of the study.
II. EXPERIMENTAL DETAILS
A. Material and Method
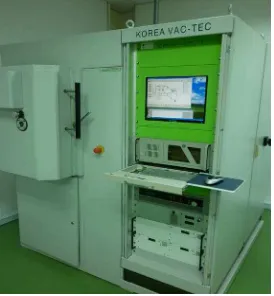
In this study, the experiment was run in unbalanced PVD magnetron sputtering system model VTC PVD 1000 as shown in Fig. 1. The machine consists huge coating chamber where the sputtering and deposition of coating process happened. It was fixed with vertically mounted 99.99% titanium (Ti) targets which used as coating material.
Figure 1. PVD unbalanced magnetron sputtering system model VTC PVD 1000.
In sample preparation works, the surface of tungsten carbide cutting tool insert was cleaned with alcohol bath in an ultrasonic cleaner for 20 minute-bathing. Then, the substrates were dried using hair dryer to remove wet particle from the sample surface. After that, three samples were load on the substrate holder and rotation speed was set between 4 to 9 rpm. An inert gas called argon was pumped into the chamber to produce electron. The nitrogen gas was also pumped in as a reactive gas. The substrate was coated with the titanium in the presence of nitrogen gases.
The coating process consisted of substrate ion cleaning, and deposition of TiN coating. The better coating adhesion was obtained through the substrate ion cleaning process where the impurity on the substrate surface was removed. Then, the coating process was done in the presence of 0.16×10⁻³ mbar to 3.66×10⁻³ mbar nitrogen gas to produce TiN. The detail settings of the both processes are shown Table I. An empirical approach called Response Surface Modeling (RSM) was used to develop the centre cubic design. For this purpose, a Design Expert
software version 8.0 was used to develop the experimental matrix. After the experiment, the influences of N2 pressure, argon pressure and turntable speed on the coating roughness were analyzed.
TABLE I. THE EXPERIMENT SETTING
Process Variables Substrate ion cleaning
TiN deposition
• Sputtering power (kW)
• Substrate temperature ( C)
• Ion source power (kV/A)
• Substrate bias voltage (V)
• N
2 pressure (×10-3 mbar)
• Argon pressure (×10-3 mbar)
• Turntable speed (rpm)
• Duration (min)
- 300 0.24 / 0.4 -200 - - 4.0 30
4.0 400 0.24 / 0.4 -200 0.16 – 3.66 3.66 – 4.34 4.0-9.0 150
B. Atomic Force Microscopy
Figure 2. AFM Park System XE-100 model
Roughness values of the TiN coatings was inspected by using scanning force microscopy (AFM) method. The method determined the morphology of the surface based with less requirement of sample preparation and non-destructive testing. A shown in Fig. 2, the AFM XE-100 model was used at room temperature in characterizing coating roughness. The non-contact mode detection approach using a commercial cantilever was used and the scanning area was set to 25x25 microns (625
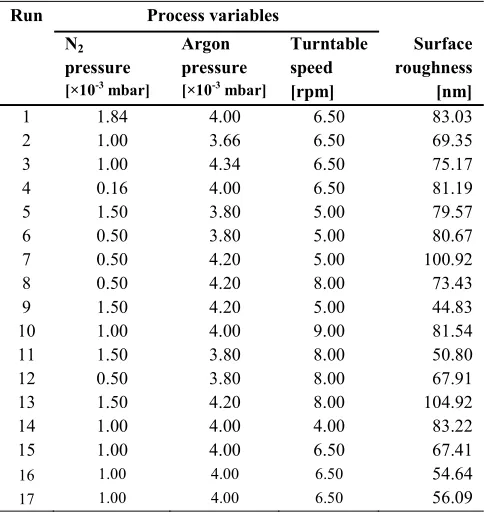
TABLE II. PROCESS PARAMETERS AND EXPERIMENTAL RESULT OF TIN COATINGS ROUGHNESS
Run Process variables
N2 pressure [×10-3 mbar]
Argon pressure [×10-3 mbar]
Turntable speed [rpm]
Surface roughness [nm]
1 1.84 4.00 6.50 83.03
2 1.00 3.66 6.50 69.35
3 1.00 4.34 6.50 75.17
4 0.16 4.00 6.50 81.19
5 1.50 3.80 5.00 79.57
6 0.50 3.80 5.00 80.67
7 0.50 4.20 5.00 100.92
8 0.50 4.20 8.00 73.43
9 1.50 4.20 5.00 44.83
10 1.00 4.00 9.00 81.54
11 1.50 3.80 8.00 50.80
12 0.50 3.80 8.00 67.91
13 1.50 4.20 8.00 104.92
14 1.00 4.00 4.00 83.22
15 1.00 4.00 6.50 67.41
16 1.00 4.00 6.50 54.64
17 1.00 4.00 6.50 56.09
III. ANFISMODELING
Adaptive Network Based Fuzzy Inference System (ANFIS) was presented by Jang in 1993 [19]. In this system, a hybrid learning procedure is used to construct an input-output mapping based on the human knowledge and training data pairs. The fuzzy inference system is employed in the framework of adaptive networks. ANFIS is normally contains a five-layer feed forward neural network excluding inputs to construct the inference system. Each layer consists of several nodes described by nodes function. The nodes in previous layer feed input to nodes in next layer.
Figure 3. The ANFIS structure with five layers and nodes
Fig. 3 illustrates the structure of ANFIS with five layers. To illustrate the procedures of an ANFIS, it is assumed that the system has three inputs (x, y, z) and one output (f). The ANFIS rules based contains fuzzy if-then rules of Sugeno type. The rules can be stated as:
Rule 1: If x is A1 and y is B1 andz is C1 then f is f1(x,y,z) Rule 1: If x is A2 and y is B2 andz is C2 then f is f2(x,y,z)
where x, y and z are the inputs of ANFIS, A, B and C are the fuzzy sets fi (x,y,z) is a first order polynomial and represents the outputs of the first order Sugeno fuzzy inference system.
TABLE III. PARAMETERS SETTING FOR ANFISMODEL
ANFIS variables Setting Input Variables
Output Response Input MFs Type
No. of MFs Output MFs Type Optimization Method
Epochs
N2 pressure, argon pressure,
turntable speed Surface roughness
Triangular, Trapezoidal, Bell, and Gaussian
2, 3, 4, 5 Linear
Hybrid of the least-squares and the back propagation gradient descent method.
250
In this study, three variables were selected for inputs of the ANFIS model to predict an output response. To find the optimum ANFIS structure, the type of input membership function (MFs) and number of MFs were used as ANFIS variables. The triangular, trapezoidal, bell and Gaussian MFs were used in the ANFIS structure with every MFs had two, three, four and five number of MFs shape. To train the model, hybrid of the least-squares method and the back propagation gradient descent which also called hybrid method was used as optimization method to emulate a given training dataset. The linear output MFs was used to produce the surface roughness value. The details of ANFIS parameters setting is shown in Table IV.
IV. RESULT AND DISCUSSION
0.5 1 1.5
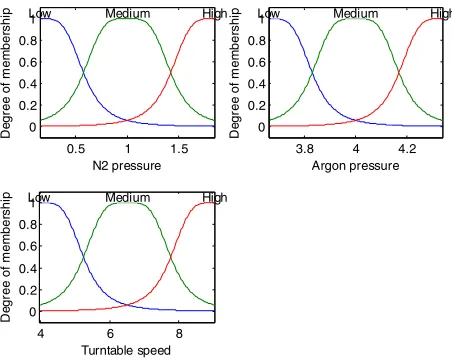
Figure 4. The Bell MFs for the input variables before training
0.5 1 1.5
Figure 5. The Bell MFs for the input variables after training
From the figures, a major change obviously can be seen on the shape of N2 pressure MFs and argon pressure MFs after the training process. Otherwise, the membership functions of the turntable speed indicates only a slight changes. Fig. 6 shows the convergence of the ANFIS training after 250 epoch. The lowest root mean square error (RMSE) of the ANFIS model was achieved in 66th epoch with 1.10276. However, the RMSE increased again to 10.704 in 250th epoch.
0 50 100 150 200 250
Figure 6. Convergence of ANFIS training
To verify the performance of the proposed ANFIS model, the following measures were used. The residual error (%) in (1) was used to quantify the difference between predicted and actual values. Then, the minimum, maximum and average of the residual error for every ANFIS model with difference MFs was compared. The prediction accuracy (A) in (2) was computed to determine the accuracy of the models.
−
where
n
is number of testing data,v
a is experimental value andv
pis predicted value.Three testing dataset from separated experiment were used to verify the developed ANFIS model. The testing dataset is shown in Table IV. Meanwhile, Table V and VI shows the result of the ANFIS models with different type of input MFs (triangular, trapezoidal, Gaussian and bell) and different number of membership function (2, 3, 4 and 5). The both table show that the 2-2-2 and 3-3-3 structure of the ANFIS model indicate lower residual error compared to 4-4-4 and 5-5-5 structure ANFIS model. This findings are indicted in Table VI where the maximum percentage of residual error is indicated in 4-4-4 and 5-5-5 ANFIS structure. The lowest maximum value of residual error is indicated in 3-3-3 Bell shape MFs. The 3-3-3 Bell shape MFs also indicates the lowest average of the residual error.
TABLE IV. VALIDATION DATA
DEVELOPED ANFISMODELS
MFs 2-2-2 3-3-3 4-4-4 5-5-5
Trap 19.46 14.29 33.28 100.00
A
Meanwhile, Fig. 7 and Fig. 8 show the average percentage error of the ANFIS model with different type of MFs and different number of MFs, respectively. Fig. 7 shows that all MFs have lowest percentage error in 2-2-2 and 3-3-3 structure. Then, the average of residual error increased over 20% for 4-4-4 and 5-5-5 ANFIS structure. This figure also indicates that no significant different in terms of residual error between the types of MFs. Conversely, the difference of residual error is clearly indicated between different number of MFs as shown in Fig. 8. The 2-2-2 and 3-3-3 ANFIS structure have less than 12% average of residual error. Then, the residual error increased in
4-4-4 and 5-5-5 ANFIS structure. This finding concludes that the number of MFs has significant influence to the performance of the ANFIS model.
Figure 7. Average percentage error of the ANFIS model with different type of MFs
Figure 8. Average percentage error of the ANFIS model with different number of MFs
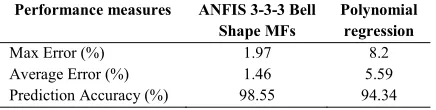
Besides that, Table VII shows the comparison of 3-3-3 bell MFs of ANFIS model with RSM polynomial regression roughness model, in terms of maximum residual error, average residual error and prediction accuracy. The regression model was developed using RSM technique using same variables and input data. From the table, the ANFIS model indicates better performances compared to the polynomial regression model to predict the coating roughness.
TABLE VII. COMPARISON OF ANFISMODEL WITH POLYNOMIAL
REGRESSION MODEL IN TERMS OF RESIDUAL ERRORAND MODEL ACCURACY
Performance measures ANFIS 3-3-3 Bell Shape MFs
Polynomial regression
Max Error (%) 1.97 8.2
Average Error (%) 1.46 5.59
V. CONCLUSION
In this study, the ANFIS model was used in predicting the surface roughness of TiN coatings. The 17 experimental data were used to train the ANFIS model and 3 testing dataset were used for validation. The input parameters were the N2 pressure, argon pressure and turntable speed with surface roughness of the TiN coatings as the output response. The triangular, trapezoidal, bell and Gaussian shapes were selected as input membership function with number of membership function were two, three, four and five. The results in terms of maximum residual error, average residual error and prediction accuracy were compared with RSM polynomial regression model. The results have shown that:
• The ANFIS model with 2-2-2 and 3-3-3 structure indicated
the lowest maximum residual error compared to 4-4-4 and 5-5-5 ANFIS structure.
• The number of MFs variable shows significant influence to
the ANFIS model performance. However, the type of MFs variable indicates insignificant influence to the ANFIS performance.
• The 3-3-3 bell MFs of ANFIS model showed better
performances compared RSM polynomial regression model with less maximum error, less average error and higher prediction accuracy.
• The better agreement between the measured and predicted
values of ANFIS model showed that the proposed ANFIS model can be a good option in predicting TiN coatings roughness.
• The result also indicated that the ANFIS model could predict
accurate output response even using limited training data.
ACKNOWLEDGMENT
The authors are grateful to Universiti Teknologi Malaysia (UTM), Ministry of Higher Education (MOHE) and Universiti Teknikal Malaysia Melaka (UTeM) for data and financial support.
REFERENCES
[1] K. Tuffy, G. Byrne, and D. Dowling, "Determination of the optimum TiN coating thickness on WC inserts for machining carbon steels,"
Journal of Materials Processing Technology, vol. 155-156, pp. 1861-1866, 2004.
[2] P. H. Mayrhofer, C. Mitterer, L. Hultman, and H. Clemens, "Microstructural design of hard coatings," Progress in Materials Science, vol. 51, pp. 1032-1114, 2006.
[3] J. Musil and J. Vleck, "Magnetron sputtering of films with controlled texture and grain size," Material Chemistry and Physics, vol. 54, pp. 116-122, 1998.
[4] D. L. Smith, Thin Film Deposition: Principle & Practice. New York: McGraw Hill, 1995.
[5] B. Podgornik, S. Hogmark, and O. Sandberg, "Influence of surface roughness and coating type on the galling properties of coated forming tool steel," Surface & Coatings Technology, vol. 184, 2004.
[6] K. Chakrabarti, J. J. Jeong, S. K. Hwang, Y. C. Yoo, and C. M. Lee, "Effects of nitrogen flow rates on the growth morphology of TiAlN films prepared by an rf-reactive sputtering technique," Thin Solid Films, vol. 406, pp. 159-163, 2002.
[7] H. C. Jiang, W. L. Zhang, W. X. Zhang, and B. Peng, "Effects of argon pressure on magnetic properties and low-field magneto striction of amorphousTbFe films," Physica B, vol. 405, pp. 834-838, 2010.
[8] M. Matsumoto, K. Wada, N. Yamaguchi, T. Kato, and H. Matsubara, "Effects of substrate rotation speed during deposition on the thermal cycle life of thermal barrier coatings fabricated by electron beam physical vapor deposition " Surface and Coating Technology, vol. 202, pp. 3507-3512, 2008.
[9] D. Yu, C. Wanga, X. Cheng, and F. Zhang, "Optimization of hybrid PVD process of TiAlN coatings by Taguchi method," Applied Surface Science, vol. 255, pp. 1865-1869, 2008.
[10] G. Xiao and Z. Zhu, "Friction materials development by using DOE/RSM and artificial neural network," Tribology International,
vol. 43, pp. 218-227, 2010.
[11] F. Karacan, U. Ozden, and S. Karacan, "Optimization of manufacturing conditions for activated carbon from Turkish lignite by chemical activation using response surface methodology " Applied Thermal Engineering, vol. 27, pp. 1212-1218, 2007.
[12] H. Cetinel, H. Ozturk, E. Celik, and B. Karlik, "Artificial neural network-based prediction technique for wear loss quantities in Mo coating," Wear, vol. 26, pp. 1064-1068, 2006.
[13] A. S. M. Jaya, A. S. H. Basari, S. Z. M. Hashim, H. Haron, M. R. Muhamad, and M. N. A. Rahman, "Application of ANFIS in Predicting of TiAlN Coatings Hardness," Australian Journal of Basic and Applied Sciences, vol. 5, pp. 1647-1657, 2011.
[14] W.-H. Ho, J.-T. Tsai, B.-T. Lin, and J.-H. Chou, "Adaptive network-based fuzzy inference system for prediction of surface roughness in end milling process using hybrid Taguchi-genetic learning algorithm," Expert Systems with Applications, vol. 36, pp. 3216-3222, 2009.
[15] Z. Uros, C. Franc, and K. Edi, "Adaptive network based inference system for estimation of flank wear in end-milling," Journal of Materials Processing Technology, vol. 209, pp. 1504-1511, 2009. [16] J. Zapata, R. Vilar, and R. Ruiz, "An adaptive-network-based fuzzy
inference system for classification of welding defects," NDT&E International, vol. 43, pp. 191-199, 2010.
[17] G. Daoming and C. Jie, "ANFIS for high-pressure waterjet cleaning prediction," Surface & Coatings Technology, vol. 201, pp. 1629-1634, 2006.
[18] Ç. Ulas, A. Hasçalık, and S. Ekici, "An adaptive neuro-fuzzy inference system (ANFIS) model for wire-EDM," Expert Systems with Applications, vol. 36, pp. 6135-6139, 2009.