The Assessment of the Effect of Surface Roughness on Drag Coefficient and
Aerodynamics Features of Loggerhead Sea Turtle Carapace
Alan Chan Kah Poha, Cheng See Yuana*, Ahmad Kamal Mat Yamina, Ainil Jesita
Jalaluddina, Iskandar Shah Ishakb, Shuhaimi Mansorb
a. Universiti Teknikal Malaysia Melaka b. Universiti Teknologi Malaysia
*019-6677567 (mobile), 06-2332429 (fax), [email protected]
Abstract
The present investigation primarily studies the effect of surface roughness on the drag coefficient, Cd of a Loggerhead sea turtle carapace using a subsonic wind tunnel. The pressure coefficient, Cp distribution across the Loggerhead carapace was also investigated and is compared to the Cp trend of an airfoil in order to deduce the aerodynamics features of the Loggerhead carapace. One-to-five-scaled models are created based on the dimensions of a real Loggerhead turtle with simplification. Four roughness scales were employed to capture the Cd trend at increasing Reynolds numbers, Re. As expected, the Cd levelled off with Re for all four models investigated. However, the Re where constant Cd began varies with relative roughness of the carapace models. The results also show good correlation between the Cd and relative roughness. In addition, the wind tunnel results are able to capture the Cp trend of the carapace models and compared to Cp values of an airfoil. Results reveal that the upper surface of the Loggerhead carapace is streamlined but with restrictions of angle of attack.
Keywords: drag coefficient, aerodynamics, loggerhead sea turtle, carapace, wind tunnel
1. Introduction
In the shores of Shark Bay, Western Australia, a relatively undisturbed foraging ground, forms an excellent feeding ground for sea turtles and hosts a rich marine ecosystem (Heithaus et al. 2005). A research led by Dr. Mike Heithaus over a span of ten years has revealed the fact that green sea turtles (Chelonia mydas) are less likely to be attacked by
tiger sharks(Galeocerdo cuvier) when compared to
Loggerheads (Caretta caretta), sometimes as much
as five times (Heithaus et al. 2002). Although both are of the same family of Cheloniidae, the green and Loggerhead sea turtle are as different as tanks and flying saucers.
The cause to why Loggerhead sea turtles are at higher risks of being attacked by tiger sharks at Shark Bay, Western Australia are comprised of many factors, one of which is the Loggerhead’s habit of not cleaning its shell thus allowing the build-up of roughness over time. However, to the author’s knowledge, there has yet to be any comprehensive study on how drag upon the shell is influenced by the roughness build-up on loggerhead carapace. In the context of this project, the main objective is to study the effects of roughness built up on the shell of loggerhead sea turtles in relation to drag.
The investigation had focused on the Caretta caretta (Loggerhead sea turtle) that dwells within the Caribbean Seas near Curacao (Netherlands Antilles). A simplified model was built from the dimensions of a real Loggerhead sea turtle whereby the Standard Carapace Length (SCL) and Standard Carapace Width (SCW) were referenced from an actual loggerhead. Verification of the designed model was reflected based on the values of blockage ratio. Following this, the surface roughness of the models was defined and analysis based on wind tunnel testing results was done to examine static drag in relationship with the surface roughness.
2. Experimental details
2.1. Wind Tunnel Model Preparation
2.1.1. Model Design
Based on a study (Epperly et al. n.d.), as well as dimensioning conventions used by Dr. Wyneken (2001), the Standard Carapace Length (SCL) and Standard Carapace Width (SCW) were taken at 0.92 m and 0.63 m respectively. As for the swimming speed, a research (Nagelkerken et al. 2003) yields a mean swimming speed of 0.5721 m/s. As for the temperature and density of the sea
water, the values are taken at 80 ºF and 1027 kg/m3
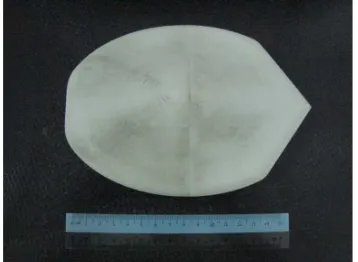
were finalized at using a one-fifth scale of the selected actual size and designed using Solidworks 2006 as shown in Figure 1, and were fabricated using thermoplastic via Rapid Prototyping with the final model shown in Figure 2.
Figure 1. Simplified wind tunnel model of loggerhead carapace.
Figure 2. Model product of Rapid Prototyping
Blockage ratios were calculated using methods introduced by Scott Thor (2007a) which applies digital imaging software. In his method, the frontal area of the carapace is calculated by:
Ar
Ac
=
Pr
Pc
Whereby,
Ac = Frontal area of carapace Ar = Frontal area of reference cuboid Pc = Black pixel count of carapace Pr = Black pixel count of reference cuboid
2.1.2. Surface Roughness Definition
In the present study, the relative roughness of a finished surface is defined by the formula:
Relative roughness =
D
ε
where
ε
refers to the mean roughness height of fifteen tabulated points determined with a scope and D is the chord length of the model. Data wasretrieved from a test-slate with the respective roughness to be tabulated. In total, four roughness models were used as summarized in shown in Table 1. For convenience of discussion, the models are designated as Models A, B, C and D respectively.
Table 1. Relative roughness data
Specimen Relative
Roughness
A Smooth
B 0.430
C 0.456
D 0.556
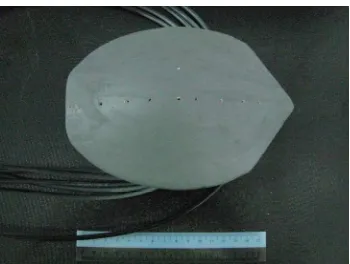
Figure 3. Pressure-tapping numbering
A model with eleven pressure tappings was designed and fabricated as shown in Figure 3 using eleven polyurethane tubes. The relative distance, x/L of the tapping points from the anterior tip is shown in Table 2.
Table 2. Relative distance of tapping points
Tapping no.
Relative Distance from anterior tip,
x/L
1 0.00
2 0.04
3 0.17
4 0.28
5 0.36
6 0.47
7 0.53
8 0.63
9 0.73
10 0.81
11 1.00
2.2. Wind Tunnel Testing
Aerodynamic static load testing were done on Models A, B, C and D to initially obtain the drag coefficient (Cd) values at increasing Reynolds number (Re) ranging from 1.1 x 10⁵ to 6.3 x 10⁵ in a subsonic wind tunnel with a test section area of 2.0 m in width and 1.5 m in height. This was followed by testing Specimens A and D with multiple angle of attack ranging from -30 º to +30 º from the horizontal axis at a fixed Re of 4.5 x 10⁵ where positive angular displacement is denoted by clockwise rotation from the horizontal axis as shown in Figure 4.
Figure 4. Orientation of angle of attack
Figure 5. Pressure-tapped Loggerhead model
Pressure measurement testing was carried out on the pressure-tapped-model shown in Figure 5. Testing was done at Re ranging from 1.1 x 10⁵ to 4.5 x 10⁵. This was followed by subjecting the model to a fixed Re of 4.5 x 10⁵ at different angles of attack starting at -30 º to +30 º from the horizontal axis.
A Pitot static tube was also installed at the test section, in order to obtain the free stream static and dynamic pressures. The pressure coefficient (Cp) was determined by the following equation:
i
Cp
=∞ ∞
−
q
P
P
iwhere i = Taping point number
P
i= Pressure tap at ‘i’P = Free stream static pressure (Pa)
q = Free stream dynamic pressure (Pa)
3. Results and discussion
3.1. Effects of Reynolds Number (Re) on Drag Coefficient (Cd)
0.00 1.00 2.00 3.00 4.00 5.00 6.00 7.00
0.0 2.0 4.0 6.0 8.0
Re x 105
C
d
Model A
Model B
Model C
Model D
Figure 6. Graph of Cd against Re for different specimens
From the graph shown in Figure 6, Model A registers a high Cd value when Re is 1.1 x 10⁵ but the subsequent Cd values show a quick decrement before gradually showing more constant results at the Re approaches the 5.0 x 10⁵ region. Model B also starts off at a higher Cd value before having the Cd value decrease as Re increases. Again, the Cd values show little variation as the Re increases past the 5.0 x 10⁵ region. Models C and D show similar trends as the earlier two specimens and only differ in terms of values.
It was clearly observed that the ending Cd values of Models D, C, B and A are in descending order when the Re is 6.3 x 10⁵. The immediate inference that can be made is that a rougher model yields a higher drag coefficient which is a commonly accepted logic in aerodynamic study. More importantly, it also revealed that the critical wind speed in which the drag forces seem to stabilize when Re approaches 4.5 x 10⁵. This can be seen from the lack of fluctuation of drag coefficient values as shown in Figure 6.
At Re of 4.5 x 10⁵, the values of Cd of Models A, B, C and D are 1.02, 1.39, 1.64 and 1.85 respectively. Comparing this to the Cd values of 0.04, 0.3 and 1.05 for the typical design of an
automobile, streamlined body and cube
internal balance for the load cell was improvised to be attached externally to the Loggerhead model. Thus, the balance support itself would be subjected to the oncoming wind and induce a certain amount of drag, especially against such a somewhat small-scaled model. The amount of the error could be
quantified; however, this entails further
investigation on the load cell.
Cd against relative roughness
0.00 0.10 0.20 0.30 0.40 0.50 0.60
Relative roughness
C
d
Figure 7. Cd plotted against relative roughness at Re 4.5 x 10⁵
Figure 7 depicts the general relationship that increase in roughness leads to increased friction drag which ultimately induces a higher drag coefficient. At this point, it is still too early to determine the exact function that relates Cd to relative roughness and future studies should include a broader array of roughness.
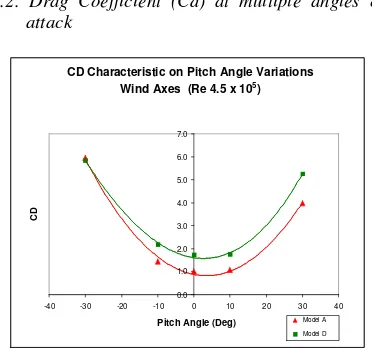
3.2. Drag Coefficient (Cd) at multiple angles of attack
CD Characteristic on Pitch Angle Variations Wind Axes (Re 4.5 x 10⁵) ‘U’ trend. This translates that the drag coefficient of the Loggerhead model, regardless of roughness, is maximum when the angle of attack is -30 º. As the angle of attack is decreased to -10 º and 0 º, the corresponding drag coefficients are also decreased. Once the angle of attack increases from 0 º to 10 º and 30 º ultimately, the drag coefficients increase as well.
Maximum drag occurs at -30 º for both models. It may be due to the fact that at an inclination of -30 º, the entire upper surface profile of the model is directly subjected to the oncoming wind-flow, inducing the air-flow to be directed along the upper surface until the tip while generating a wake region adjacent to the bottom surface. Thus, a substantial pressure drag is created. This compared to when the model is at 30 º, a smaller wake region area adjacent to the upper surface of the posterior half is generated. This may be because air-flow is directed to distribute across the streamline upper surface. The phenomena of negative inclinations having a
0.00 0.20 0.40 0.60 0.80 1.00 1.20
Relative distance of chord length (x/L)
C
Figure 9. Cp values at various Re
Tapping 1 yields the highest pressure
coefficient. The general trend of the curves show the pressure coefficient decreases steeply from tapping 1 to 2 before slightly increasing at tapping 3. Tappings 4, 5 and 6 gradually decrease whereby tapping 6 is the point whereby least pressure acts evident starting at tapping 7 all the way to 11.
speed of 1.1 x 10⁵. This is due to the nature of the geometric position of tapping 2 in the pressure model. A closer look at the model would show that tapping 2 is positioned at a distance very close to the sharp curving corner of the anterior side of the Loggerhead model. As wind currents flow across the model from tapping 1 to tapping 2, much of the current would be directed outwards away from tapping 2 due to the curving corner, creating wakes and a sudden rise in pressure at tapping 3.
From this point onwards, the current flow regains energy across the pressure model, and the pressure falls gradually before reaching a minimum value at tapping 6. This is due to the gradual inclination of the model profile that peaks at tapping 6. Again, tapping 7 onwards will show growth in pressure, though still of negative values as the inclination of the profile is reversed before finally reaching a positive value at the posterior end of the model at tapping 11. The negative values of Cp from tapping 2 to 9 reflect and that the profile of the model induces a smoother or faster flow of the wind current thus generating a low pressure region.
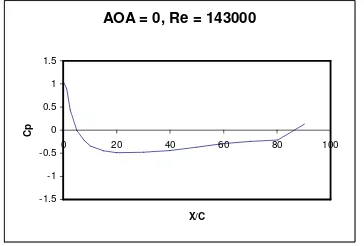
AOA = 0, Re = 143000
Figure 11. Airfoil tapping scheme
Cp at 1.1 x 10^5 (Re)
0.00 0.20 0.40 0.60 0.80 1.00 1.20
Relative distance of chord length (x/L)
C
p
Figure 12. Cp against relative distance
Figure 10 depicts the curve trend for the upper surface of an airfoil, shown in Figure 11, at Re of 1.43 x 10⁵ and angle of attack of 0 º (Stern F. 2004). The curve begins with a positive Cp followed by a steep drop into the negative Cp region and maintains until the very tip of the airfoil. Such a trend is typical of an airfoil as the upper surface of an airfoil is subjected to faster air-flow due to the surface profiling thus creating a low pressure region, as opposed to the bottom surface of the airfoil whereby there is a higher pressure presence, which ultimately generates lift.
Figure 12 shows the curve trend for the Loggerhead model at Re of 1.1x 10⁵ and angle of attack of 0 º. Overall, the curve signifies a similar trend to that of the airfoil’s whereby the initial high Cp value drops drastically to a negative Cp value and this negative pressure zone maintains until the tip. However, there is a rise is pressure after point 2 due to the geometric profile of the anterior edge of the model that has a flattened face. This could result in a disruption of the air-flow and thus a gain in pressure at point 3. The comparison between the two curves suggests that the upper surface of the Loggerhead model is streamlined as that of the airfoil’s surface.
3.4. Pressure Coefficient (Cp) at Different Angles of Attack
Cp at various angles of attack
-5.00
0.00 0.20 0.40 0.60 0.80 1.00 1.20
Relative distance of chord length (x/L)
C
Figure 13. Cp at various angles of attack against relative distance of chord length
Figure 13 represent the plotted data of pressure coefficient at different pitch or angles of attack. At an angle of -10 º, it can seen the highest pressure is at point 1, gradually decreasing to point 6 before increasing once more to a pressure coefficient bordering about the value of 0.1.
to point 1 which is located at the lateral edge of the anterior part of the Loggerhead model.
At an angle of 10 º, it is clearly that the trend mimics that of 0 º discussed earlier. However, at this inclined angle, the initial pressure drop is greater just as the latter pressure rise is steeper when compared to the trend of the Specimen at 0 º. This signifies that the anterior portion of the model is subjected to a faster flowing current distribution acting over the surface and slows down considerable as it approaches the posterior half of the model. At an angle of 30 º, the pressure coefficient is lowest at tapping 2. Not only is more of the flat underside of the model is exposed to the oncoming wind current, much more blockage of the current occurs. This would explain why there is very little variation among the distribution of points albeit showing a fairly recognizable pattern due to nature of the profile of the model. It should be emphasized that tapping 2 experiences such a vast drop in pressure is due to the massive air flow acceleration right around the leading edge of the anterior half of the Specimen, subsequently leading to a low static pressure region.
Overall, this result reflects that the Loggerhead model loses its streamline-feature with the positive increase in the angle of attack.
4. Conclusion
From the tabulated data, it qualitatively shows that the increased surface roughness results in a direct increase in drag regardless of the angle of
attack. Furthermore, pressure coefficient
comparisons with an airfoil body both
quantitatively and qualitatively classify the upper surface of a Loggerhead carapace to be of stream-line-nature so long as its angle of attack is kept to a
zero or negative-value (counter-clockwise
direction) region from the horizontal axis. This strongly hints of a new avenue for marine engineering design enthusiasts to venture in as have been spearheaded by a Japanese team led by Konno, A. who have developed a submergence vehicle based on the design of a turtle (Konno A. et al. 2005).
Acknowledgements
The work reported in this paper has been fully funded by Technical University of Malaysia, Melaka (UTeM).
References
1. Cengel, Y.A. and Cimbala, J.M. (2006).
Fluid mechanics: Fundamental and
applications, International edition,
McGraw-Hill, Singapore.
2. Epperly, S.P., Snover, M.L., Mcneil, J.B., Witzell, W.N, Brown, C.A, Csuzdi, L.A,
Teas, W.G, Crowder, L.B.(n.d.) Part 1:
Stock assessment of loggerhead sea turtles of the western north Atlantic.
Marine Ecology Progress, Series 288,
285-294.
5. Heithaus, M.R., A. Frid, and L.M. Dill. 2002. Shark-inflicted injury frequencies, escape ability, and habitat use of green and loggerhead turtles. Marine Biology, 140,
229-236.
6. Konno, A., Furuya, T., Mizuno, A.,
Hishinuma, K., Hirata, K. and Kawada, M.
2005. Development of turtle-like
submergence vehicle. Proceedings of the
7th International Symposium on Marine
Engineering.
7. Nagelkerken, Pors, L.P.J.J., Hoetjes, P.
2003. Swimming behavior and dispersal patterns of headstarted loggerhead turtles
Caretta caretta. Aquatic Ecology, 37: 183-190.
Ghosh S. (2004). Measurement of Pressure Distribution and Forces Acting on an Airfoil. Mechanics of Fluids and Transfer Processes: Laboratory Experiment #3
11. Wyneken, J. 2001. The Anatomy of Sea