CHAPTER 3
Research Methodology
3.1 Population and Sample
This study uses all investors in Yogyakarta, who are investing in stocks, as the population. The samples are 100 investors in Yogyakarta. Researcher use purposive sampling not random sampling since the objective of this research is analyzing the relation between gender and investment decision. Criteria for sample are investor who investing in stock or currency trading. The investors come from some security companies throughout Yogyakarta, such as Valbury, IMF, Danareksa, Anugerah Securindo Indah, Bhakti Securities, BNI Securities, Bumiputera Capital Indonesia, Mega Capital Indonesia, Optima Securities, Pacific Capital, Recapital Securities, Reliance Securities, Sinar Mas Securities, Mahadana Securities, Tri Megah Securities.
3.2 Data and Data Gathering
questionnaire to the sample. The questionnaire is gotten from the internet (http://www.eng.iastate.edu/tkhira/select_papers/R.Resutls-webposting.pdf).
The main data collection strategy for this research was through distributing questionnaire. A total of one hundred and forty five questionnaires are distributed across some securities market in Yogyakarta, in order to pretend from error responds. First, researcher will ask for permission to the securities market to distribute the questionnaire to the investors. After get the permission, questionnaire will be distributed. Then, after the respondents give it back to the researcher, the questionnaires will be analyzed.
3.3 Measurement of Variables
The dependent variable in this research is investment decision. The independent variable in this research is gender. Researcher tries to analyze the relation between gender (independent variable) and investment decision (dependent variable). Thus, causal explanatory study is used in this research because this study explains the relationship among the variable.
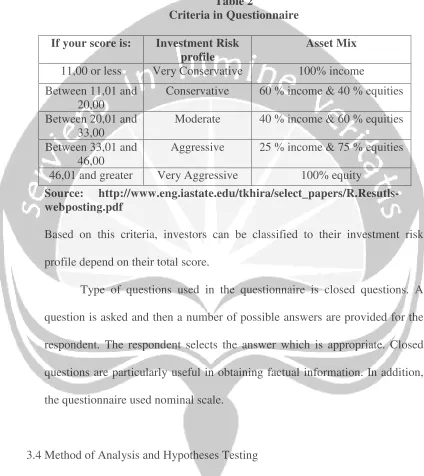
The questionnaire explores differences in women’s and men’s involvement in investments, risk tolerance levels, attitudes toward and confidence in investing. The criteria used in the questionnaire:
Table 2
Criteria in Questionnaire
If your score is: Investment Risk
profile
Asset Mix
11,00 or less Very Conservative 100% income Between 11,01 and
20,00
Conservative 60 % income & 40 % equities
Between 20,01 and 33,00
Moderate 40 % income & 60 % equities Between 33,01 and
46,00
Aggressive 25 % income & 75 % equities 46,01 and greater Very Aggressive 100% equity
Source: http://www.eng.iastate.edu/tkhira/select_papers/R.Resutls-webposting.pdf
Based on this criteria, investors can be classified to their investment risk profile depend on their total score.
Type of questions used in the questionnaire is closed questions. A question is asked and then a number of possible answers are provided for the respondent. The respondent selects the answer which is appropriate. Closed questions are particularly useful in obtaining factual information. In addition, the questionnaire used nominal scale.
3.4 Method of Analysis and Hypotheses Testing
independent variable. Dummy variables are also used to determine the relationship between qualitative independent variables or in this research gender and dependent variable. Third, to determine whether women choose less risky investment than men, t-tests were performed on each of the items.
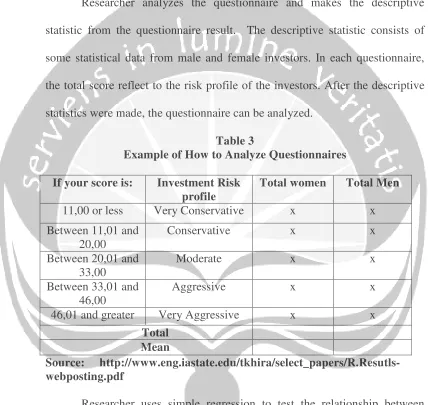
Researcher analyzes the questionnaire and makes the descriptive statistic from the questionnaire result. The descriptive statistic consists of some statistical data from male and female investors. In each questionnaire, the total score reflect to the risk profile of the investors. After the descriptive statistics were made, the questionnaire can be analyzed.
Table 3
Example of How to Analyze Questionnaires
If your score is: Investment Risk
profile
Total women Total Men
11,00 or less Very Conservative x x
Between 11,01 and
46,01 and greater Very Aggressive x x
Total Mean
Source: http://www.eng.iastate.edu/tkhira/select_papers/R.Resutls-webposting.pdf
Each of these lines was obtained from a fitted regression function of the form: Y = b0+ b1X
Y = Total Questionnaire Score X = Gender
The result of simple linear regression will be explained. Then, the first hypothesis will be tested t-test, p-test, and R2. This study uses t-test and p-test to determine the statistical significance between a sample distribution mean and a parameter. Before test the hypothesis with t-test and p-test, the null and alternative hypothesis will be made. The hypotheses are:
a. H0: Gender does not influence investment decision b. H1: Gender influences investment decision
In t-test, researcher used 5% level of significance. Then, setup the degree of freedom, those are 118. Find t-table with α = 5% and df= 118. Compare the t calculated and t table. If t calculated bigger than t table, it will reject the null and accept alternative hypothesis. It means that gender affect investment decision. In p-test, researcher also used α = 5%. The rejection of null hypothesis and acceptance of alternative hypothesis when p-value < α. Correlation analysis is used (R2) to check how much do the variation in investment decision is explained by the variation in gender.
The hypotheses for one sample t-test:
1 sample t-test for female’s mean
H0 :Women mean≤20,00; women classified as conservative investor H1: Women mean > 20,01; women classified as moderate investor
1 sample t-test for male’s mean
H0 :Men mean≤33,00; men classified as moderate investor H1: Men mean > 33,01; men classified as aggressive investor
The analyzer uses 95% confidence level. In hypothesis testing for the one sample t-test, statistical decisions are made to decide whether or not the population mean and the same mean are different. We will compare the calculated value with the table value. If the calculated value of the one sample t-test is greater than the table value, then we will reject the null hypothesis. Otherwise, we will reject the alternative hypothesis.
After 1 sample t-test finished, paired sample t-test is used to compare two population means in the case of two samples that are correlated, in this case, women mean and men mean. To calculate the paired sample t-test, first we have to set up the hypothesis. In a paired sample t-test, we set up two hypotheses.
After calculating the parameter, we will compare the calculated value with the table value. If the calculated value is greater than the table value, then we will reject the null hypothesis for the paired sample t-test.