Journal of Advanced Manufacturing Technology
A CASE STUDY: MATERIAL FLOW SIMULATION BASED ANALYSIS FOR
MAINTENANCE NETWORK IMPROVEMENT
P., Bilge
*1and A.A., Abdul Rahman*
21Department of Machine Tool and Factory Management,
Technische Universität Berlin, 10587, Berlin, Germany.
2Faculty of Manufacturing Engineering,
Universiti Teknikal Malaysia Melaka, Hang Tuah Jaya, 76100 Durian Tunggal, Melaka, Malaysia.
Email: *1[email protected]; *2[email protected]
ABSTRACT:The competitiveness of enterprises operating in complex environments depends on how well their value creation factors
can adapt to disruptions caused by unanticipated events. Building this resilience requires the ability to identify uncertainties and to model their impact on operations, which is difficult to achieve. Thus, increasing adaptability in maintenance and repair networks calls for an adequate approach to address uncertainties. It is necessary to consider the maintenance activities within and outside the company as well as those affecting all equipment supplier partners. Enhancement in simulation technique has opened the opportunity to analyse this complex system. This paper presents a comprehensive analysis introducing a potential approach using material flow simulation that models and simulates the impact of existing maintenance and repair activities to identify the uncertainties to increase the flexibility of the network while ensuring profitability and continuity.
KEYWORDS: Simulation, maintenance, network.
1.0 INTRODUCTION
Enterprises involved in the services industry of maintenance and repair are more affected by unsteady incoming work orders than product manufacturers, from scheduled to voluntary maintenance. The complexity of maintenance and repair activities is indicated by highly fluctuating work volumes between the maintenance and repair work orders, different disassembly and assembly depths, unplanned urgent work orders as well as differentiated qualification levels of the workers. Further exacerbating the situation is the varying conditions of workshops as operating equipment in a maintenance and repair network for the enterprise.
Therefore, to guarantee on-time delivery and short turnaround times, a reasonable sequencing and scheduling strategy in the context of maintenance planning and control is needed. For the realization of the strategy, suitable scheduling and priority rules are required. To support the analysis of complex systems, e.g., those involving maintenance, a wide variety of tools exist, from simple static spread-sheet-based tools to those incorporating more sophisticated simulation technology.
In order to solve sequencing problems, Hartmann and Nyhuis recommend the use of tool modelling and simulation for the validation of a suitable rule [1]. Models emphasize the main features of a system to clarify interrelationships and ensure transparency [2]. Simulation tools are widely used for manufacturing systems as well as services, defence, healthcare and public services [3]. An experimentation by simulation is defined with a simplified imitation of an operating system as it progresses throughput time, for the purpose of better understanding and/or improving the whole system [4]. Simulation techniques are able to analyse the performance of any operating system without affecting the real system.
This paper is based on an industrial case study which use material flow simulation technique to analyse the current implementation scheduling and sequencing strategy for vehicular maintenance network of a cleaning and waste management service company. The services provided by the company range from the punctual emptying of refuse bins, ecological waste utilization and disposal, to street cleaning and winter road maintenance.
2.0 SIMULATION AS A DECISION TOOL
Simulation in particular has been applied to various aspects of manufacturing and services since the 1960s [5]. The introduction of computers in simulation made possible to analyse more complex problems and the 1990s in particular saw the possibilities of simulation expand as a combined result of software development and reduced cost of computing power. In this context, digital models are used for the experimentation. Today there are several types of simulation (computer simulation) which exist in the manufacturing and services industry, such as Finite Element Method (FEM) Simulation, Material Flow Simulation, 3D-Graphical Simulation and Kinematics Simulation [6]. These simulation types differ from one another depending on functionality and area of application (Figure 1).
Figure 1: Simulation type in manufacturing factory [5]
Support by the improvement in ICT, simulation is increasingly used in maintenance planning [7]. Due to the wide range of time-dependent and random system values, and the highly networked interactions in current maintenance systems, mathematical-analytical methods soon reach their limits in analysing of such systems. With the aid of simulation, it is possible to examine and assess the behaviour of complex maintenance network over time in the planning phase and operation phase.
One of the most frequently used simulation types in manufacturing and services industry is discrete event simulation [8]. The kernel of this simulation type is the concept of discrete event which the states that variables change only at the discrete points in time at which events occur. Specifically, from starting the simulation and through the initialization, defined events are entered on the event list. These events are then executed according to the time that they need to be executed. Based on the evaluation of the simulation control logics, new events are listed in the event list. This process will continue until the simulation ends.
3.0 MAINTENANCE NETWORK
As a value creation module, the main features of maintenance systems include business processes, their organisation, the resources used, and the outcomes. Cooperative and interaction between value creation modules will lead to value creation network [10]. Value creation networks are characterized by a high level of complexity and an abundance of data to be identified and concentrated on relevant and appropriate aspects in the optimisation models. Seliger introduces the factors of value creation networks as product, process, equipment, organisation and human [11].
Vehicles represent the products in the considered maintenance and repair network. Business processes cover all maintenance and repair activities, whether preventive, predictive or corrective. Resources and materials are used as equipment in the workshops. Replacement materials are obtained on demand from a centralised warehouse. The organisation, planning and control in and between the workshops entail progressive detailing and the performance of respective maintenance and repair processes. The number and qualification level of employees (human), their knowledge, relationships, and absenteeism considerably influence the performance of the maintenance network.
The performance of such a complex system that involves maintenance activities is determined by the reliability and availability of the system components, which are dependent on time and costs. The goal is to create high reliability and output with minimal costs and input. A reliable system functions at the performance level that satisfies the needs of the customer. Reliability is assessed by measuring the downtime of the whole system, of its parts or of only specific equipment, i.e. reliability is the ability of a component to perform its required function for a given time interval.
Statistical distributions, e.g., the Weibull distribution for mechanical system elements, are used to describe the stochastic failure behaviour of the items. This kind of distribution uses the remaining life of an item to calculate the maintenance intervals for the item determined.
The primary function of maintenance is to reduce both scheduled and unscheduled downtimes in order to achieve high equipment availability and efficiency. Downtime is regarded as the termination of an item’s ability to perform an action as required [12]. The best maintenance strategy to increase the efficiency of maintenance is sequencing and scheduling the right maintenance type at the right time at the right place. If the maintenance is effective, failures on critical components and thus their consequences should be reduced or eliminated. The selection of an appropriate maintenance approach is crucial. Various forms of maintenance are standardized according to the European Standard EN13306 [13].
Therefore, the number and frequency of failures is a key performance indicator (KPI) for maintenance effectiveness. Another KPI for maintenance performance are costs caused by the failure, its repair and related consequences. However, no universal standards exist for the KPIs because of the diversity of companies. Another KPI is time, e.g., operating time, periodic maintenance time, condition based maintenance and additional-run-to-failure time of vehicles [14]. Vehicles in the service business produce profit for the company through their operating time, which is generally recorded as the cumulative working time of the product since its last overhaul.
Periodic maintenance is a preventive method with predetermined plans and schedules for maintenance and repair activities to keep a product in working condition through the process of checking and reconditioning. This type of maintenance is effective if the useful lives of items can be accurately determined [15].
Condition-based maintenance is a predictive approach. It implements modern measurement tools and signal processing methods proactively to diagnose the condition of the vehicle during the operation time and to optimise the maintenance intervals. This approach is effective when prognostics are available, but it is more cost intensive. Sensors and software tools are used here for the monitoring and analysis of parameters of the desired item.
Preventive and predictive maintenance require intervening before the failure event occurs, maximising safety and minimising environmental and operational consequences. These types of maintenance incur costs based on replacement materials, lost operations, workforce and material, such as rags and lubricants for maintenance and repair activities. These are cost-intensive measures [16].
3.0 DESCRIPTION OF A CASE STUDY
The business of collecting waste and cleaning the streets throughout the year requires an effective fleet with different kinds of vehicles operating in a predefined area. The vehicle’s condition is affected by several factors such as type, number, age and arrangement of components in the vehicle. The operating and environmental conditions, including operating personnel, working habits and safety measures, also impact the wear [17].
The steps in running the maintenance and repair activities depend on the conditions of the vehicle varying in duration, required workforce and necessary equipment. To prevent unexpected large failures, some maintenance activities are collected preventively in scheduled and run regularly on the vehicles. The activities are performed in workshops with different repair stations. This aspect of the maintenance and repair presents sequencing problems with a pre-assignment of vehicles to repair stations.
The objective of the study is to balance the volume of work orders by utilising the network’s capacity to minimize the throughput time of maintenance work orders. To meet this challenge, the current implementation sequencing and scheduling strategy of the maintenance network has been modelled and simulated to identify the uncertainties causes and potential improvements.
The vehicle fleet contains more than 1,600 vehicles enabling cleaning activities and waste management. There are 34 vehicle types such as garbage trucks, rinsing vehicles, collection vehicles, road sweepers, etc. The main target of the vehicles is to fulfil their tasks to clean and dispose in their predefined area. Each vehicle of the fleet is assigned to a location in the network according to its operation area. An operating vehicle starts its daily tour from a specific station und returns to the same location and parks when the shift ends.
Some small breakdowns, e.g., a flat tire, lead to temporary interruptions of the daily tour. These breakdowns are promptly repaired either by the driver or by a mobile workshop without the need of a maintenance work order. In the event of a scheduled maintenance check, a new preventive maintenance work order is placed after the daily tour. In this case, the vehicle is checked for further damages that can be repaired during the maintenance and repair activities without interrupting the daily assignment.
Damages or breakdowns of the vehicle reported by the driver and team, or found during the daily check-up, lead to a corrective maintenance work order. In this case, the vehicle will be moved from the parking area to the maintenance and repair workshop, hereinafter referred to as workshop. Approximately 24 operating and parking areas are assigned to 14 workshops, where vehicles with maintenance and repair requirements are initially received.
The municipal maintenance network developed in 1951 consists of two main workshops (MW) and 12 small workshops (W) distributed across the state. The small workshops are able to handle simple repairs for certain types of vehicles. The main workshops differ from small workshops by offering a large spectrum of preventive maintenance services (scheduled) and corrective repair activities (voluntary). If preventive maintenance or more serious corrective maintenance is required, the vehicles are moved from a small workshop to one of the main workshops. After the maintenance and repair activities are completed, these vehicles are returned to their parking area.
A workshop is full when all of its repair stations are occupied and their workers work on vehicles. This means the next incoming vehicle will be moved from the parking area to wait in a designated buffer. The capacity of these buffers is also limited; if they are also full, the vehicles must wait in the parking area.
Waiting to be maintained or repaired in any parking area results in an overall increase in non-operating time for one of these vehicles. Such waiting times should be minimized to improve performance of the service business. An optimal utilization of the network is therefore needed. While the current network works without any predefined priorities, workshop staff and management self-adjust based on the repair portfolio of other workshops and on their personal relations with colleagues from other workshops to prioritize some time-critical work orders
4.0 MODELLING AND SIMULATION
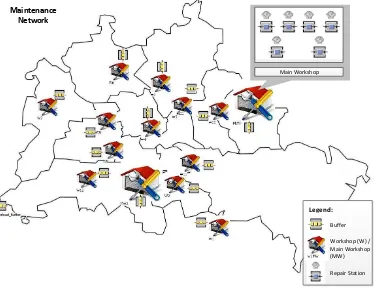
Three levels of subsystems was defined and modelled with the material flow simulation software from Siemens AG., Tecnomatix Plant Simulation. There are maintenance and repair network levels, workshop levels and repair stations levels. At the maintenance and repair network level, twelve small workshops and two main workshops were modelled based on their locations in the current state (Figure 2). A buffer is placed in front of each workshop to represent a parking place for vehicles waiting to be maintained or repaired in the workshop.
Maintenance Network
Legend:
Buffer
Workshop (W) / Main Workshop (MW)
Repair Station Main Workshop
Figure 2: Maintenance and repair network model
The First-In-First-Out (FIFO) strategy was used at the buffer so that the first vehicle entering the buffer will be the first one sent to the available repair station. As the capacity of these buffers is fixed and varied depending on workshop size, overload of maintenance work orders in buffers is possible. To overcome that problem, a dummy overall buffer was modelled.
The workshops are then refined at the workshops level where repair stations and workers for each workshop were modelled. In the next level, each repair station is refined according to the capacity and specification of the repair station, its resources and its worker productivity.
In the model, entities are representing work orders of maintenance and repair activity. There are two types of maintenance work orders: preventive maintenance and corrective maintenance. Preventive maintenance work orders were generated based on the scheduled preventive maintenance from the year 2009. Each work order was created at the specific date by a generator. This work order was then sent to the planned workshop buffer and will wait until a repair station is available.
Unplanned corrective maintenance work orders were created by random generators based on the mean time between failures (MTBF) of each vehicle type. One random generator for each vehicle type was modelled. The 34 random generators that representing each type of vehicle, create the corrective maintenance order independently.
In simulating the unplanned maintenance work orders, specific rule was applied: When a corrective maintenance work order is created, the location of the vehicle and the responsible workshop are identified. Availability of the responsible workshop is then checked. If the workshop is able to receive the maintenance work order, and if there are available repair stations or places at the buffer, the workshop will accept the work order. The vehicle will be sent to the buffer before reaching the repair station for maintenance activities. Then the maintenance work order will be completed.
at the main workshop. In case both main workshops cannot accept the work order, it will be sent to the overall buffer, where the maintenance work order will wait until the buffer of the responsible workshop can receive it.
Due to large differences between the reported working times, it is not suitable to use the mean of working times to model the considered maintenance and repair activities. Thus, to get a realistic output from the modelling, working times for each vehicle type are separated into corrective and preventive work orders, and analysed to provide occurrence probabilities. Five time- classes are therefore defined for each vehicle type. Afterwards, the number of observations in each time class are counted and set in relation to the total amount of observations for each vehicle type to obtain their relative share. This relative share, which is now considered as the occurrence probability of the average mean of each time class, is an appropriate dimension to obtain a realistic output from the modelling. In simulation, each work order will be assigned to a maintenance class with its operation time randomly based on the occurrence probability of their classes.
In modelling for a simulation, the level of abstraction always comes into question. A high level of abstraction will lead the model to approximate the real system, and a low level of abstraction will not adequately represent the real system. The optimum level of abstraction is difficult to define. In many cases, data availability and the duration of the study will be the determinant for modelling the abstraction level.
Due to that factor, some assumptions were made and implemented in the model. The assumptions are:
i. Every repair station is able to receive every type of vehicle (resource independent). ii. Every worker is able to perform all kinds of maintenance (capabilities independent).
iii. Each maintenance work order involves only one worker at a particular time. There are no parallel activities in one maintenance work order.
iv. Seasonal effect is not considered, and no priority is applied for seasonal vehicles.
The model was simulated for one year. The outcomes; utilisation of workshops, utilisation of workshops’ buffer and throughput time for maintenance work orders were recorded. The simulation result is presented and explained in the next chapter.
5.0 ANALYSIS OF SIMULATION OUTCOME
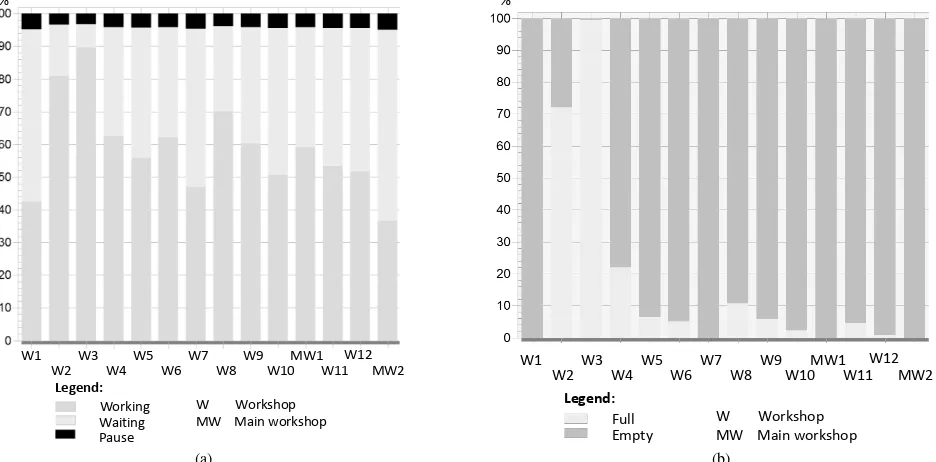
The simulation was run several times, and the average outcomes were recorded. Figure 3a shows the utilisation of workshops in the maintenance network. The value in the graph represents the mean utilisation of all repair stations at the workshop based on working, waiting and pausing percentages. Working means the repair station has a vehicle to be repaired and a worker to repair it. The repair station is empty in the waiting mode, and the pausing mode demonstrates breaks in the working shift.
From the graph, three workshops with high utilisation are identified. Workshop 3 (W3), workshop 2 (W2) and workshop 8 (W8) have an average utilisation of more than 70% in one year. With an average utilisation of between 50-60%, imbalance in utilisation occurs in the remaining workshops. Two factors for this imbalance have been identified. The first is a high ratio in preventive maintenance work orders in available repair stations at certain workshops. Preventive maintenance work orders created through a scheduled list implemented in 2009 had to be completed at the planned workshop and could not be transferred. Huge numbers of preventive maintenance work orders had been scheduled for a particular workshop without considering the fact that its capacity would lead to high utilisation of the workshop. The second factor in the imbalance comes from the corrective maintenance work order rules and arrangement. For corrective maintenance, the operation area of the vehicle determines the responsible workshop. Some vehicle types appear to be high in corrective maintenance, with a higher maintenance throughput time than others.
One component of the maintenance throughput time is waiting time. Most of the waiting time for a maintenance work order occurs at the workshop’s buffer. To investigate workshop influence in throughput time, the utilisation of the workshop’s buffer is recorded through their ratio of full and empty capacity during the simulation year. In other words, a workshop buffer can be seen as a bottleneck of the maintenance network. The recorded outcome is shown in Figure 3b. Compared with the workshop utilisation, a similar trend can be found. Workshop 3 (W3) and workshop 2 (W2) are the two workshops with high buffer utilisation. Both workshops’ buffers are almost full during the simulated year. This situation has led to longer waiting times for the scheduled maintenance work orders that have been assigned to these workshops.
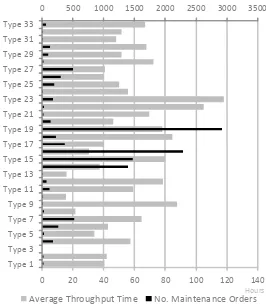
The next outcome from the simulation is throughput times of the maintenance and repair work orders for each vehicle type. Figure 4 shows the simulated annual number of maintenance work orders and average maintenance throughput times according to vehicle types. The times are recorded from the opening of a maintenance work order until its completion. With different maintenance work order classes, random maintenance times and uncertain waiting times, the maintenance throughput time for every vehicle type varies. There are four to six vehicle types with longer throughput times. In order to minimize the throughput time of maintenance in the whole network, these types of vehicles need to be invigilated during scheduling and arrangement of responsible workshops.
0 500 1000 1500 2000 2500 3000 3500
0 20 40 60 80 100 120 140
Type 1 Type 3 Type 5 Type 7 Type 9 Type 11 Type 13 Type 15 Type 17 Type 19 Type 21 Type 23 Type 25 Type 27 Type 29 Type 31 Type 33
Average Throughput Time No. Maintenance Orders
Hours
6.0 CONCLUSION
It is apparent that whilst simulation has been applied to planning and control of maintenance system, the extend literature is still limited. This is surprising when compared to domain such as planning and control of manufacturing system where simulation utilization is well established. This is because modelling maintenance operations is more complex and it is not developed as well as modelling manufacturing operations as more subsystems interact together in complex fashion.
Due to that concern, this paper has presented an industrial case study that use material flow simulation to analyse the current implemented scheduling and sequencing strategy of the maintenance and repair network. The paper describes how a complex maintenance network with different maintenance activities is modelled and simulated. The objective of this study is to identify the possible causes for imbalanced maintenance network which in future allow for experiments on the network model by applying different maintenance strategies, rules and scenarios.
As the main outcome of this paper, the presented analysis outcome can be used in developing improved scheduling and sequencing strategy for the maintenance network. Several alternatives of the maintenance network models with different maintenance strategies can be developed and simulated by modifying the existing model. The outcomes from these alternatives can then be analysed and compared technically and economically with the current implementation and between alternatives. The best alternative will be chosen, and its outcomes and strategies will be interpreted. As a conclusion of the case study, the best strategy for the maintenance network will be proposed to the industry partner to improve the network’s efficiency.
The transition to a flexible maintenance and repair network can be achieved by the precise definition of transmission rules, e.g. distance and capacity utilization, distinct planned and unplanned maintenance work orders or regulations for processing seasonally used equipment.
ACKNOWLEDGMENTS
This case study is a part of the Fraunhofer Innovation Cluster “Maintenance, Repair and Overhaul in Energy and Transport” (MRO). We would like to thank Hendrik Grosser und Marcus Kim for their contribution to the case study.
REFERENCES
[1] W. Hartmann and P. Nyhuis, Konsequenzen der Auftragspriorisierung. Modelltheoretische Beschreibung des Einflusses von Prioritätsregeln auf die
Durchlaufzeit in der Produktion, wt Werkstatttechnik online, Vol. 100 No. 4, pp. 304–309, 2010.
[2] VDI 2893 - Auswahl und Bildung von Kennzahlen für die Instandhaltung, Selection and formation of indicators for maintenance No. 2893, 2006. [3] M. Jahangirian, T. Eldabi, A. Naseer, L.K. Stergioulas and T. Young, Simulation in manufacturing and business: A review, European journal of
operational research, Vol. 203 No. 1, pp. 1–13, 2010.
[4] S. Robinson, Simulation: The practice of model development and use, Wiley, Chichester, Eng, Hoboken, N.J, 2004.
[5] A.A. Abdul Rahman, Approach for Integrating Predictive-Reactive Job Shop Scheduling with PLC-Controlled Material Flow. Dissertation at Technische Universität Berlin, 2013.
[6] A.A. Abdul Rahman and G. Seliger, Simulation as a tool in Self Adaptive Control for Flexible Assembly Systems, in: Proceedings of 44th CIRP Conference on Manufacturing Systems, 2011.
[7] A.A. Alabdulkarim, P.D. Ball, A. Tiwari, State of the Art of Simulation Applications in Maintenance Systems, in: Proceedings of 44th CIRP Conference on Manufacturing Systems, 2011.
[8] G. Reinhart and K. Feldmann, Simulation – Schlüsseltechnologie der Zukunft? Stand und Perspektiven. Herbert Utz Verlag München, 1997. [9] DIN-31051 - Grundlagen der Instandhaltung (Fundamental of Maintenance). Beuth Verlag GmbH, 2001.
[10] G. Seliger, Sustainable Manufacturing: Shaping Global Value Creation, Springer, Berlin, 2012.
[11] G. Seliger, Sustainability in manufacturing: Recovery of resources in product and material cycles, Springer, Berlin, 2007.
[12] R. Smith and R.K. Mobley, Rules of thumb for maintenance and reliability engineers, Elsevier/Butterworth-Heinemann, Amsterdam, Boston, 2008. [13] DIN EN 13306 –Instandhaltung: Begriffe der Instandhaltung (Maintenance: Definition), Dreisprachige Fassung EN 13306:2010, 2010.
[14] P.S. Rajpal, K.S. Shishodia and G.S. Sekhon, An artificial neural network for modeling reliability, availability and maintainability of a repairable system, Reliability Engineering & System Safety, Vol. 91 No. 7, pp. 809–819, 2006.
[15] A. Sharma, G.S. Yadava and S.G. Deshmukh, A literature review and future perspectives on maintenance optimization, Journal of Quality in Maintenance Engineering, Vol. 17 No. 1, pp. 5–25, 2011.
[16] A. Salonen and M. Deleryd, Cost of poor maintenance: A concept for maintenance performance improvement, Journal of Quality in Maintenance Engineering, Vol. 17 No. 1, pp. 63–73, 2011.
![Figure 1: Simulation type in manufacturing factory [5]](https://thumb-ap.123doks.com/thumbv2/123dok/512606.58280/2.612.164.460.158.430/figure-simulation-type-in-manufacturing-factory.webp)