1
ROLE OF SHORT-TERM CARDIOVASCULAR REGULATION IN
HEART PERIOD VARIABILITY: A MODELING STUDY
Mauro Ursino, Elisa Magosso
Department of Electronics, Computer Science and Systems,
University of Bologna, I40136, Bologna, Italy.
Running head: Cardiovascular variability and short-term regulation
Address for Correspondence:
Mauro Ursino
Dipartimento di Elettronica, Informatica e Sistemistica viale Risorgimento 2
I-40136 Bologna, Italy Phone: +39 051 2093008 Fax: +39 051 2093073 email: [email protected]
ABSTRACT
A mathematical model of short term cardiovascular regulation is used to investigate how heart period variability reflects the action of the autonomic regulatory mechanisms (vagal and sympathetic). The model includes the pulsating heart, the systemic (splanchnic and extrasplanchnic) and pulmonary circulation, the mechanical effect of respiration on venous return, two groups of receptors (arterial baroreceptors and lung-stretch receptors), sympathetic and vagal efferent branches, and a very-low frequency vasomotor noise. All model parameters were given on the basis of physiological data from the literature. We used data from humans whenever possible, while parameters for the regulation loops are derived from dogs’ experiments.
The model, with basal parameter values, produces an heart period power spectrum with two distinct peaks (the HF peak at the respiratory rate and a LF peak at about 0.1 Hz). Sensitivity analysis on the mechanism gains suggests that the HF peak is mainly affected by the vagal mechanism, whereas the LF peak is increased by a high sympathetic gain and reduced by a high vagal gain. Moreover, the LF peak depends significantly on the reactivity of resistance vessels and is affected by noise, amplified by the sympathetic control loop at its resonance frequency. The model may represent a new tool to study alterations in the heart period spectrum on the basis of quantitative physiological hypotheses.
INTRODUCTION
Analysis of heart rate variability has received much attention in the recent physiological literature, as a method to extract information on neural mechanisms regulating the cardiovascular system (4, 30, 31, 36). It is generally assumed that fluctuations in cardiovascular parameters originate from the interaction between the sympathetic and parasympathetic neural branches, and other low-frequency sources of noise (such as those caused by humoral, termal or vasomotor control). In particular, two rhythms are generally observed in the heart period spectrum: a respiratory rhythm or high frequency (HF) rhythm (located around 0.2-0.25 Hz in humans), which is considered a marker of vagal activity, and a low-frequency (LF) rhythm (around 0.1 Hz in humans) which is thought to be a marker of sympathetic activity (28) or may reflect both vagal and sympathetic influences (3). Various maneuvers, which activate the cardiovascular control system (such as posture change or tilting) affect the heart period spectrum, leading to an increase in the LF component compared with the HF one.
Due to its potential physiological and clinical impact, analysis of cardiovascular variability has been the subject of extensive researches in the past decades, starting from the pioneering works by Guyton and Harris (18). Fundamental contributions in the field are the works by Akselrod et al. (4) and Koepchen et al. (24). Recent studies include both modern signal processing techniques (7, 33) and mathematical models (11, 15, 23, 39, 43). However, the etiology of heart rate variability in health and disease is still a matter of debate among physiologists. In particular, the role played by the various feedback regulatory loops and of sympathetic vs. parasympathetic neural branches is still insufficiently clarified.
cardiovascular regulation to investigate the possible mechanisms leading to heart period fluctuations in reliable physiological terms. The model includes several major aspects, which were not addressed in previous theoretical studies devoted to heart rate variability analysis. In particular, the model incorporates a separate distinction of systemic and pulmonary circulation, sympathetic feedback control loops working on systemic resistance, unstressed volume and heart contractility, the sympatho-vagal control on heart period, the mechanical effect of respiration on venous return and a very-low frequency vasomotor term. Moreover, all these aspects are mimicked on the basis of existing physiological data.
In the present study, as in our previous models, we assumed that heart period is the regulated quantity instead of heart rate. In fact, as pointed out by Hainsworth (20), HR is not the appropriate quantity to quantify autonomic effects, due to the gross non-linearity of the relationship linking HR to the efferent vagal and sympathetic activities (see Levy and Zieske (27)). Conversely, these non-linear relationships are naturally converted to linear if pulse-interval is used instead of heart rate (see (48) for more details).
Through a sensitivity analysis on model parameters, the present work aspires to clarify the conditions that may lead to clear LF oscillations in the heart period spectrum, and to analyze the relationships between the LF and HF rhythms.
QUALITATIVE MODEL DESCRIPTION
The present model differs from a former model, described in (48), as to the following points: Simplifications
1) Each feedback mechanism loop is described in a simpler way, without a definite distinction between the afferent and efferent neural activities.
This simplification allows us to work with a more conceptual model, without any evident alteration in the overall regulatory response.
Improvements
2) The action of lung-stretch receptors on cardiovascular parameters has been taken into account. These two improvements have been introduced to obtain a physiological HF component in the heart period spectrum. In fact, both mechanisms introduce spectral components in cardiovascular quantities at the respiratory rate.
In the following only the main aspects of the model are presented in qualitative terms. Model equations are given in the Appendix.
Heart and vessels
The description of the heart and vessels is similar to that used in a previous paper (48), hence only a few details are given here. The right and left sides of the heart are modeled by means of a passive atrium (described through a linear compliance) and an active ventricle. Contractility of the ventricle is simulated by means of a time-varying elastance in series with a time varying resistance. Shifting from the end-diastolic to the end-systolic values is governed by a pulsating activation function, which mimics the cardiac pace maker.
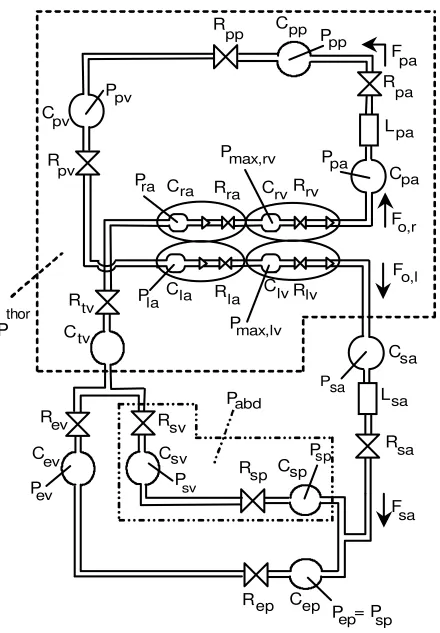
The vascular system comprehends a separate description of the pulmonary and the systemic circulation. The latter, in turn, contains the parallel arrangement of the splanchnic circulation and of the other extraplanchnic systemic vessels. Hemodynamic in each district (pulmonary, splanchnic and systemic extrasplanchnic) is reproduced by means of resistive, capacitive and inertial terms, as described in (48) (see Fig. 1). In particular, blood volume stored in capacitive terms is the sum of an unstressed volume and a stressed volume, the latter being computed as the product of compliance and transmural pressure. A further compartment, not included in the previous work, represents the large systemic veins inside the thorax, carrying venous return to the right heart (subscript tv in Fig. 1). A separate description of thoracic veins has been adopted to reach a more accurate description of the effect of respiratory changes on venous return and cardiac output.
compartments inside the thorax) and for abdominal pressure (Pabd, which is extravascular pressure for the splanchnic circulation). The expressions for intrathoracic and abdominal pressures during the respiratory cycle have been given according to the patterns reported in (35) (see the Appendix for more details). In the present study we assumed that the subject breaths with a constant respiratory cycle 5s long.
Finally, respiratory volume (which is an input for lung-stretch receptors) has been computed as a linear function of intrathoracic pressure. Parameters of this pressure-volume relationship were chosen to attain physiological values of tidal volume, minute ventilation and end-expiration volume in humans (34, 49).
The regulation mechanisms
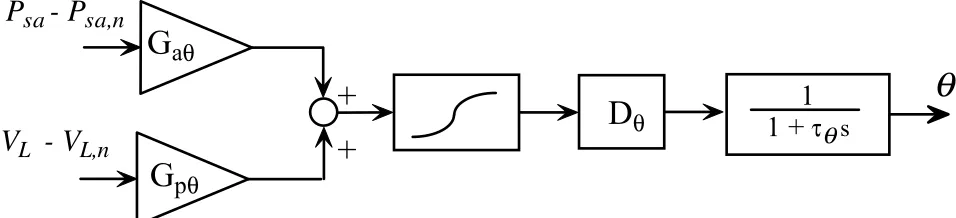
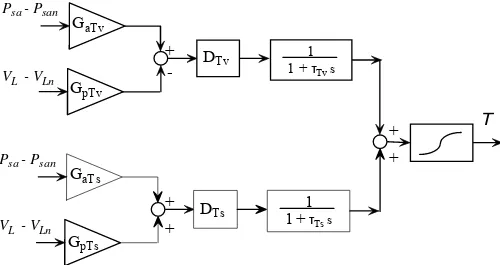
Description of short-term regulation mechanisms includes arterial baroreceptors and lung-stretch receptors. The information from these receptors modulates various cardiovascular parameters: systemic peripheral resistance (both in the splanchnic and extrasplanchnic vascular beds), venous unstressed volume (both in the splanchnic and extrasplanchnic vascular beds), heart contractility (i.e., the end-systolic elastance in the left and right ventricles) and heart period. The first three control actions are purely sympathetic in nature, and are described according to the general block diagram in Fig. 2. Worth noting is the presence of two different input stimuli, coming from arterial baroreceptors (sensitive to arterial pressure changes), and lung stretch receptors (sensitive to changes in respiratory volume). These input stimuli are multiplied by the respective mechanism gain and summed up. Finally, the effector response includes a sigmoidal static relationship (which accounts for the existence of upper and lower limits for the response) a pure delay and a first order low pass dynamic. The last two terms reproduce the main aspects of the response time pattern.
different gains and different dynamics for the vagal and sympathetic paths, while the sigmoidal relationship still describes the upper and lower limits of the effector response. Of course, some of the gains in Figs. 2 and 3 can be equal to zero (see section “Assignment of model parameters”) if the corresponding mechanism plays negligible role on the specific effector response.
Finally, the existence of other low-frequency sources of noise (such as those caused by humoral and thermal control or vasomotion) has been accounted for in an empirical manner, by superimposing a low-frequency (< 0.12 Hz) uniformely-distributed noise (zero mean value and assigned variance), on the expression of peripheral extrasplanchnic systemic resistance. The power spectrum of noise used in the simulations decreases quite linearly between 0 and 0.12 Hz.
Assignment of model parameters
All parameters in the heart and vessels have been given according to the previous work (48), in order to simulate normal human cardiovascular dynamics.
The parameters that characterize the gains and static curves of feedback regulation mechanisms in Figs. 2 and 3 have been assigned via the steps described below. Since most experiments have been carried out on dogs, all quantities were normalized to the basal level, assuming that regulation mechanisms cause the same percentage changes in man and animal.
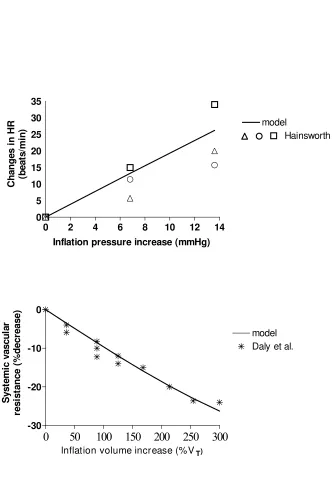
i) a value for the gains of the lung-stretch receptor mechanism on heart rate and resistance has been given on the basis of experimental data obtained in the dog (14, 19). These authors measured the changes in heart rate and in total systemic resistance during steady state variations in pulmonary inflation pressure and/or pulmonary volume (see Fig. 4). Moreover, according to (1) we assumed that the effect of lung-stretch receptors on heart rate is exclusively mediated by the vagus. Finally, we are not aware of any effect of lung-stretch receptor on heart contractility and on venous unstressed volumes; hence, the corresponding mechanism gains were set to zero.
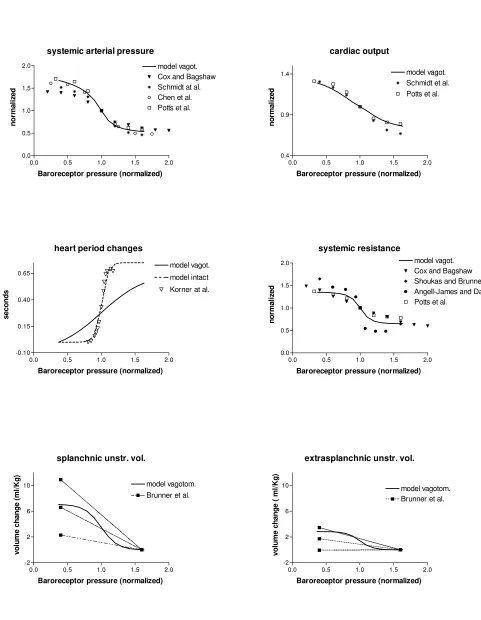
exception of the relationship for heart period, that is described below) have been given in order to simulate the results of open loop experiments performed in vagotomized dogs (5, 9, 12, 13, 38, 42, 44). In these experiments the carotid sinuses are isolated from the rest of the circulation and their pressure is changed in steps. However, since the vagus is cut, nor the efferent vagal activity, neither the afferent activities from aortic baroreceptors and lung-stretch receptors concur to the observed responses. Hence, all vagal gains and lung-stretch receptor gains on peripheral resistances were set to zero during these simulations. Results are shown in Fig. 5.
iii) In order to complete the calculation of the arterial baroreflex, we need to assign the gain of the vagal control on heart rate. Moreover, the possible role of the extracarotid (mainly aortic) arterial baroreceptors must be assessed. In this regard, some authors observed that these baroreceptors play a major role in the control of heart rate in humans and that they significantly contribute to the increase in sympathetic activity to resistance vessels (17, 40, 41). Accordingly, the vagal and sympathetic gains which characterize heart period control by the arterial baroreceptors have been re-assigned to reproduce the changes in heart period observed in young healthy men (25) during pharmacological changes in arterial pressure (see Fig. 5). In order to account for the possible role of extracarotid baroreceptors, the gain of the sympathetic control of heart rate exhibits a higher value, compared with the value inferred from experiments in vagotomized dogs. Similarly, the gain of the sympathetic control on systemic arterial resistances has been increased as well, to account for the possible effect of extracarotid baroreceptors. We assumed a ratio of extracarotid vs. carotid sympathetic control on resistance and heart period as large as 2.5, which approximately agrees with data by Ferguson et al. (17).
unstressed volume control are higher than those of the resistance control: in fact, about 1 minute is required before the accomplishment of complete active venoconstriction (45). The time constants and pure delays of the heart rate control have been assigned considering that the effect of vagus stimulation on heart period is completed within two or three beats, whereas the sympathetic control is characterized by slower dynamics (a few seconds) (20, 22, 32).
A list of all model parameters (both in the vagotomized experiments and in intact conditions) can be found in Table 1. The meaning of symbols is also explained in the Appendix.
RESULTS
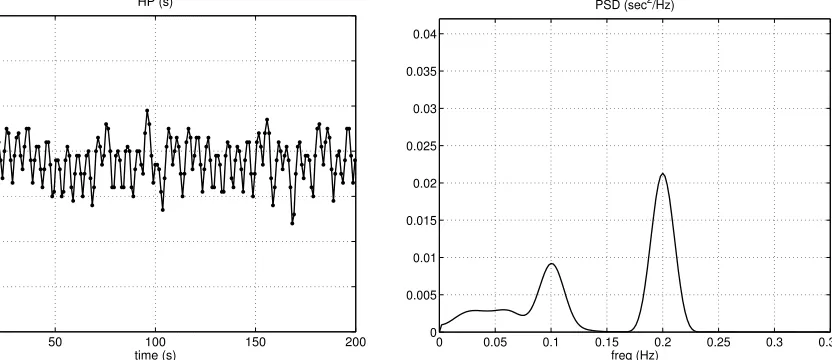
The left panel of Fig. 6 shows a segment of the heart period time pattern, simulated with the model using the basal parameter values as in Tab. 1. The right panel reports the power spectral density computed from a longer simulated signal (1000 s) using the Welch averaged periodogram method (2). The sequence was first detrended to eliminate frequencies close to zero; then several overlapping sections (60 s duration each, windowed by means of the Hanning window) were used to compute the averaged periodogram. Results clearly show the presence of two peaks in the power spectral density. The HF peak (0.2 Hz) reflects the respiratory activity, transmitted to the cardiovascular system both via the extravascular thoracic and abdominal pressures, and via action of the lung stretch receptors. The LF peak represents a resonance of the control loops, located around 0.1 Hz. Well evident in the spectrum is also the effect of the additional noise, at very low frequencies.
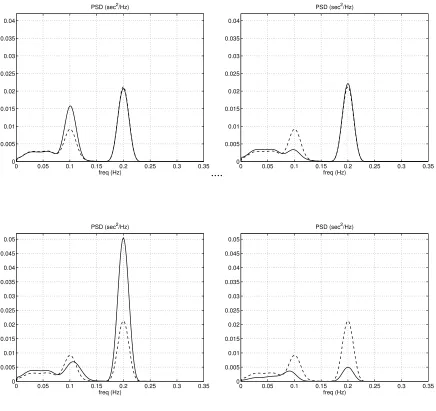
a mild decrease (left upper panel). By contrast, a moderate reduction in the sympathetic gains strongly attenuates the LF component (which becomes almost indistinguishable from noise) with a small increase in the HF component.
The two middle panels in Fig. 7 show the effect of a moderate change (±20%) in the vagal gains (that is the vagal gains on heart period from both arterial baroreceptors and lung stretch receptors). Increasing the vagal gains induce a large increase in the HF component, whereas the LF component is reduced (despite the sympathetic gains were still set at their basal value). The opposite effect (significant decrease in the HF band, with an increase in the LF band) occurs when the vagal gains are reduced.
The previous results are summarized in the lower left panel of Fig. 7, where the sympathetic gains were increased by 20%, and the vagal gains simultaneously decreased (-20%). The effect is a dramatic rise in the LF component of the spectrum, with a reduction of the HF peak.
Furthermore, in order to analyze the effect of very low-frequency noise (such as that induced by thermal or hormonal regulation) on the spectrum, simulation was repeated, with basal parameter values, by reducing the amplitude of the random noise by 50% of the initial value. The results, shown in the bottom right panel of Fig. 7, attest that the presence of this very low-frequency noise is important in the production of a clear LF component. The resonance in the control loops amplifies the existing noise at about 0.1 Hz, thus resulting in a more evident peak compared with the case with almost no noise.
In conclusion, sensitivity analyses in Fig. 7 point out that the HF peak mainly reflects the strength of vagal control (in fact, it is only mildly affected by the sympathetic gains), while the LF peak exhibits a more complex dependence on sympathetic and vagal mechanisms and on additional noise. In fact, this peak is affected both by a change in sympathetic strength and by a change in the vagal component. Moreover, the LF peak is also influenced by the level of superimposed noise.
the sensitivity of the different effectors to efferent activity may cause a change in the oscillation strength. This point is usually ignored in the physiological literature, while the amplitude of the LF and HF peaks is ascribed merely to efferent activity, by neglecting the role of the other components in the loop.
In order to analyze this aspect, we performed a sensitivity analysis on each effector response separately of the others. To this end, we selectively changed the central slope of the sigmoidal relationship for each effector (systemic peripheral resistance, venous unstressed volume, heart contractility, heart period) by maintaining the sensitivity of all other effectors at the basal value. The slope of each effector was modified by ±50% compared with the normal level, and the effect on the LF and HF peak evaluated.
Results are shown in Fig. 8, with reference to a modification of the response of peripheral resistances (upper panels) and heart period (lower panels). The results concerning a modification of the response for venous unstressed volumes and contractility are not shown since a change in these effectors did not cause any appreciable change in the strength and position of the LF and HF peaks.
The results in the upper panels of Fig. 8 show that the response of arterioles (which are the effectors for the resistance control) plays a pivotal role in the genesis of the LF wave. In fact, if the resistance response is depressed, the LF peak almost completely disappears, whereas a strong resistance response manifestly increases the LF peak. Moreover, as well expected, the resistance sensitivity has no effect on the HF peak.
Results in the bottom panels of Fig. 8 reveal that a strong sensitivity of the cardiac pacemaker (hence of heart period response) to efferent activity results in a higher HF peak, but this sensitivity has a modest effect on the amplitude of the LF peak. As well expected, a scarce sensitivity of the sinus node causes a depression of both LF and HF peaks.
variations in sympathetic efferent activity and on the reactivity of resistance vessels) while the HF peak is especially expression of the vagal control on heart period and of sinus node reactivity.
DISCUSSION
The present work investigates the role of some short-term regulatory mechanisms on the genesis of heart rate variability (HRV), with the use of mathematical modeling and computer simulation techniques. Although various models have been presented in recent years for the study of HRV, the present introduces several new aspects and overcome previous limitations.
The idea that the arterial pressure control loop can cause oscillations in cardiovascular quantities has been portrayed in the physiological literature for many decades (see Guyton and Harris (18); see also Koepchen (24) for an ample review). Kitney (23) first proposed a non-linear model which involves a negative feedback loop, a pure time delay and a switching element to theoretically analyze the oscillatory behavior of the blood pressure control system. A popular model of HRV was proposed by DeBoer et al. (15) in the late eighties. It consists of a set of difference equations describing the baroreflex control, the input impedance of the systemic arterial tree, the contractile properties of the myocardium and the mechanical effect of respiration. With that model, the authors were able to explain the presence of a LF peak in the HR spectrum, ascribing it to a resonance of the baroreflex control loop, mainly due to the sympathetic time delay. However, these models are based on a very simplistic description of the cardiovascular system and of the heart, and include just a few features of the pressure control loop. Hence, their value is more on the analysis of the mathematical properties of the equations, rather than on physiological soundness.
Seydnejad and Kitney recently presented a more comprehensive model of cardiovascular regulation, finalized to the study of blood pressure and HR variability (43). The model consists of a set of differential equations and includes several aspects of cardiovascular regulation, such as the afferent baroreflex, the vagal and sympathetic modulation of heart rate, the sympathetic control of the vasculature, the mechanical effect of respiration, a centrogenic oscillator and a very low frequency vasorhythm. However, the non-linear dependence of blood pressure on heart rate, on respiration and on sympathetic excitation (i.e., the overall circulatory response) was identified empirically, through the analysis of Volterra series expansion, without the use of a cardiovascular model. Empirical mathematical models, based on the identification of AR equations, were extensively used by Baselli et al. (see (7) for a review). Although the last models represent helpful empirical tools, to quantitatively analyze spectra and extract specific features from data, they do not provide physiological underpinning on the mechanisms leading to cardiovascular variability.
The previous compendium underlines the need for a comprehensive mathematical model, which carefully embodies physiological knowledge, and can elucidate the possible origin of cardiovascular variability without the need for empirical learning procedures.
condition. This aspect strongly differentiates physiological models (like the present) from empirical models.
The primary result of the present study is that a spectrum of heart-period variability, similar to that observed in human subjects, emerges spontaneously from model simulations using basal parameter values. Subsequently, the sensitivity analysis on the effect of parameter changes furnished interesting clues on the origin and physiological significance of the HF and LF spectral components.
The HF component – The HF or respiratory component of the spectrum is determined by two concurrent mechanisms: i) The effect of SAP changes, mediated by the baroreflex. Systemic arterial pressure exhibits respiratory fluctuations, caused by the intrathoracic and abdominal pressure changes (mechanical effect) and by the lung-stretch receptor reflex working on resistance (neurogenic effect). The fluctuations systematically stimulate the baroreflex at the respiratory period (0.2 Hz in the present study). At this frequency, however, the baroreflex works entirely through its strong and fast vagal component, while the sympathetic component is almost completely damped out due to its low-pass filtering dynamic. ii) The direct effect of the lung-stretch receptor reflex on heart period, mediated by the vagus too.
The LF peak – As suggested by several authors (3, 28, 30, 31), model simulations confirm that the LF component of power spectrum is strongly affected by the sympathetic system. A change in the sympathetic gains, in fact, causes a dramatic alteration in this component of the spectrum, leaving the HF component almost unchanged. In particular, in order to achieve value of LF oscillations in agreement with those observed in humans, the model requires values of sympathetic gains working on heart period and resistance much higher than those deducible from open loop experiments in vagotomized dogs (see Fig. 5 and Tab. 1). These high values are justified by the presence of aortic baroreceptors (not operating in vagotomized conditions), and by the strong role of sympathetic control in humans (17, 40, 41). Actually, the present model results underscore the existence of a resonance induced by the slow sympathetic control loops around 0.1 Hz: this is congruent with the physiological considerations included in the model by Kitney (23) and De Boer et al. (15).
The effect of changes in vagal gains on the LF peak (Fig. 7, middle panels) deserves a comment. The result of Fig. 7 seems to contradict the observation by some authors (47), according to whom the LF peak is reduced by atropine that is a vagal blocking agent. Conversely, in our model a reduction in vagal gain causes an increase in the LF peak. This contradiction, however, is only apparent, and can be explained by the difference between average activity and fluctuations. The peaks in power spectrum reflect the fluctuations in neural activities at that given frequency, not the mean value of the neural activity. The fluctuations are conceptually different from the mean activity, and the relationship between these two aspects is far from being fully understood (3, 31). In the model, fluctuations are especially determined by the mechanism gains, but are also affected by the working point along the sigmoidal characteristic (see Fig. 2 ). All sensitivity analyses illustrated in Fig. 7 explore the effect of variations in the mechanism gains only, which cause large changes in fluctuations, without significantly modifying the working point along the sigmoidal relationship. Indeed, throughout this study, the working point was always located in the central linear part of the sigmoidal curve. In contrast, maneuvers which modify the average neural activity (such as atropine infusion, tilting or exercise) presumably causes a shift in the working point along the sigmoidal relationship. If the working point moves from the central part of the sigmoidal relationship toward saturation, fluctuations are reduced. By contrast, moving the working point from a saturation region toward the central region causes an increase in fluctuations. By way of example, during exercise or heart failure, average sympathetic activity increases, but the LF power may be reduced (6, 46). Similarly, if vagal activity is partially abolished by atropine administration, the working point of heart period shifts toward the lower saturation region (i.e., we have cardioacceleration) which dampens heart period variability. This effect should not be confused with a reduction in the vagal gain.
peak, while the other effectors (such as venous unstressed volume or contractility) are less important. The reason of this finding is that LF fluctuations originate from oscillations in blood pressure, which are detected by the baroreflex system and transmitted to heart period fluctuations. Pressure oscillations, in turn, are directly correlated with oscillations in resistance. Hence, if the aptitude of resistance vessels to respond to sympathetic influences is depressed, then the power of the LF spectral component will similarly decline.
The previous considerations stress that the LF peak does not only reflect efferent neural activity, but is sensibly affected by vessel reactivity too. As remarked by Malpas (31), the latter aspect is often ignored in the clinical/physiological literature, where the ratio LF/HF is just considered a marker of efferent neural activity, thus neglecting all other components participating to the pressure control loop.
Of course, the present model implies some simplifications and omissions, which may be the target of future improvements and extensions. The main limitations are critically commented below.
First, in the present study we focused attention on the autonomic pressure control as the main factor affecting the LF waves, whereas other possible mechanisms have been neglected. This choice was adopted since the aim of this work was just to investigate the role of autonomic control system in the genesis of HRV. However, as discussed by Koepchen in its review work (24) several other factors, and their complex non-linear interactions, may concur to the formation of LF waves besides autonomic regulation. These comprehend central, humoral and vasomotor factors. Moreover, not only the strength of these factors, but also their spectral distribution may be important in the aetiology of LF fluctuations. A possible effect of some of these mechanisms has been included in the present study only in an empirical way, in the form of VLF noise.
normally participate in the neural regulation of cardiovascular system, interacting with the negative feedback mechanisms (originating in the arterial baroreceptive and vagal afferents). Sympatho-sympathetic circuits can play a role in the genesis of heart rate variability and in particular in the genesis of the LF oscillations, as these mechanisms are sympathetic in origin.
Description of factors involved in HF waves is also simplified, and neglects some mechanisms described in the literature. In particular, the baroreflex system includes not only arterial (or high-pressure) baroreceptors, but also cardiopulmonary (low-pressure) baroreceptors (located in the atria, ventricle and pulmonary veins). Activity in these receptors may be significantly affected by changes in venous pressure induced by respiration, hence these receptors may parallel the effect of lung-stretch receptors. Moreover, several authors hypothesized that an important constituent of HF waves may be irradiation of impulses from the respiratory centers to cardiac vagal motor neurons (central mechanism).
Furthermore, in the present simulations only metronomic breathing was simulated, with a respiratory period as great as 5 seconds. As a consequence, the HF peak and the changes in vagal activity are more evident than during normal respiration, due to a synchronism between all respiratory components (28). This consideration justifies why, with basal parameter values, the model predicts a HF spectral component much greater than the LF one.
tamponade and constrictive pericarditis) producing an exacerbation of respiratory-induced hemodynamic events (pulsus paradoxus).
In the present study the model has been validated by demonstrating that the autonomic pressure reflex may induce oscillations in heart period with physiological characteristics, and by studying the size of the LF and HF components at different values of the parameters for the autonomic control. Of course, a broader validation is necessary in future works. This should include the following major items: a) analysis of arterial pressure fluctuations and comparison of the corresponding spectra at different locations along the vascular system; b) cross-spectral analysis among different quantities in the model, with special emphasis of phase differences among fluctuations; c) characterization of model behaviour using classical methods for non-linear analysis (such as a study of bifurcations, computation of embedded dimensions, entrainments among oscillators). All these topics may be the target of future works.
An important aspect, which deserves discussion, is the choice of species used to assign the parameter numerical values. Of course, the results obtained in this work depend on this choice, and scaling to other species requires caution.
band is at about 0.1 Hz in the human, 0.14 Hz in the dog, 0.3 Hz in the rabbit and 0.4 Hz in the rat (see (31) for extensive references). Hence, we emphasize that new “ad hoc” values should be assigned for the baroreflex loop parameters (especially time delays) if one intends to use the present model to simulate experiments in smaller animals.
APPENDIX: QUANTITATIVE MODEL DESCRITPION
The cardiovascular system
Equations for the heart and hemodynamics are formally similar to those used in the previous paper (48), hence they are not repeated for the sake of briefness. However, compared with the previous work, the present paper accounts for an extravascular pressure different from atmospheric pressure (i.e., not null) in the thoracic and abdominal cavity. As a consequence, vessel transmural pressure inside the thoracic cavity is computed as the difference between the intravascular and intrathoracic pressure (Pth), while transmural pressure at splanchnic vessels is intravascular pressure minus abdominal pressure (Pabd). Time patterns of intrathoracic and abdominal pressures during each respiratory cycle have been given in order to reproduce data measured by Moreno et al. (35). Intrathoracic pressure falls linearly during inspiration down to –9 mmHg, then rises linearly during expiration to recover the steady value of the respiratory pause (-4mmHg). Abdominal pressure decreases down to approximately –2.5 mmHg during inspiration, then rises to zero during expiration. The following equations hold:
where Tresp is the respiratory period, and Ti and Te denote the duration of inspiration and expiration, respectively. α is a dimensionless variable, ranging between 0 and 1, which represents the fraction of the respiratory cycle. α = 0 conventionally corresponds to the beginning of inspiration. An expression for α(t)
has been obtained by using an additional state variable ε(t): 1 resp T dt d = ε
with α (t) = frac(ε) (3)
where the function “fractional part” [frac( )] resets the variable α (t) to zero as soon as it reaches the value +1.
The regulation mechanisms
Description of the cardiovascular control system includes the response of several effectors (peripheral resistances and venous unstressed volumes, both in the splanchnic and extrasplanchnic vascular beds, heart period, left and right ventricular contractility), to stimuli coming from arterial baroreceptors and lung-stretch-receptors. Only in the control of the heart period, the autonomic division between the sympathetic and parasympathetic limbs has been considered; the other effectors have been assumed to depend on sympathetic activity only.
The sympathetic regulation mechanisms (peripheral resistances, venous unstressed volumes, end-systolic elastances) include a static sigmoidal relationship in series with a dynamic characteristic. The latter incorporates a pure delay and a first-order low-pass filter. The input to the sigmoid is the weighted sum of the information coming from the two groups of receptors. Arterial baroreceptors are sensitive to systemic arterial pressure, while lung-stretch receptors respond to changes in lung volume. The following equations hold:
(
sa san)
p(
L Ln)
a P P G V V
G
xθ = θ ⋅ − + θ⋅ − (4)
(
(t D ) (t))
1dt ) t ( d
θ σ
τ θ
θ θ
θ ⋅ − −
= (6)
θ represents the generic effector of the regulation (either Vusv, Vuev, Rsp, Rep, Emax,rv, Emax,lv); Psa
represents systemic arterial pressure and VL is lung volume. Psa,n is systemic arterial pressure basal value, while VLn is the lung volume at the end of a normal expiratory act. τθ and Dθ are the time constant and the time delay of the mechanism, and σθ represents the static sigmoidal relationship. σmax and σmin in Eq. 5 represent the upper and lower saturation levels of the effector response. The sigmoidal relationships are monotonically increasing as to unstressed volumes (Vusv and Vuev, i.e one must assume the + sign in Eq. 5) but are monotonically decreasing (− sign in Eq. 5) as to ventricle elastances (Emax,lv and Emax,rv) and peripheral resistances (Rsp and Rep). The parameter kθ sets the slope at the central point of the sigmoidal relationship. (Sθ0). The following relationship holds:
(
) (
4 θ0)
θ θ θ S
k = max − min ⋅ (7)
We assumed that in basal conditions the central slope Sθ0 is ± 1; in these conditions, parameters Gaθ , and
Gpθ in Eq. 4 represent the maximal gain (i.e., the gain at the central point of the sigmoid) of arterial baroreceptors and pulmonary receptors respectively, when the other mechanism is silent. Altering the value of Sθ0 (see Results in Fig. 8) corresponds to modify the ability of the effector θ to respond to sympathetic activity.
In addition, in order to simulate the action of low frequency processes (such as humoral and thermal regulation), a random low frequency noise (with a spectral contents approximately in the band 0÷0.12 Hz) has been superimposed on the extrasplanchnic peripheral resistance. Hence, we can write:
( )
t R( )
t A R( )
tRep = ep_con + ⋅ rand (8)
The control of heart period is different from the other ones since it involves a balance between the sympathetic and vagal activities. Hence, for each group of receptors, we used two different gain values, which reproduce the different impact of the reflex on the sympathetic and vagal control, respectively; moreover, we introduce two distinct dynamics, which account for the different temporal response of heart period to vagal and sympathetic stimulation. The equations for the heart period control are:
(
sa san)
pTv(
L Ln)
aTv
T G P P G V V
v = ⋅ − − ⋅ − (9)
(
sa san)
pTs(
L Ln)
aTs
T G P P G V V
s = ⋅ − + ⋅ − (10)
(
v (t D ) x (t))
1 dt ) t ( dx Tv v T v
Tv = ⋅ − −
τ (11)
(
s (t D ) x (t))
1 dt ) t ( dx Ts s T s
Ts = ⋅ − −
τ (12)
Ts Tv T x x
x = + (13)
e 1 e T T T T k T x T k T x max min + ⋅ + = (14)
where the meaning of symbols is analogous as in Eqs. 4-6, the subscripts s and v denote sympathetic and vagal control, respectively, and kT =
(
Tmax −Tmin) (
4⋅ST0)
. ST0 is the slope of the sigmoidal curve at its central point and it is equal to +1 in basal conditions. An alteration of this value (Fig. 8, lower panels) modifies the sensitivity of the sinus node to both sympathetic and vagal stimulation.Finally, lung volume VL, which is the input stimulus for lung-stretch receptors, is computed (in liters) from intrathoracic pressure, Pth, through the following equation:
th L . . P
V =19−01⋅ (15)
REFERENCES
1. Abboud, F. M. and M. D. Thames. Interaction of cardiovascular reflexes in circulatory control. In: Handbook of Physiol. Sect. II, Vol. III, The cardiovascular System: peripheral circulation and organ blood flow. Shepherd, J. T., F. M. Abboud, and S. R. Geiger, eds. Bethesda, Maryland, American Physiological Society. 1983, 675-753.
2. Akay, M.Biomedical signal processing. San Diego, Academic Press. 1994, 91-93.
3. Akselrod, S. Components of heart rate variability: basic studies. In: Heart rate variability. Malik, M. and A. J. Camm, eds. Armonk, NY, Futura Publishing. 1995, 147-163.
4. Akselrod, S., D. Gordon, F. A. Ubel, D. C. Shannon, A. C. Barger, and R. J. Cohen. Power spectral analysis of heart rate fluctuation: a quantitative probe of beat-to-beat cardiovascular control. Science 213: 220-224, 1981.
5. Angell James, J. E. and M. B. Daly . Effects of graded pulsatile pressure on the reflex vasomotor responses elicited by changes of mean pressure in the perfused carotid sinus-aortic arch regions of the dog. J. Physiol. 214: 51-64, 1971.
6. Arai, Y., J. P. Saul, P. Albrecht, L. H. Hartley, L. S. Lilly, R. J. Cohen, and W. S. Colucci. Modulation of cardiac autonomic activity during and immediately after exercise. Am J Physiol
256: H132-H141, 1989.
8. Brinker, J. A., J. L. Weiss, D. L. Lappe, J. L. Rabson, W. R. Summer, S. Permutt, and M. L. Weisfeldt. Leftward septal displacement durimg right ventricular loading in man. Circulation 61: 623-633, 1980.
9. Brunner, M. J., A. A. Shoukas, and C. L. MacAnespie. The effect of the carotid sinus baroreceptor reflex on blood flow and volume redistribution in the total systemic vascular bed.
Circ. Res. 48: 274-285, 1981.
10. Burgess, D. E., J. C. Hundley, S. G. Li, D. C. Randall, and D. R. Brown. First-order
differential-delay equation for the baroreflex predicts the 0.4-Hz blood pressure rhythm in rats.
Am J Physiol 273: R1878-R1884, 1997.
11. Cavalcanti, S. and E. Belardinelli. Modeling of cardiovascular variability using a differential delay equation. IEEE Trans Biomed Eng 43: 982-989, 1996.
12. Chen, H. I., C. Y. Chai, C. S. Tung, and H. C. Chen. Modulation of the carotid baroreflex function during volume expansion. Am. J. Physiol. 237: H153-H158, 1979.
13. Cox, R. H. and R. J. Bagshaw. Baroreceptor reflex control of arterial hemodynamics in the dog.
Circ. Res. 37: 772-786, 1975.
14. Daly, M. B., J. L. Hazzledine, and A. Ungar. The reflex effect of alterations in lung volume on systemic vascular resistance in the dog. J. Physiol. 188: 331-351, 1967.
16. Donald, D. E. and A. J. Edis. Comparison of aortic and carotid baroreflexes in the dog. J Physiol
215: 521-538, 1971.
17. Ferguson, D. W., F. M. Abboud, and A. L. Mark. Relative contribution of aortic and carotid baroreflexes to heart rate control in man during steady state and dynamic increases in arterial pressure. J. Clin. Invest. 76: 2265-2274, 1985.
18. Guyton, A. C. and J. W. Harris. Pressoreceptor-autonomic oscillation: a probable cause of vasomotor waves. Am. J. Physiol. 165: 158-166, 1951.
19. Hainsworth, R. Circulatory responses from lung inflation in anesthetized dogs. Am. J. Physiol.
226(2): 247-255, 1974.
20. Hainsworth, R. The control and phsiological importance of heart rate. In: Heart rate variability. Malik, M. and A. J. Camm, eds. Armonk, NY, Futura Publishing. 1995, 3-19.
21. Hirsch, J. A. and B. Bishop. Respiratory sinus arrhythmia in humans: how breathing pattern modulates heart rate. Am J Physiol 241: H620-H629, 1981.
22. Katona, P. G., J. W. Poitras, G. O. Barnett, and B. S. Terry. Cardiac vagal efferent activity and heart period in the carotid sinus reflex. Am. J. Physiol. 218: 1030-1037, 1970.
24. Koepchen, H. P. History of studies and concepts of blood pressure waves. In: Mechanisms of blood pressure waves. Miyakawa, K., H. P. Koepchen, and C. Polosa, eds. Berlin, Springer-Verlag. 1984, 3-23.
25. Korner, P. I., M. J. West, J. Shaw, and J. B. Uther. Steady-state properties of the baroreceptor-heart rate reflex in essential hypertension in man. Clin. Exp. Pharmacol. Physiol. 1: 65-76, 1974.
26. Kubota, T., H. Chishaki, T. Yoshida, K. Sunagawa, A. Takeshita, and Y. Nose. How to encode arterial pressure into carotid sinus nerve to invoke natural baroreflex. Am. J. Physiol. 263 (Heart Circ. Physiol. 32): H307-H313, 1992.
27. Levy, M. N. and H. Zieske. Autonomic control of cardiac pacemaker activity and atrioventricular transmission. J. Appl. Physiol. 27: 465-470, 1969.
28. Malliani, A. Association of heart rate varaibility components with physiological regulatory mechanisms. In: Heart rate variability. Malik, M. and A. J. Camm, eds. Armonk, NY, Futura Publishing. 1995, 173-188.
29. Malliani, A. and N. Montano. Emerging excitatory role of cardiovascular sympathetic afferents in pathophysiological conditions. Hypertension39: 63-68, 2002.
30. Malliani, A., M. Pagani, F. Lombardi, and S. Cerutti. Cardiovascular neural regulation explored in the frequency domain. Circulation 482-492, 1991.
32. Mancia, G. and A. L. Mark. Arterial baroreflexes in humans. In: Handbook of Physiology. Sect. 2: the Cardiovascular system. Vol. III. Shepherd, J. T., F. M. Abboud, and S. R. Geiger, eds. Bethesda, MD, The American Physiological Society. 1983, 755-793.
33. Mansier, P., J. Clairambault, N. Charlotte, C. Medigue, C. Vermeiren, G. LePape, F. Carre, A. Gounaropoulou, and B. Swynghedauw. Linear and non-linear analyses of heart rate
variability: a minireview. Cardiovasc Res 31: 371-379, 1996.
34. Mines, A. H.Respiratory Physiology. New York, Raven press. 1993.
35. Moreno, A. H., A. I. Katz, and L. D. Gold. An integrated approach to the study of the venous system with steps toward a detailed model of the dynamics of venous return to the right heart.
IEEE Trans Biomed Eng 16: 308-324, 1969.
36. Pagani, M., F. Lombardi, S. Guzzetti, O. Rimoldi, R. Furlan, P. Pizzinelli, G. Sandrone, G. Malfatto, O. Dell, and E. Piccaluga. Power spectral analysis of heart rate and arterial pressure variabilities as a marker of sympatho-vagal interaction in man and conscious dog. Circ Res 59: 178-193, 1986.
37. Peters, J., C. Fraser, S. Stuart, W. Baumgartner, and J. L. Robotham. Negative intrathoracic pressure independently decreases both left ventricular inflow and outflow. Am J Physiol 257 (Heart Circ. Physiol. 26): H120-H131, 1989.
39. Ringwood, J. V. and S. C. Malpas. Slow oscillations in blood pressure via a nonlinear feedback model. Am J Physiol Regul Integr Comp Physiol 280: R1105-R1115, 2001.
40. Sanders, J. S., D. W. Ferguson, and A. L. Mark. Arterial baroreflex control of sympathetic nerve activity during elevation of blood pressure in normal man: dominance of aortic baroreflexes.
Circulation 77: 279-288, 1988.
41. Sanders, J. S., A. L. Mark, and D. W. Ferguson. Importance of aortic baroreflex in regulation of sympathetic responses during hypotension. Evidence from direct sympathetic nerve recordings in humans. Circulation 79: 83-92, 1989.
42. Schmidt, R. M., M. Kumada, and K. Sagawa. Cardiovascular responses to various pulsatile pressures in the carotid sinus. Am. J. Physiol. 223: 1-7, 1972.
43. Seydnejad, S. R. and R. I. Kitney . Modeling of Mayer waves generation mechanisms. IEEE Eng. Med. Biol. 20: 92-100, 2001.
44. Shoukas, A. A. and M. Brunner. Epinephrine and the carotid sinus baroreceptor reflex.
Influence on capacitive and resistive properties of the total sytemic vascular bed of the dog. Circ. Res. 47: 249-257, 1980.
45. Shoukas, A. A. and K. Sagawa. Control of total systemic vascular capacity by the carotid sinus baroreceptor reflex. Circ. Res. 33: 22-32, 1973.
humans: is power spectral analysis largely an index of baroreflex gain? Clin Sci (Lond) 88: 103-109, 1995.
47. Taylor, J. A., D. L. Carr, C. W. Myers, and D. L. Eckberg. Mechanisms underlying very-low-frequency RR-interval oscillations in humans. Circulation 98: 547-555, 1998.
48. Ursino, M. Interaction between carotid baroregulation and the pulsating heart: a mathematical model. Am. J. Physiol. 275 (heart Circ. Physiol. 44): H1733-H1747, 1998.
49. Whipp, B. J. and R. L. Pardy. Breathing during exercise. In: Handbook of Physiology. The Respiratory System: Mechanics of Breathing. Vol. III, Sect. 3, Part 1. Macklem, P. T. and J. Mead, eds. Bethesda, MD, American Physiological Society. 1986, 605-629.
LEGENDS TO FIGURES
Fig.1 – Hydraulic analog of the cardiovascular system. Meaning of the symbols: P, pressures; F, flows; R, resistances; L, inertances; C, compliances; sa, systemic arteries; sp and sv, splanchnic peripheral and splanchnic venous circulation; ep and ev, extrasplanchnic peripheral and extrasplanchnic venous circulation; tv, systemic thoracic veins; ra and rv, right atrium and right ventricle; pa, pulmonary arteries;
pp and pv, pulmonary peripheral and pulmonary venous circulation; la and lv: left atrium and left ventricle; Pmax,rv and Pmax,lv, right and left ventricle pressure in isometric conditions; Pthor: intrathoracic pressure, i.e., the extravascular pressure for the compartments located inside the thorax (surrounded by a dashed line); Pabd: abdominal pressure, that is the extravascular pressure for the splanchnic circulation (delimited by a dash-dotted line).
Fig.2 – Block diagram describing the sympathetic regulation mechanisms acting on the generic effector θ. θ may represent either peripheral resistance in the splanchnic or extrasplanchnic systemic vascular beds (Rsp or Rep), venous unstressed volume in the splanchnic or extrasplanchnic systemic vascular bed (Vu,sv or Vu,ev), or end-systolic elastance in right or left ventricle (Emax,rv or Emax,rv). Psa and
Psan are instantaneous systemic arterial pressure and its normal mean value, respectively; VL indicates lung volume, and VL,n is its value at the end of expiration. Psa-Psa,n and VL-VL,n are the error perceived by arterial baroreceptors and pulmonary stretch receptors, respectively; Gaθ and Gpθ are the maximal gains of the two groups of receptors on effector θ. The two pieces of information from the receptors are summed up and passed through a static sigmoidal relationship (second block). The third and fourth blocks represent a pure delay, Dθ,, and a low-pass first-order dynamic with time constant τθ.
Fig. 4 – Response of heart rate and systemic vascular resistance to lung-stretch receptor activation.
Continuous lines: model results. Simulations were performed in the absence of arterial baroreflex (i.e., only lung-stretch receptors are operative). Hence, all the baroreflex gains were set at zero. □, ○, ∆: results of three experiments reported in Hainsworth (19); *: experimental data from Daly et al. (14). To facilitate comparison, we maintained the same input stimuli as used in in-vivo experiments, i.e., inflation pressure or inflation volume. Increase in inflation volume has been expressed in percent of tidal volume.
Fig. 5 – Summary of open-loop responses of arterial baroreflex in vagotomized conditions. Continuos thick lines are model simulation results. To simulate open loop conditions, pressure at baroreceptors was given a constant non-pulsating value, different from arterial pressure, changed in steps from 35 to 155 mmHg. To simulate vagotomia, pulmonary receptor gains (Gpθin Figs. 2 and 3,), and baroreflex vagal gain (GaTv in Fig. 3) were set at zero. Model results are compared with experimental data in the vagotomized dog in open loop conditions. To compare model data with data in the dog, the corresponding quantities were normalized or expressed per unit weight. Experimental points are from (5, 9, 12, 13, 38, 42, 44). Only in the case of heart period changes, the simulation has been repeated (dashed line) by including the baroreflex vagal gain, as well as pulmonary receptors gains, to reproduce results of phenylephrine infusion in young human volunteers (25) (∇). Moreover, during the last simulation baroreflex sympathetic gain on heart period (GaTs in Fig. 3) and on peripheral resistances (GaRep and
GaRsp in Fig. 2) have been enhanced to account for the role of aortic barorereceptors (17, 40, 41). The three experimental lines in the two bottom panels (unstressed volume control) are mean ± SD.
Fig. 7 – Results of sensitivity analysis on sympathetic and vagal gains. Upper panels: effect on the power spectrum density of increasing (left) and decreasing (right) the gains of all sympathetic mechanisms (working on peripheral resistances, venous unstressed volumes, heart period and heart contractility) by ±20% of their basal values. Middle panels: effect of increasing (left) and decreasing (right) vagal gains (i.e., the vagal gains on heart period from arterial baroreceptors and the lung stretch receptors) by ±20 % of their basal values. Left lower panel: combined effect of increasing sympathetic gains by + 20% and decreasing vagal gains by - 20% (i.e., the simultaneous occurrence of the two situations depicted in left upper and right middle panels); Right lower panel: effect of decreasing the amplitude of the very-low frequency random noise by –50%. For comparison, the basal power spectrum is reported in each panel (dashed line).
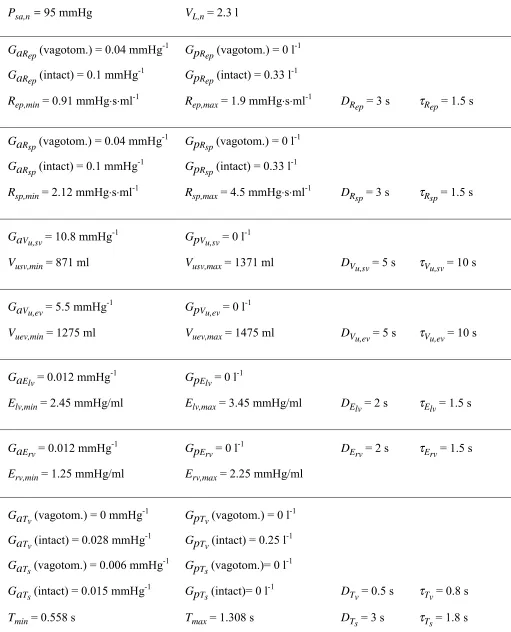
Table 1. List of parameters characterizing the feedback regulation mechanisms
Psa,n = 95 mmHg VL,n = 2.3 l
GaRep (vagotom.) = 0.04 mmHg-1 GpRep (vagotom.) = 0 l-1 GaRep (intact) = 0.1 mmHg
-1
GpRep (intact) = 0.33 l
-1
Rep,min = 0.91 mmHg⋅s⋅ml-1 Rep,max = 1.9 mmHg⋅s⋅ml-1 DRep = 3 s τRep = 1.5 s
GaRsp (vagotom.) = 0.04 mmHg-1 GpRsp (vagotom.) = 0 l-1 GaRsp (intact) = 0.1 mmHg
-1
GpRsp (intact) = 0.33 l
-1
Rsp,min = 2.12 mmHg⋅s⋅ml-1 Rsp,max = 4.5 mmHg⋅s⋅ml-1 DRsp = 3 s τRsp = 1.5 s
GaVu,sv = 10.8 mmHg
-1
GpVu,sv = 0 l
-1
Vusv,min = 871 ml Vusv,max = 1371 ml DVu,sv = 5 s τVu,sv = 10 s
GaVu,ev = 5.5 mmHg
-1
GpVu,ev = 0 l
-1
Vuev,min = 1275 ml Vuev,max = 1475 ml DVu,ev = 5 s τVu,ev = 10 s
GaElv = 0.012 mmHg-1 GpElv = 0 l-1
Elv,min = 2.45 mmHg/ml Elv,max = 3.45 mmHg/ml DElv = 2 s τElv = 1.5 s
GaErv = 0.012 mmHg
-1
GpErv = 0 l
-1
DErv = 2 s τErv = 1.5 s
Erv,min = 1.25 mmHg/ml Erv,max = 2.25 mmHg/ml
GaTv (vagotom.) = 0 mmHg-1 GpTv (vagotom.) = 0 l-1 GaTv (intact) = 0.028 mmHg
-1
GpTv (intact) = 0.25 l
-1
GaTs (vagotom.) = 0.006 mmHg-1 GpTs (vagotom.)= 0 l-1 GaTs (intact) = 0.015 mmHg
-1
GpTs (intact)= 0 l
-1
DTv = 0.5 s τTv = 0.8 s
Figure 1
C
pa
L
pa
R
pa
R
pp
C
pp
R
pv
C
pv
C
sa
L
sa
R
sa
C
sp
R
sp
R
ep
C
ep
C
sv
R
sv
R
ev
C
ev
C
ra
C
la
C
lv
C
rv
rv
lv
R
ra
la
F
o,l
F
o,r
Psa
P
sp
P
ep
P
ev
P
svFigure 2
G
aθP
saG
pθD
θ- P
sa,nV
L- V
L,n+
+
1
1 +
τθsFigure 3
G
aTvG
pTvP
sa- P
san+
-1
1 +
τTvsΤ
D
TvG
aTsG
pTsP
sa- P
san+
+
1
1 +
τTssD
TsV
L- V
LnV
L- V
Ln+
Figure 4
0 2 4 6 8 10 12 14 0
5 10 15 20 25 30 35
model
Hainsworth
Inflation pressure increase (mmHg)
C
h
ang
e
s i
n
H
R
(b
eat
s
/m
in)
0 50 100 150 200 250 300
-30 -20 -10 0
model Daly et al.
lnflation volume increase (%VT)
S
yst
em
ic
vascul
a
r
resi
st
an
ce (
%
d
ecr
Figure 5
systemic arterial pressure
0.0 0.5 1.0 1.5 2.0 0.0
0.5 1.0 1.5
2.0 model vagot. Cox and Bagshaw Schmidt at al. Chen et al. Potts et al.
Baroreceptor pressure (normalized)
nor m a li ze d cardiac output
0.0 0.5 1.0 1.5 2.0 0.4
0.9
1.4 model vagot.
Schmidt et al. Potts et al.
Baroreceptor pressure (normalized)
nor m a li ze d
heart period changes
0.0 0.5 1.0 1.5 2.0 -0.10 0.15 0.40 0.65 model vagot. model intact Korner at al.
Baroreceptor pressure (normalized)
s
e
c
onds
systemic resistance
0.0 0.5 1.0 1.5 2.0 0.0
0.5 1.0 1.5
2.0 model vagot.
Cox and Bagshaw Shoukas and Brunner Angell-James and Daly Potts et al.
Baroreceptor pressure (normalized)
nor m a li ze d
splanchnic unstr. vol.
0.0 0.5 1.0 1.5 2.0 -2
2 6 10
Brunner et al. model vagotom.
Baroreceptor pressure (normalized)
v o lu m e c h a n g e ( m l/K g )
extrasplanchnic unstr. vol.
0.0 0.5 1.0 1.5 2.0 -2
2 6
10 model vagotom.
Brunner et al.
Baroreceptor pressure (normalized)
Figure 6
0 50 100 150 200
0.6 0.7 0.8 0.9 1 1.1 1.2 1.3
time (s) HP (s)
0 0.05 0.1 0.15 0.2 0.25 0.3 0.35 0
0.005 0.01 0.015 0.02 0.025 0.03 0.035 0.04
PSD (sec2/Hz)
Figure 7
0 0.05 0.1 0.15 0.2 0.25 0.3 0.35 0 0.005 0.01 0.015 0.02 0.025 0.03 0.035 0.04
PSD (sec2/Hz)
freq (Hz)
0 0.05 0.1 0.15 0.2 0.25 0.3 0.35 0 0.005 0.01 0.015 0.02 0.025 0.03 0.035 0.04
PSD (sec2/Hz)
freq (Hz)
0 0.05 0.1 0.15 0.2 0.25 0.3 0.35 0 0.005 0.01 0.015 0.02 0.025 0.03 0.035 0.04
PSD (sec2/Hz)
freq (Hz)
0 0.05 0.1 0.15 0.2 0.25 0.3 0.35 0 0.005 0.01 0.015 0.02 0.025 0.03 0.035 0.04
PSD (sec2/Hz)
freq (Hz)
0 0.05 0.1 0.15 0.2 0.25 0.3 0.35 0 0.005 0.01 0.015 0.02 0.025 0.03 0.035 0.04
PSD (sec2/Hz)
freq (Hz)
0 0.05 0.1 0.15 0.2 0.25 0.3 0.35 0 0.005 0.01 0.015 0.02 0.025 0.03 0.035 0.04
PSD (sec2/Hz)
[image:42.595.76.544.114.760.2]Figure 8
0 0.05 0.1 0.15 0.2 0.25 0.3 0.35 0 0.005 0.01 0.015 0.02 0.025 0.03 0.035 0.04
PSD (sec2/Hz)
freq (Hz) ....
0 0.05 0.1 0.15 0.2 0.25 0.3 0.35 0 0.005 0.01 0.015 0.02 0.025 0.03 0.035 0.04
PSD (sec2/Hz)
freq (Hz)
0 0.05 0.1 0.15 0.2 0.25 0.3 0.35 0 0.005 0.01 0.015 0.02 0.025 0.03 0.035 0.04 0.045 0.05
PSD (sec2/Hz)
freq (Hz)
0 0.05 0.1 0.15 0.2 0.25 0.3 0.35 0 0.005 0.01 0.015 0.02 0.025 0.03 0.035 0.04 0.045 0.05
PSD (sec2/Hz)