DOI: 10.12928/TELKOMNIKA.v12i4.296 897
Sparsity Properties of Compressive Video Sampling
Generated by Coefficient Thresholding
Ida Wahidah*1,2, Tati Latifah R. Mengko2, Andriyan B. Suksmono2, Hendrawan2
1
School of Electrical Engineering, Telkom University Jl. Telekomunikasi No. 1, Bandung, Indonesia
2
School of Electrical Engineering and Informatics, Institut Teknologi Bandung Jl. Ganesa No. 10, Bandung, Indonesia
*Corresponding author, e-mail: [email protected]
Abstract
We study the compressive sampling (CS) and its application in a video encoding framework. The video input is firstly transformed into a suitable domain in order to achieve sparser configuration of coefficients. Then, we apply coefficient thresholding to classify which frames are to be sampled compressively or conventionally. For frames chosen to undergo compressive sampling, the coefficient vectors will be projected into smaller vectors using a random measurement matrix. As CS requires two main conditions, i.e. sparsity and matrix incoherence, this research is focused on the enhancement of the sparsity property of the input signal. It was empirically proven that the sparsity enhancement could be reached by applying motion compensation and thresholding to the non-significant coefficient count. At the decoder side, the reconstruction algorithm can employ basis pursuit or L1 minimization algorithm.
Keywords: compressive sampling, video coding, sparse representation, signal sparsity, motion
compensation
1. Introduction
Since many signals in nature have an internal structure that can be exploited greatly, it is not uncommon that we are able to compress those signals to some extent so that the recovery still acquires acceptable accuracy. In line with that, the compressive sensing/sampling is a relatively new paradigm in signal processing, where the sampling frequency might be lower than that of the Nyquist theorem requirement [1],[2]. The acquisition phase is very simple and integrated with the compression phase, as the name implies. Furthermore, compressive video sampling is one of the promising applications of CS due to its demand on the low complexity encoding process. As a consequence of the simple acquisition, the reconstruction phase is quite complicated yet computationally feasible.
The CS method can break the Nyquist Shannon limit by taking fewer measurements for exact recovery [1], as long as the signal is adequately sparse and the random matrices are incoherent to each other. Various algorithms have been proposed to reconstruct highly incomplete signals. These algorithms are categorized into three classes, i.e. convex optimization, greedy algorithm, and iterative thresholding. In this research, we use the convex optimization represented by basis pursuit (BP) [3]. Theoretically, basis pursuit should outperform matching pursuit (MP) in terms of accuracy. On the other hand, MP might be less complex and have faster processing time. In general, the basis pursuit method will reconstruct the optimum signal by means of linear programming. The received signal will be decomposed into smaller parts from an over-complete dictionary. The decision on which element must be selected is resulted from the calculation of L1 norm.
networks (WVSN) is studied by [7],[10], while single pixel camera application for earth observation can be found in [18].
2. Compressive Sampling
Considering the raw video sequence with very large digital data, with a traditional video coding method, the video input is first transformed, quantized, and then entropy coded. In the compressive sampling method, the video sequence or the transformed sequence is simply multiplied by a random measurement/projection matrix, such as Gaussian, Hadamard, Bernoulli, etc. There are two matrices utilized in this scheme, i.e. the sparsifying matrix and the projection matrix . The dimension of the projection matrix is MN, where M<N, implies a smaller number of rows than columns. It is expected that one can recover the video sequence with a slower measurement rate denoted by M. Among the properties fostering the goal of compressive sampling are the sparsity level of the input signal and the incoherence measure between those two matrices [8]. With compressive sampling, it was proven that we can apply sampling frequency less than Nyquist bound to sparse signals. However, the reconstructed signal/video quality remains satisfactory in terms of PSNR.
Each input entity x, e.g. pixel block or frame in N-length vector form, is processed according to a compressive sampling principle, where the input is multiplied by a random projection matrix of size MN. The basic formulation to obtain the output signal y of length M is as follows.
y = x (1)
Thus, the measurement rate of this sampling mechanism is R = M/N. Depending on the selection of processing level, the number of samples N may represent GOP (group of pictures) length, frame size, or even block size in cases where the input is split into several non-overlapped blocks.
The input signal x can be treated in either its original form or transformed into another basis function. After the transformation process, it is expected that the signal coefficients become sparser. The relationship can be written as
x = z (2)
where z is the representation of x in the domain. Nevertheless, for a video sequence with low spatial and temporal redundancy, which has fast motion scenes, the sparsity level of transform coefficients could still remain low. Hence, in addition to the sparsifying transform, we also apply several sparsity enhancement methods as discussed in Section 3. Doing so, better accuracy could be achieved [9].
3. Research Method
This section briefly discusses the signal sparsity or sparseness and its dynamics, as well as the enhancement method. Generally, one can have a sparser data by merely choosing a suitable basis function for the input signal, because most of the transform coefficients have negligible value. This is in accordance with Parseval theorem. However, the reconstruction stage of compressive sampling commonly searches for a sparsest solution. Therefore, the effort to represent the signal as sparse as possible can alleviate reconstruction error. In addition to the sparsifying transform, we also apply two enhancement methods. Firstly, motion compensation and estimation supported by a simple block matching algorithm is expected to result in sparse motion vectors. Secondly, thresholding to the amount and the absolute value of non-significant coefficients is supposed to separate the sparse and non-sparse frames, such that only sparse frames can go through compressive sampling.
3.1. Sparsity Enhancement by Motion Compensation
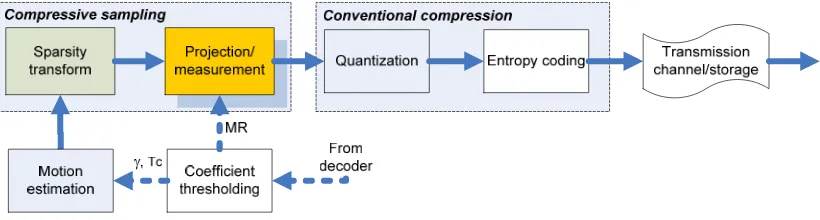
change from one image to another. The vectors are typically based on adjacent frames, forward or backward direction, in a video sequence. This is an ill-conditioned problem because the motion is in 3D but the images are on a 2D plane. The motion vectors refer to the whole image frame or specific parts, such as squares, rectangular blocks, or on a per pixel basis. We studied how the high-redundant video sequences yield better CS improvement over conventional compression compared with that of low redundant videos. Our compressive video system modifies the video processing platform [4] by integrating the acquisition phase, texture, and motion coding. Figure 1 shows the general block diagram of the system.
Figure 1. Our proposed compressive video sampling
3.2. Sparsity Enhancement by Coefficient Thresholding
We tailor the video sequence by pre-processing and dividing it into reference and non-reference frames. Then, coefficient threshold Tc and compressive threshold , i.e. the ratio of
non-significant coefficient count to the total number of transform coefficients, are determined empirically. The Tc value is based on the renowned Parseval theorem, while derivation is
based on the Candes equation. According to the classical theorem, the total energy of 2D discrete space is as follows.
∑ ∑∞ | , |
∞ ∞
∞ | Ω,Ψ | Ω Ψ (3)
After discrete cosine transform (DCT), we have the (p,q)th order DCT coefficient for an NN image having intensity f(x,y) denoted by Cpq and supported by the cosine kernel function of
the basis Dn(t) and a normalization factor ρ(n) [11], where 0 p,q,x,y N-1. The DCT
coefficients distribution resembles Laplacian in some experimental results after testing with the Kolmogorov-Smirnov method [12]. In most of our experiments, the popular JPEG block size of 88 pixels is used. Hence, the following type-II DCT coefficient value is considered.
, ∑ ∑ , cos cos (4)
The conditional probability of transform coefficient value p(Im,n|
2
) is approximately a zero-mean Gaussian distribution. Meanwhile, the empirical data of image block variance is consistent with half-Gaussian distribution approximations. Considering this case of block variance 2, the fit probability of transform coefficients is then a multiplication of the conditional probability and its variance probability. The expected value of the transform coefficients can be used to represent the coefficient threshold of our interest.
∞
∞ (5)
By using the maximum possible DC coefficient I0,0 = 2040 and the following relationship from the
integral table in [13].
we could compute the expected value of transform coefficient for thresholding, as well as the expected value of energy.
∞
√
. 8
(7)
This last equation presents the relationship between average energy after transformation and the block variance value. Greater variance means faster object motion and detailed spatial texture of the image. The maximum value of coefficient variance is proportional to I0,0
2
/4 or approximately 1.04e+06. The derivation of threshold value Tc from the energy
expectance is shown in Table 1.
Table 1. The derivation of coefficient threshold value Tc
s E[I2] E[I2]90% T
c
0,1 0,05 0,045 0
1 0.5 0,45 0
10 5 4,5 0
100 50 45 3
103 500 450 23
104 5000 4500 45
105 4,97104 4,47104 246
In order to derive the compressive threshold value (Ns/N > ), the tenets published in a
paper by [8] stated that random measurements can be used for signals s-sparse in any basis as long as obeys the following condition
ln . ln . (8)
The small constant of 1.7 is based on previous empirical results to guarantee less decoding failure [14]. To solve Equation (9), we use the Lambert W function, represented by W(z) and defined as the inverse of f(z) = zez satisfying W(z)eW(z) = z. The mathematical history of W(z) begins when Lambert solved the trinomial equation, that is subsequently transformed by Euler into the form [15] x-x = (-)vx+. For n = 1 and =
⋯ (9)
For = -1, we have
ln ln … . (10)
This equation solves our objective to obtain the sparsity level and eventually the compressive threshold . The last series converges for |v| < 1/e and defines a function T(v) called the tree function. Thus, the Lambert W function has the generic series expansion as follows.
∑∞ ! (11)
We use the negative branch of the Lambert function W-1(x), as it is designated to have
an inversely proportional relationship between measurement rate and compressive threshold value. According to [16], the rational function W-1(x) provides a relative approximation error for
W-1(x) of less than 10-4 for any x [-0.333, -0.033]
. . . . .
. . . (13)
4. Results and Discussion
We implement compressive video sampling in Matlab with three main scenarios and various video sequences. In the first scenario, we observe the influence of block or patch size, ranging from 44 to 3232 pixels, to the accuracy represented by average PSNR (peak signal to noise ratio). Larger block size could lose intrablock pixel-correlation, while smaller block implies longer total processing time. In the second scenario, we demonstrate how various types of video input, i.e. low to high redundancy, affect the reconstructed video’s PSNR. The low redundancy sequence pertains to fast moving objects in a scene or high details in video texture, and vice versa. In the last scenario, the compressive coefficient threshold and its optimal value in terms of PSNR is investigated. The higher the coefficient threshold, the greater the chance for the system to select conventional sampling, and eventually yielding better accuracy yet higher complexity. The video sequence employed in our experiments has a resolution size of 8064 pixels and a frame rate of 15 fps.
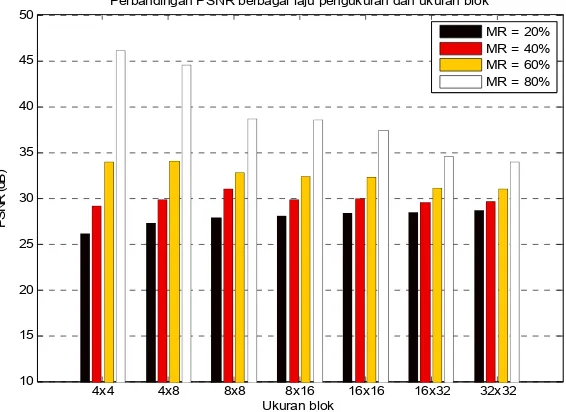
Figure 2. PSNR comparison for Traffic sequence in a video processing scheme for various block size and measurement rate
Our simulations include the effect of compressive sampling with the combination of measurement rate (MR), block size (BS), and various compressive thresholds on reconstructed video PSNR. These simulation results are then compared with the theoretical results, especially the values of coefficient threshold Tc and compressive threshold . In most simulations, we use
a block size of N = m×n pixels.
4x4 4x8 8x8 8x16 16x16 16x32 32x32 10
15 20 25 30 35 40 45 50
Perbandingan PSNR berbagai laju pengukuran dan ukuran blok
Ukuran blok
PS
N
R
(d
B)
Figure 3. PSNR comparison for several video input ordered based on spatial and temporal redundancy, GOP length = 12 [17]
Figure 4. Reconstructed PSNR of compressive threshold experiment, with coefficient threshold Tc = 35 and TSS algorithm
Endoscopy Mother Traffic News Rhinos MRI Mobile
20 25 30 35 40 45
Video Sequence (Low to High Redundancy)
PS
N
R
(
d
B
)
MR20% blok8x8 MR30% blok8x8 MR40% blok 8x8 MR20% blok32x32 MR30% blok32x32 MR40% blok32x32
50 55 60 65 70 75 80 85 90 95
27 30 33 36 39 42 45 48
Compressive Threshold Gamma (%)
PSNR
(d
B)
PSNR Comparison of Various Gamma Value, Tc=35, TSS, GOP=12, BS=8x8
The effect of block size variation to the reconstructed signal accuracy or PSNR is shown in Figure 2. Interestingly, despite the clear PSNR decrease over larger block size for MR = 80%, the contrast tendency is observed for MR = 20% to 60%. This could be caused by the ill-conditions of the low rate environment, such that the smaller BS could not outperform the larger BS. These results lead us to the selection of block size 88 and 3232 pixels in the subsequent experiments. Meanwhile, the reconstructed PSNR comparison of various input video sequence type is presented in Figure 3. For the next experiment, we choose the greyscale Traffic and Mobile sequence as high- and low-redundant video respectively.
Figure 4 shows the influence of compressive sampling threshold to the PSNR of reconstructed signal. It can be seen that at some point of , the PSNR observation results in peak value, i.e. around 80% to 90%. As predicted, the increase of measurement rate affects the reconstruction accuracy of high-redundant video greatly, represented by Traffic sequence. On the other hand, modest improvement is resulted for low-redundant video, i.e. Mobile sequence. This is in agreement with the theoretical analysis in our previous work, in which the recommendation for is 0.89. The compressive threshold of 85% is suitable for all of our experimental scenarios. Generally, a compressive video sampling method with sparsity enhancement and thresholding support could be implemented with prominent results in the terms of PSNR.
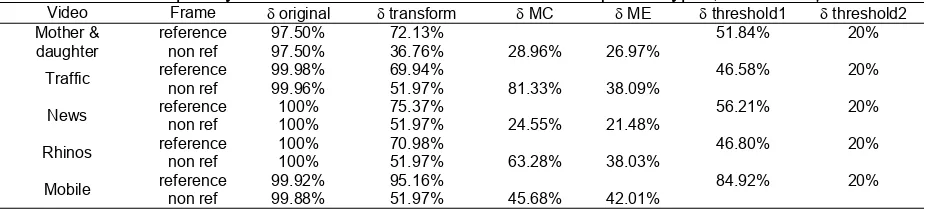
Table 2. The sparsity ratio on various methods and video sequence types, Tc=3 and =80%
Video Frame original transform MC ME threshold1 threshold2
Table 2 presents the sparsity ratio as the percentage of significant coefficient counts to the total samples after each process involved in our system. The greatest decrease in , i.e. yielding sparsest data, is achieved by sparsity transform with the average of 36.7%. The second process to make go down is the determination of coefficient threshold, denoted by threshold1 in the table, with the average of 19.5%. With a lower sparsity ratio, the required number of measurements in projection transform is obviously lower as well. Due to the utilization of threshold Tc=3 for the reference frames in this experiment, the resulted ratio is relatively high.
The higher threshold values in line with the theoretical analysis, for instance Tc=42, would
produce a very low sparsity ratio.
5. Conclusion
References
[1] Candes EJ., Romberg J., Tao T. Robust Uncertainty Principles: Exact Signal Recovery from Highly Incomplete Frequency Information. IEEE Transactions on Information Theory. 2006; 52: 489-509. [2] Donoho D. Compressed Sensing. IEEE Transactions on Information Theory. 2006; 52: 1289-1306. [3] Chen SS., Donoho DL., Saunders MA. Atomic Decomposition by Basis Pursuit. SIAM Journal on
Scientific Computing. 1998; 43: 129-159.
[4] Stankovic V., Stankovic L., Cheng S. Compressive Video Sampling. 16th European Signal
Processing Conf. Lausanne, Switzerland. 2008.
[5] Marcia RF., Willett R. Compressive Coded Aperture Video Reconstruction. 16th European Signal
Processing Conference. Lausanne, Switzerland. 2008.
[6] Prades-Nebot J., Ma Y., Huang T. Distributed Video Coding Using Compressive Sampling. Picture Coding Symposium. Chicago, USA. 2009.
[7] You L., Han Y., Li S., Su X. Source and Transmission Control for Wireless Visual Sensor Networks with Compressive Sensing and Energy Harvesting. Telkomnika Journal of Electrical Engineering. 2013; 11: 2468-2474
[8] Candes EJ., Romberg J., Tao T. Stable Signal Recovery from Incomplete and Inaccurate Measurements. Communications on Pure and Applied Mathematics. 2006; 59: 1207-1223.
[9] Fowler JE., Mun S., Tramel EW. Block-Based Compressed Sensing of Images and Video. Foundations and Trends in Signal Processing. 2012; 4: 297-416.
[10] Kang LW., Lu CS. Distributed Compressive Video Sensing. 34th IEEE International Conf. On
Acoustics, Speech and Signal Processing. Taipei, Taiwan. 2009: 1169-1172.
[11] Papakostas GA., Koulouriotis DE., Karakasis EG. Efficient 2-D DCT Computation from an Image Representation Point of View. In: Chen Y.S. Editor. Image Processing. InTech; 2009: 21-34. [12] Lam EY., Goodman JW. A Mathematical Analysis of the DCT Coefficient Distributions for Images.
IEEE Transactions on Image Processing. 2000; 9: 1661-1666.
[13] Gradshteyn IS., Ryzhik IM. Table of Integrals, Series, and Products. 5th ed. New York: Academic.
1994.
[14] Kung HT., Lin T., Vlah D. Identifying Bad Measurements in Compressive Sensing. 1st International
Workshop on Security in Computers, Networking and Communications. China. 2011.
[15] Corless RM., Gonnet GH., Hare DEG., Jeffrey DJ., Knuth DE. On the Lambert W Function. Advances in Computational Mathematics. 1996; 5: 329-359.
[16] Chapeau-Blondeau F., Monir A. Numerical Evaluation of the Lambert W Function and Application to Generation of Generalized Gaussian Noise with Exponent ½. IEEE Transactions on Signal Processing. 2002; 50: 2160-2165.
[17] Wahidah I., Hendrawan, Suksmono AB., Mengko TLR. Correcting Temporal Artifacts in Compressive Video Sampling with Motion Estimation. 19th Asia-Pacific Conference on Communications. Bali, Indonesia. 2013.
![Figure 3. PSNR comparison for several video input ordered based on spatial and temporal redundancy, GOP length = 12 [17]](https://thumb-ap.123doks.com/thumbv2/123dok/257309.505111/6.595.147.448.427.707/figure-psnr-comparison-ordered-spatial-temporal-redundancy-length.webp)